On November 7th at 16:00, the AICoin Research Institute conducted a graphic and text sharing session on the topic of "The King of Indicators: Advanced MACD Strategies" in the 【AICoin PC - Group Chat - Live Stream】. Below is a summary of the live stream content.
Today we will explain the king of indicators: MACD
Let's start with market analysis.
【The Research Institute predicts: Bitcoin will continue to rise!】
Prediction reason: After the MACD crosses the zero line, it immediately continues to rise after the first pullback. Currently, it is oscillating around the zero line and is about to face a new wave of attack. From the daily chart, this wave of attack is not over yet and will continue to rise!
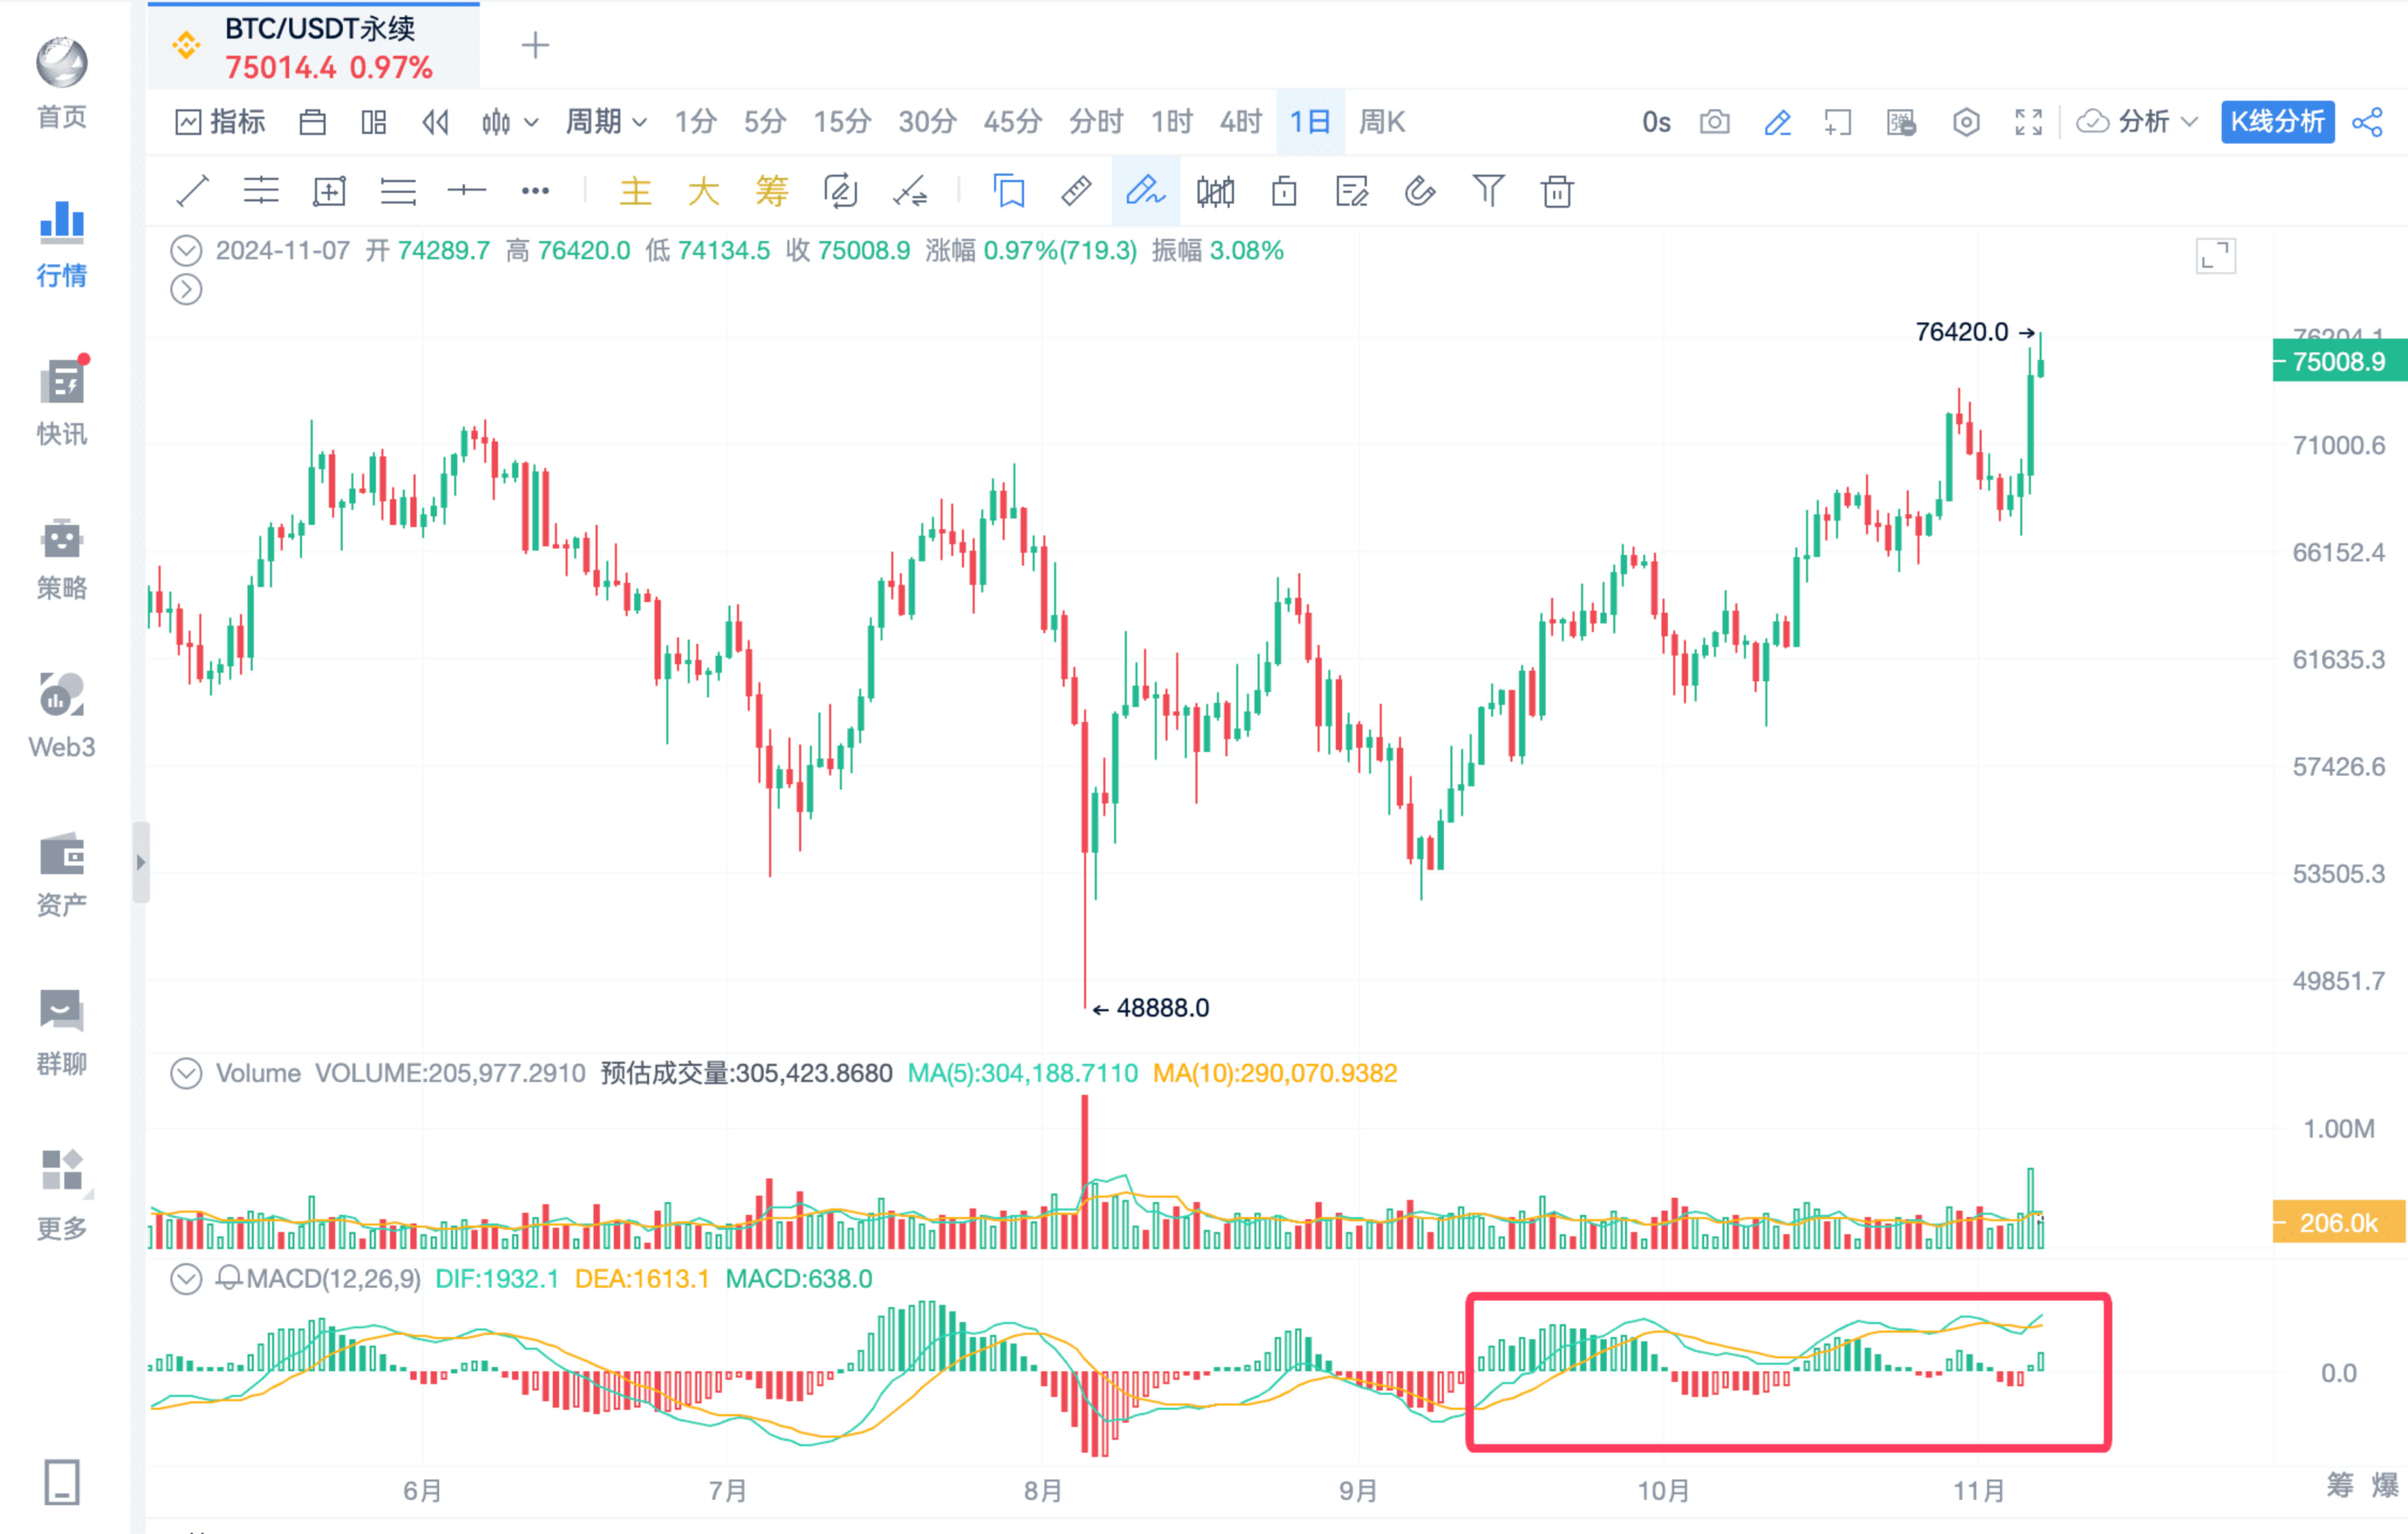
First MACD Practical Tip: Crossing the Zero Line!!
For those with a computer, please open the Binance contract trading pair with me, and I will teach you how to look at it.
I will use Bitcoin as an example; you can choose the trading pair you are interested in, search for the MACD indicator, and add it to the candlestick chart;
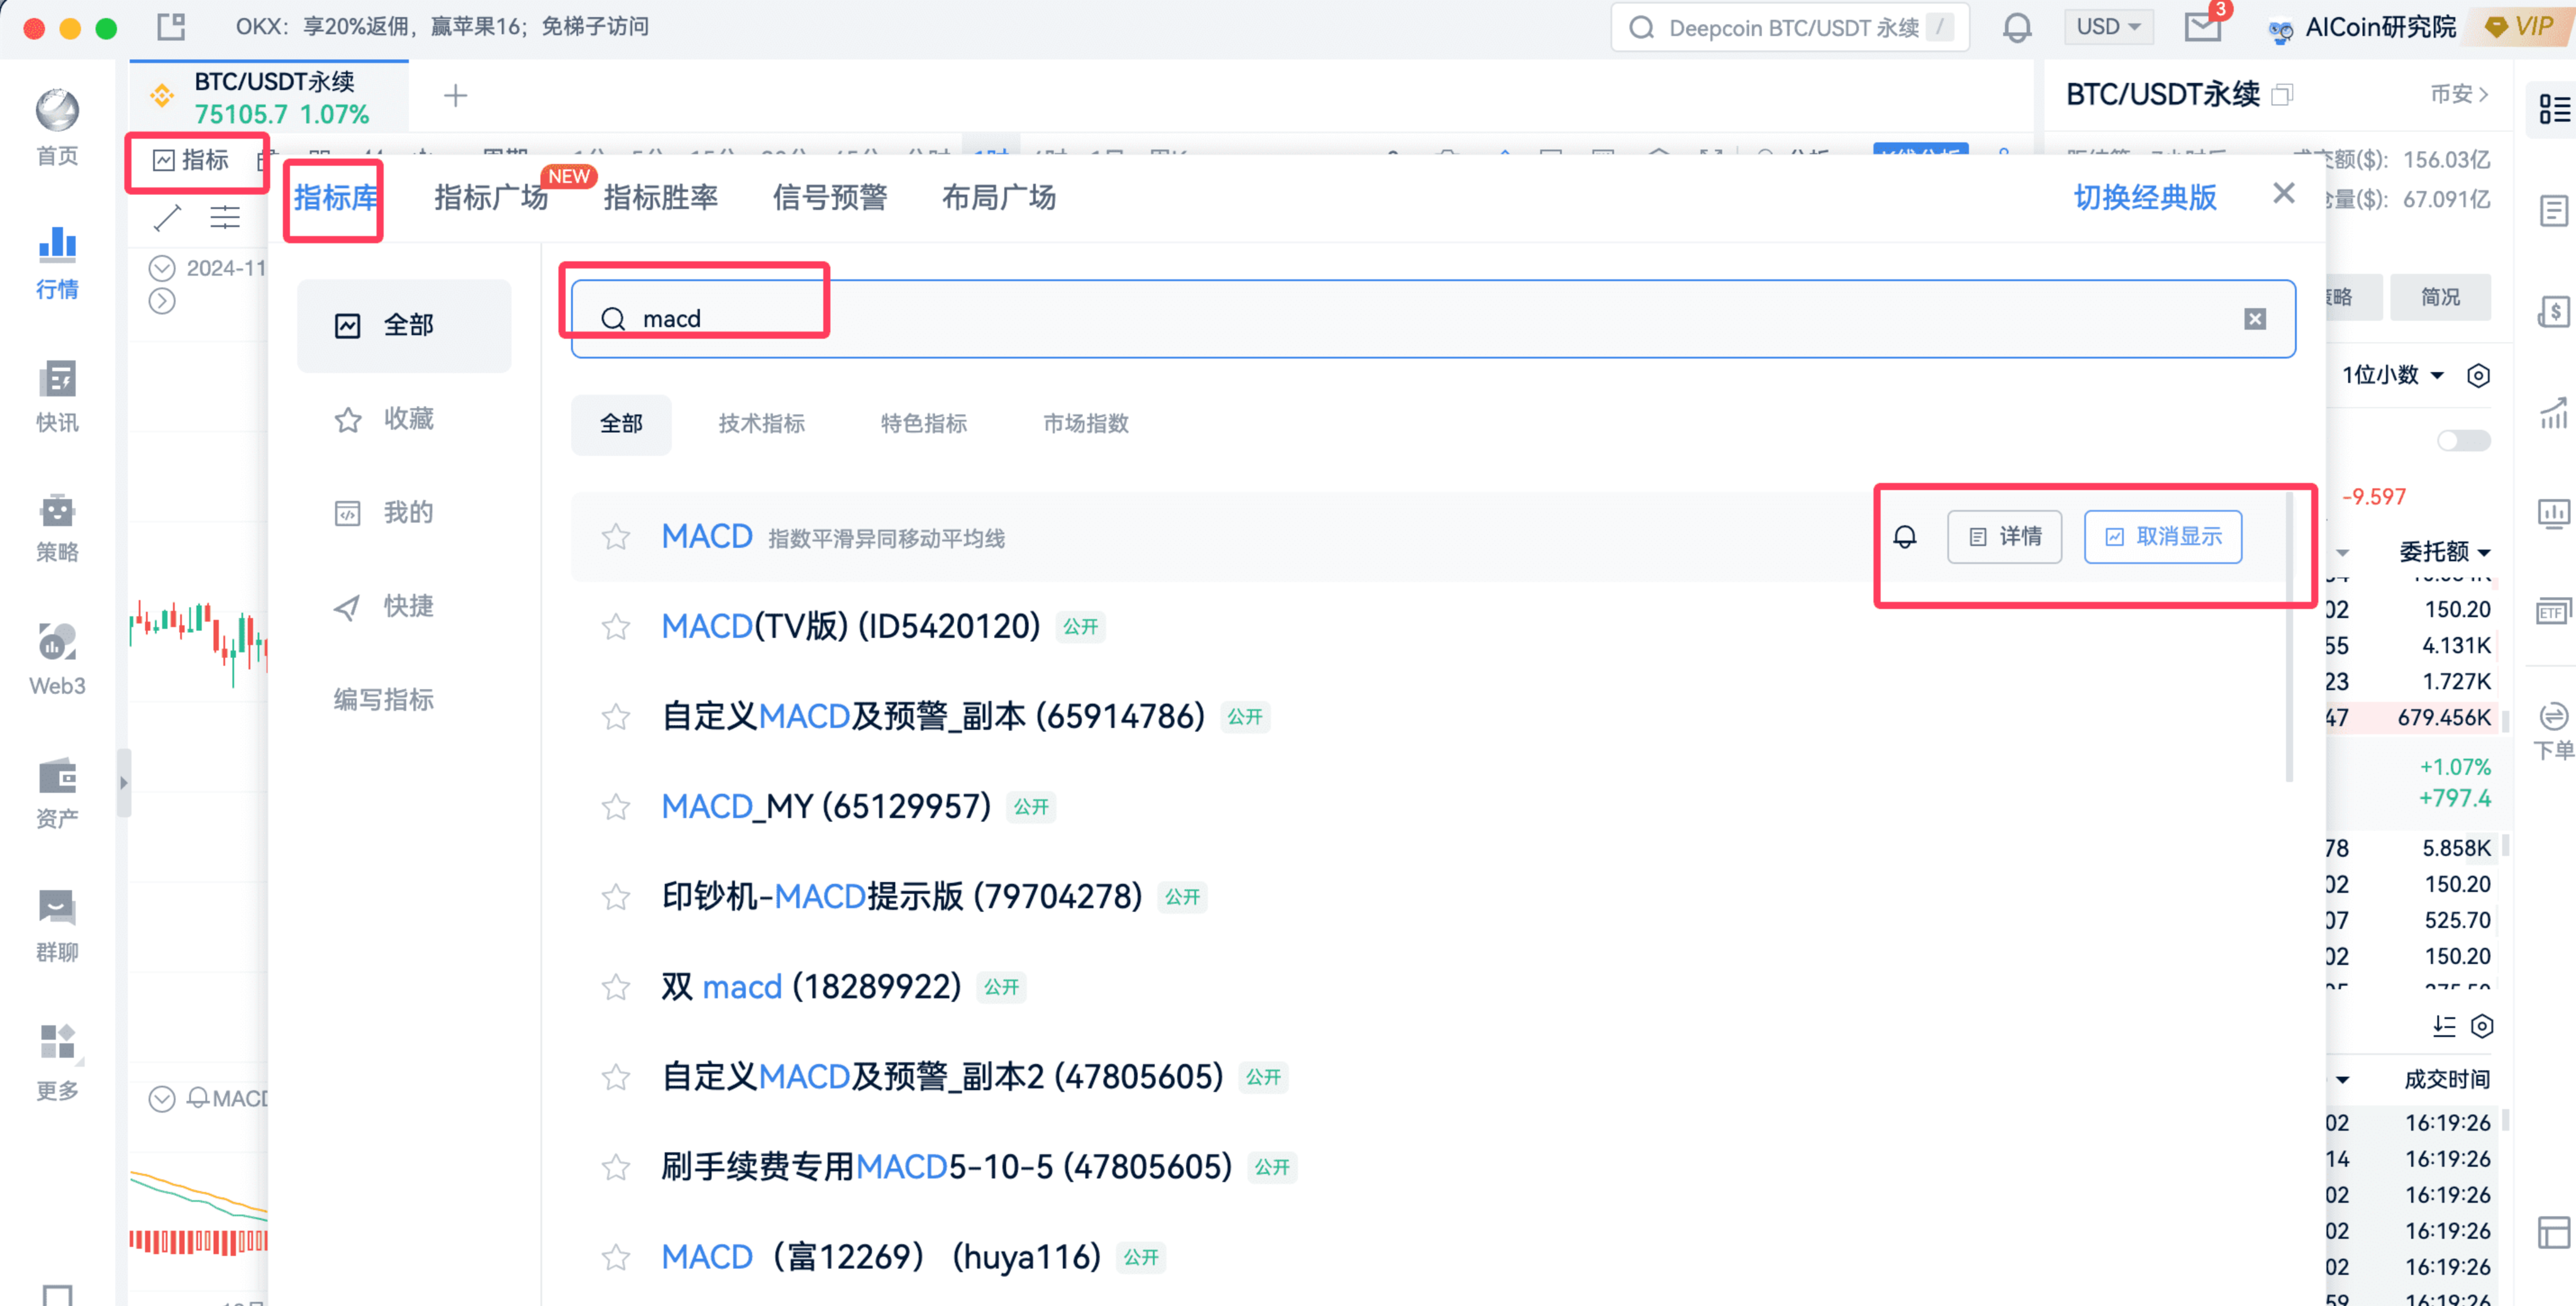
Effect after adding
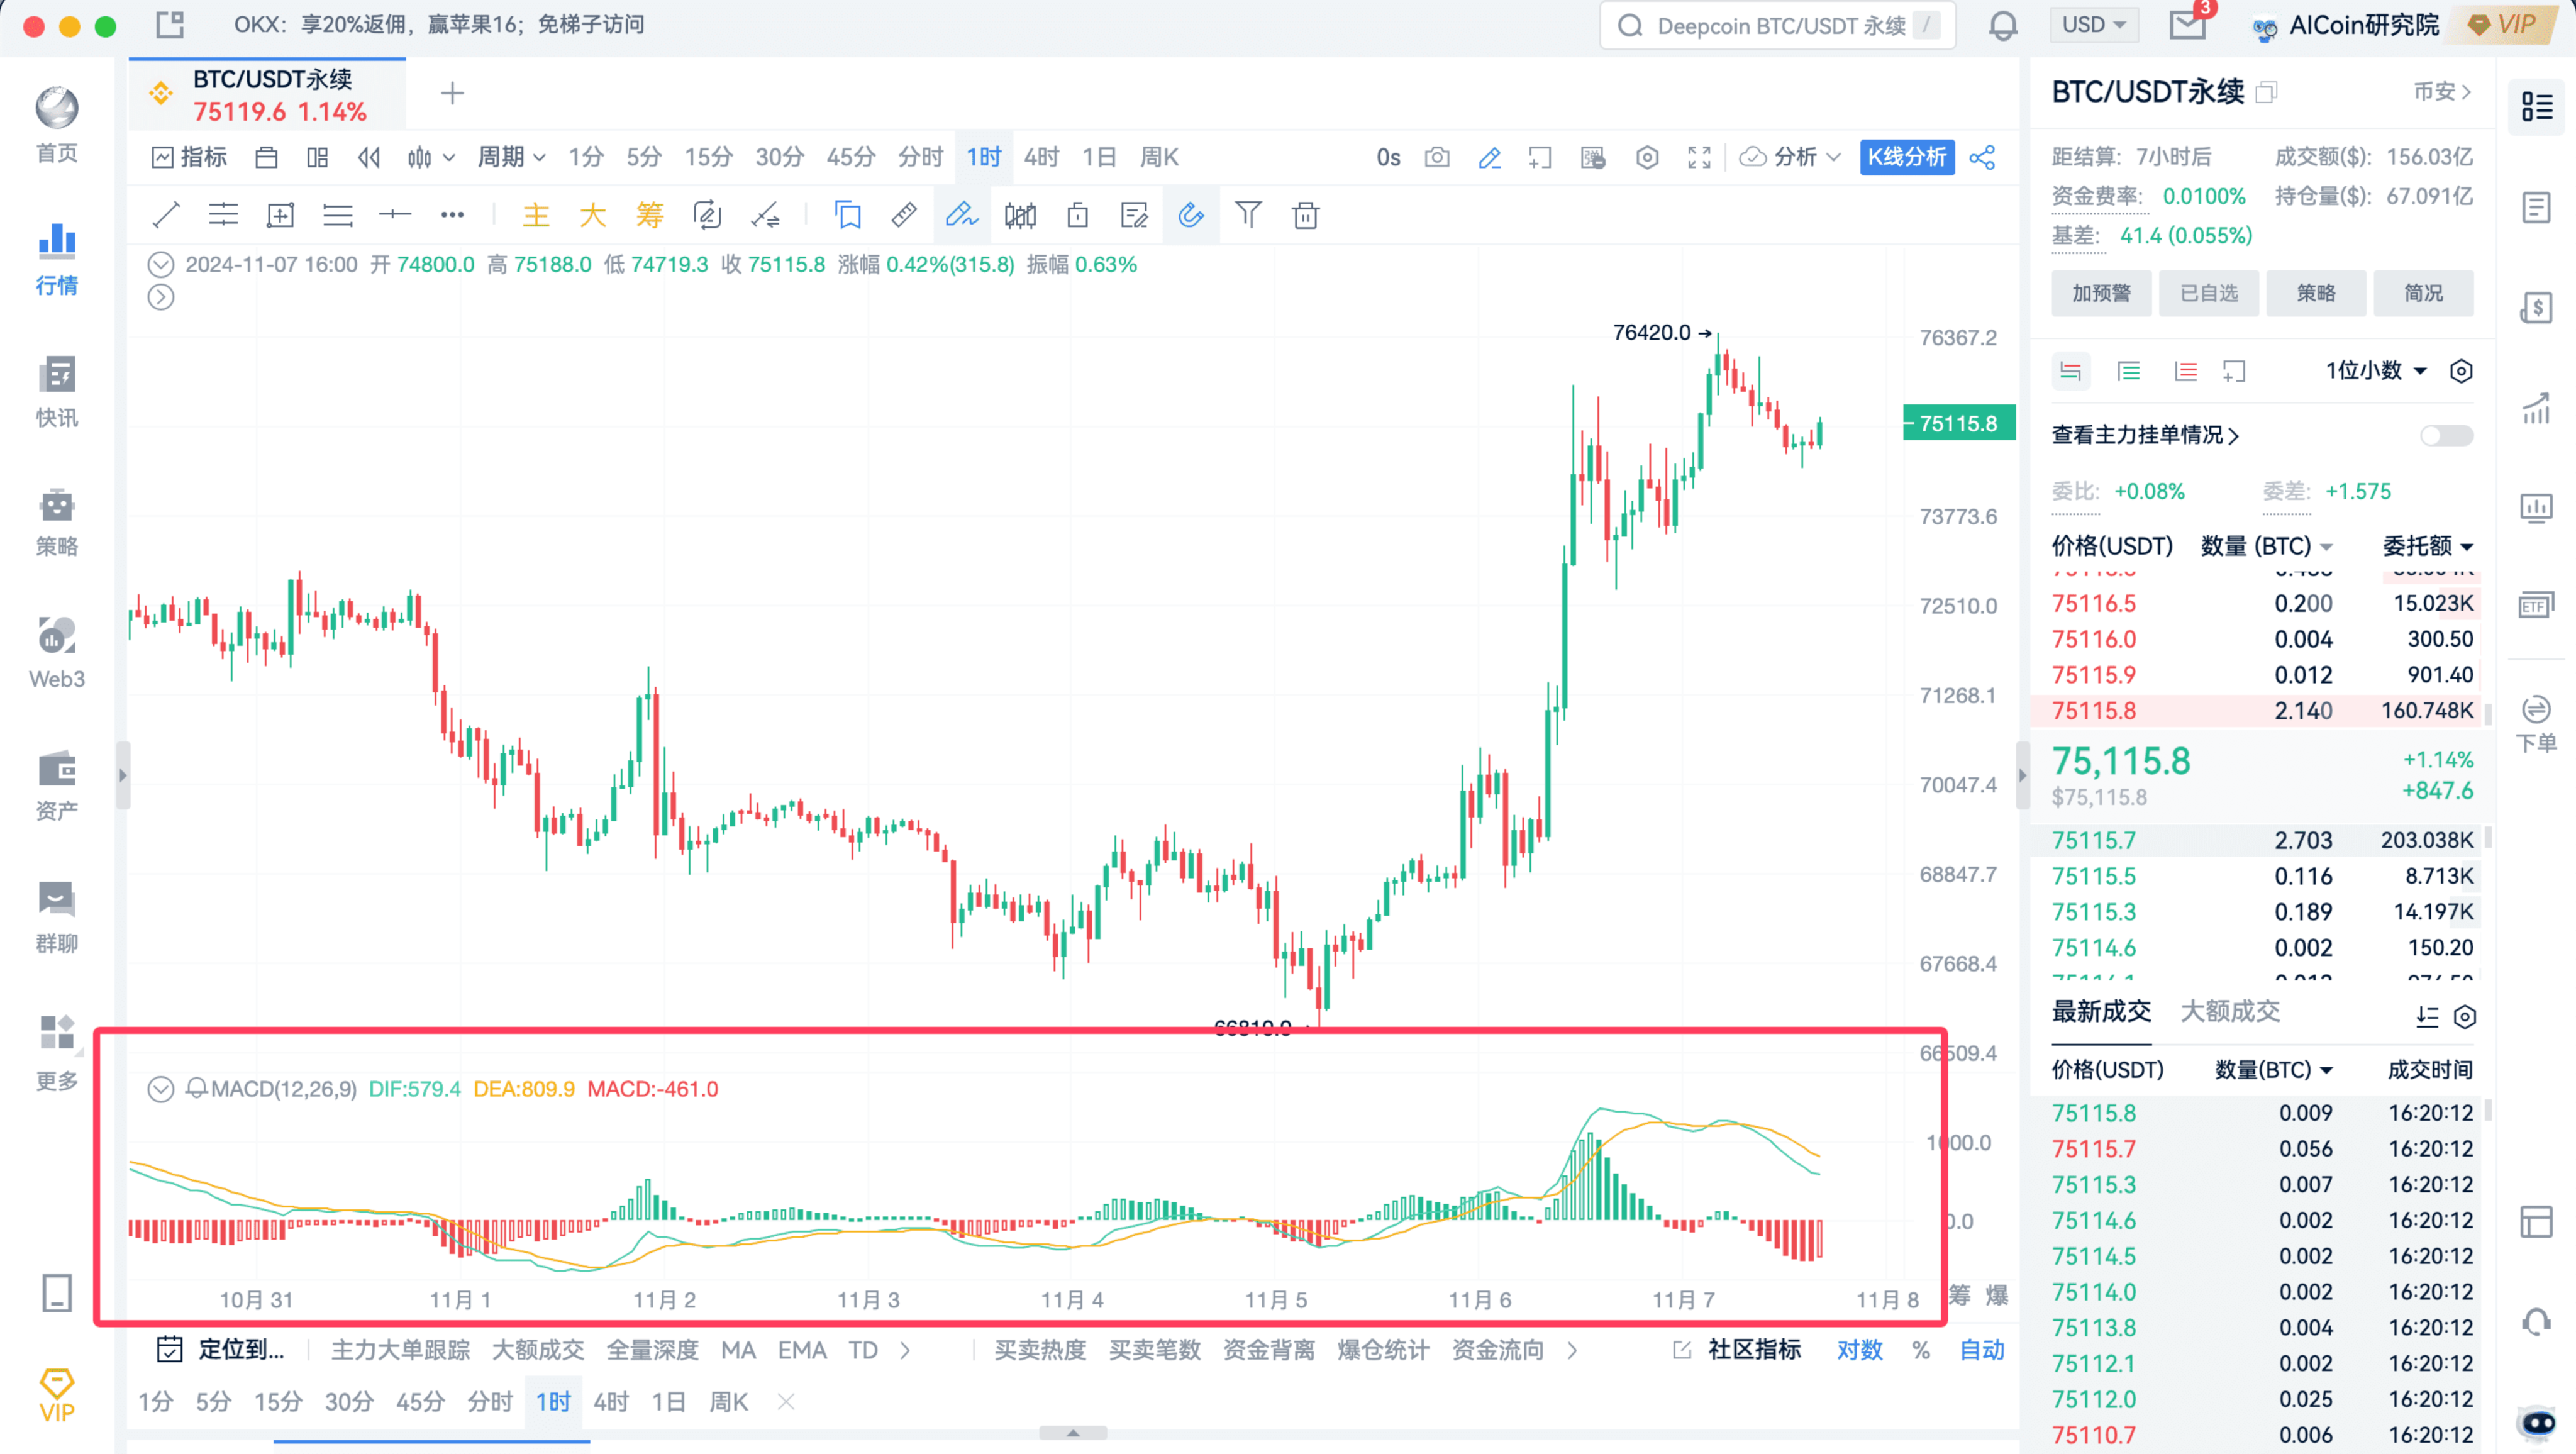
We only need to focus on one line: DIF
If it is a major cryptocurrency, like BTC and ETH, it is recommended to use a 1-hour period;
If it is a smaller cryptocurrency, like Dogecoin, use a 15-minute period.
The operation is as follows:
● DIF line crosses above the zero line, trend is bullish
● DIF line crosses below the zero line, trend is bearish
Taking the latest two waves as an example, it is a guaranteed profit.
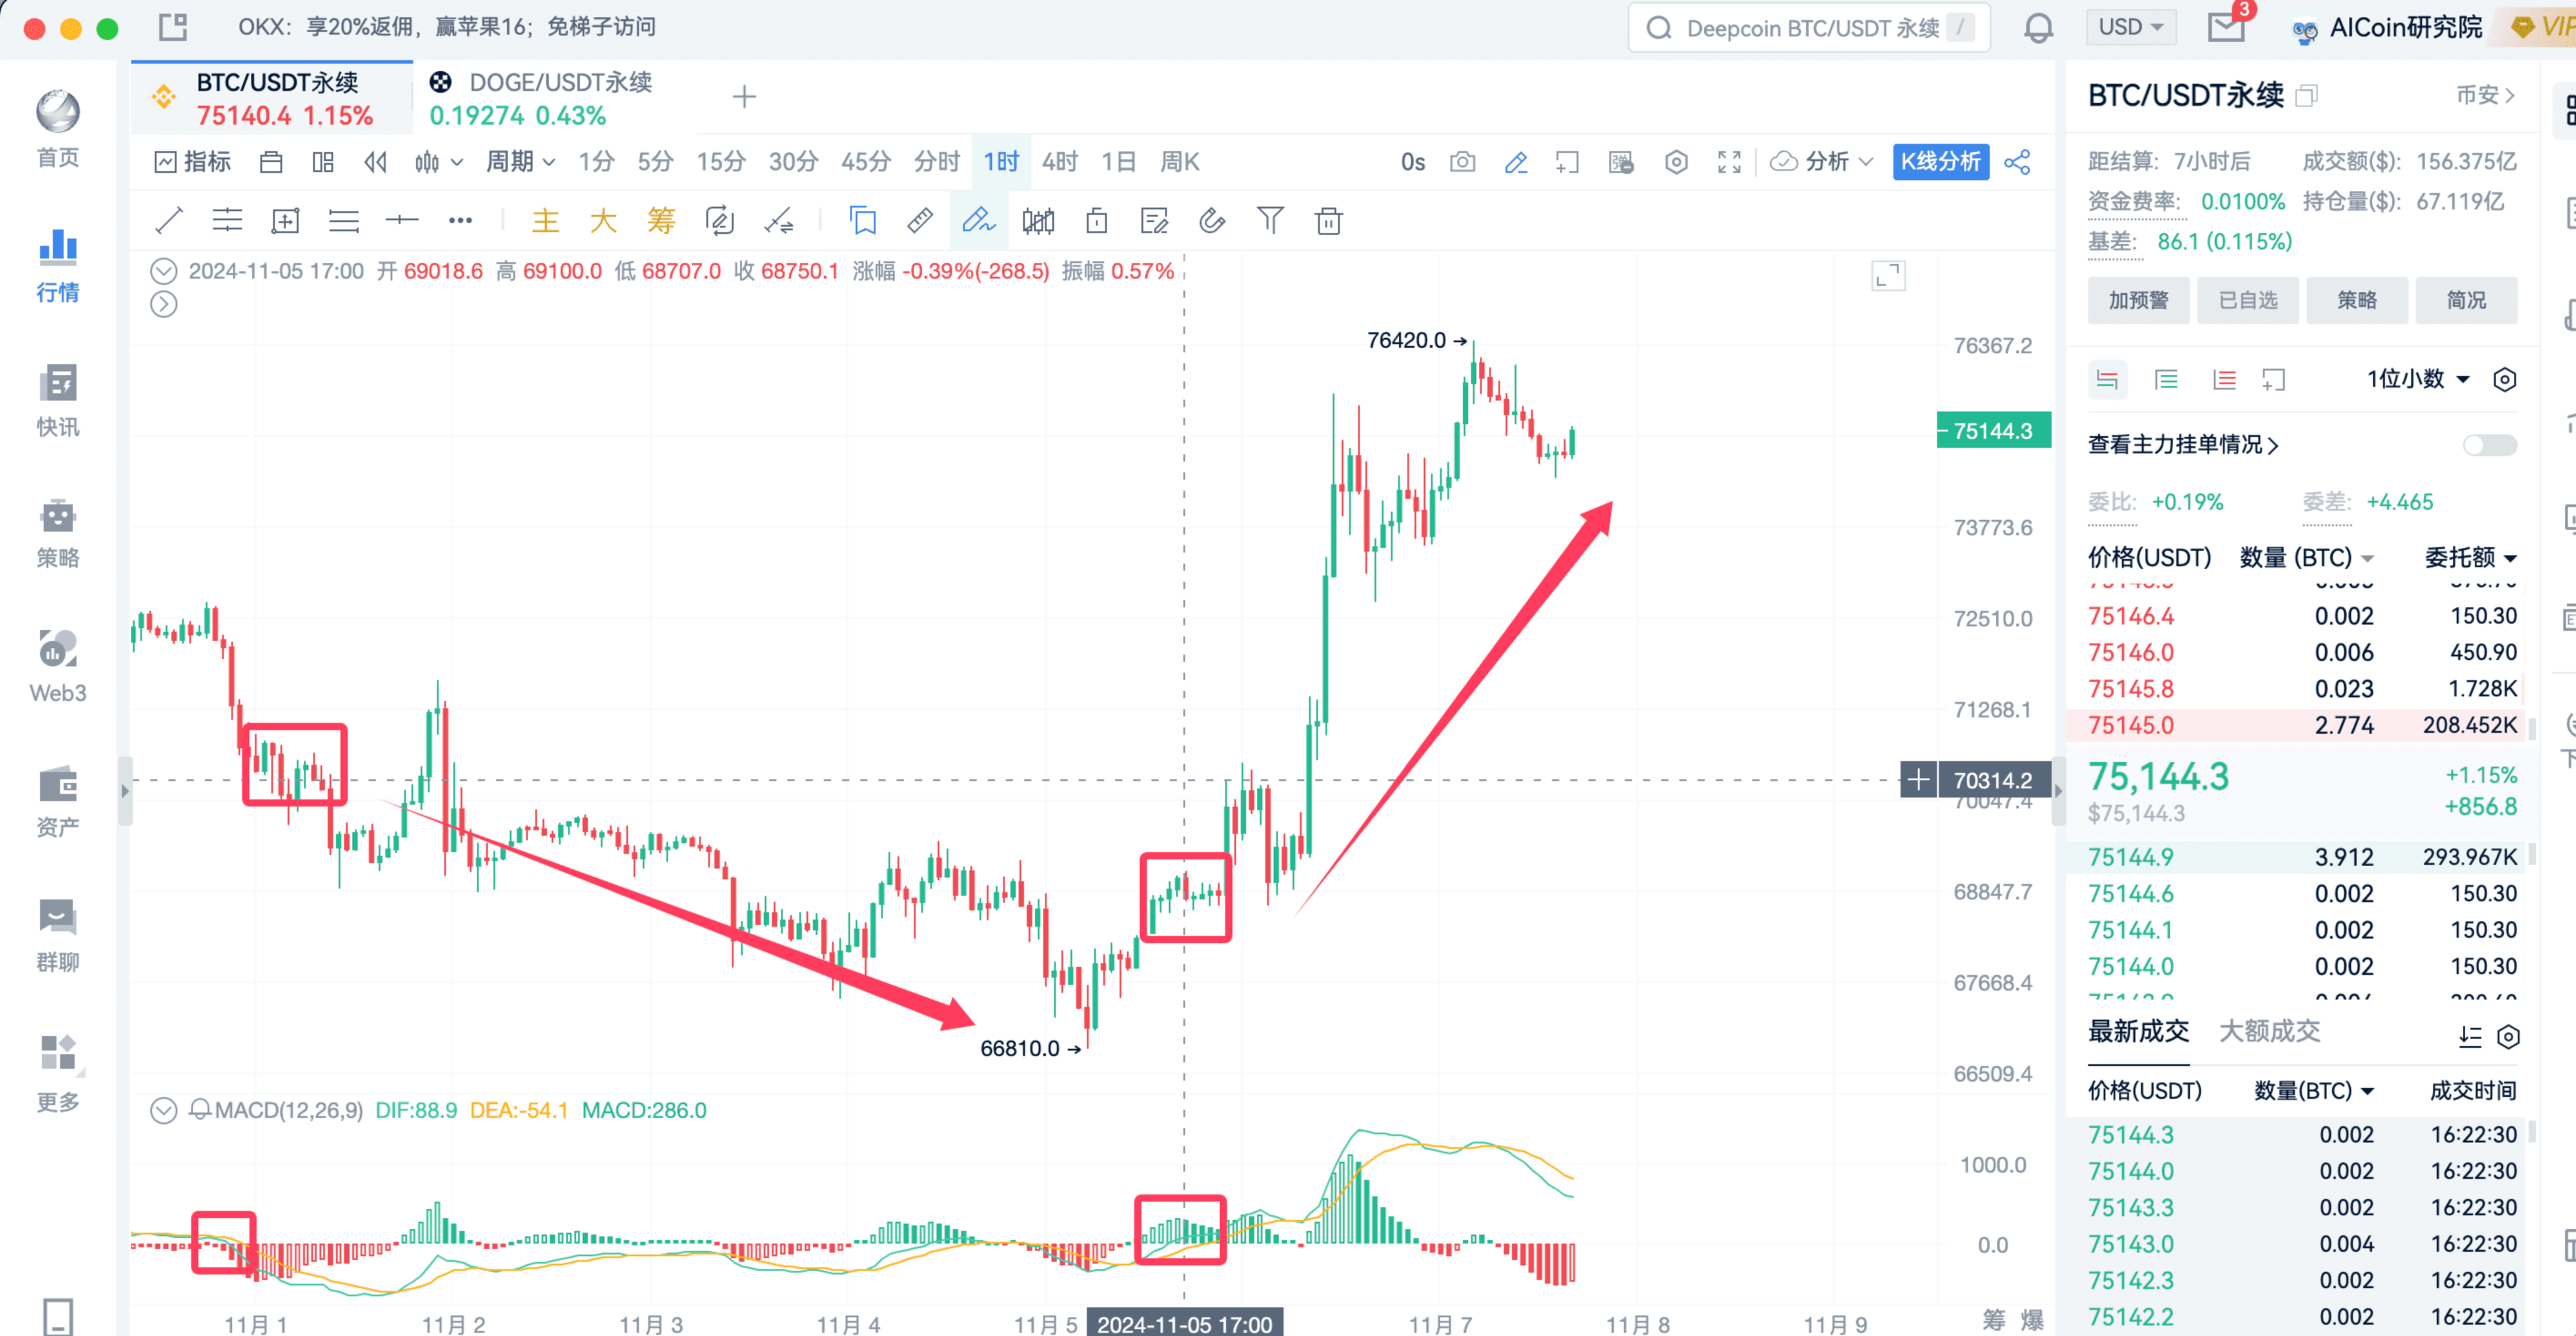
After watching the live stream, you can try it yourself; the success rate is still very high.
The usage is simple:
Crossing above the zero line, trend is bullish
Crossing below the zero line, trend is bearish
Its success rate in identifying trends is very high.
: So why is the DIF line so useful?
: Mainly because of the composition of the DIF line.
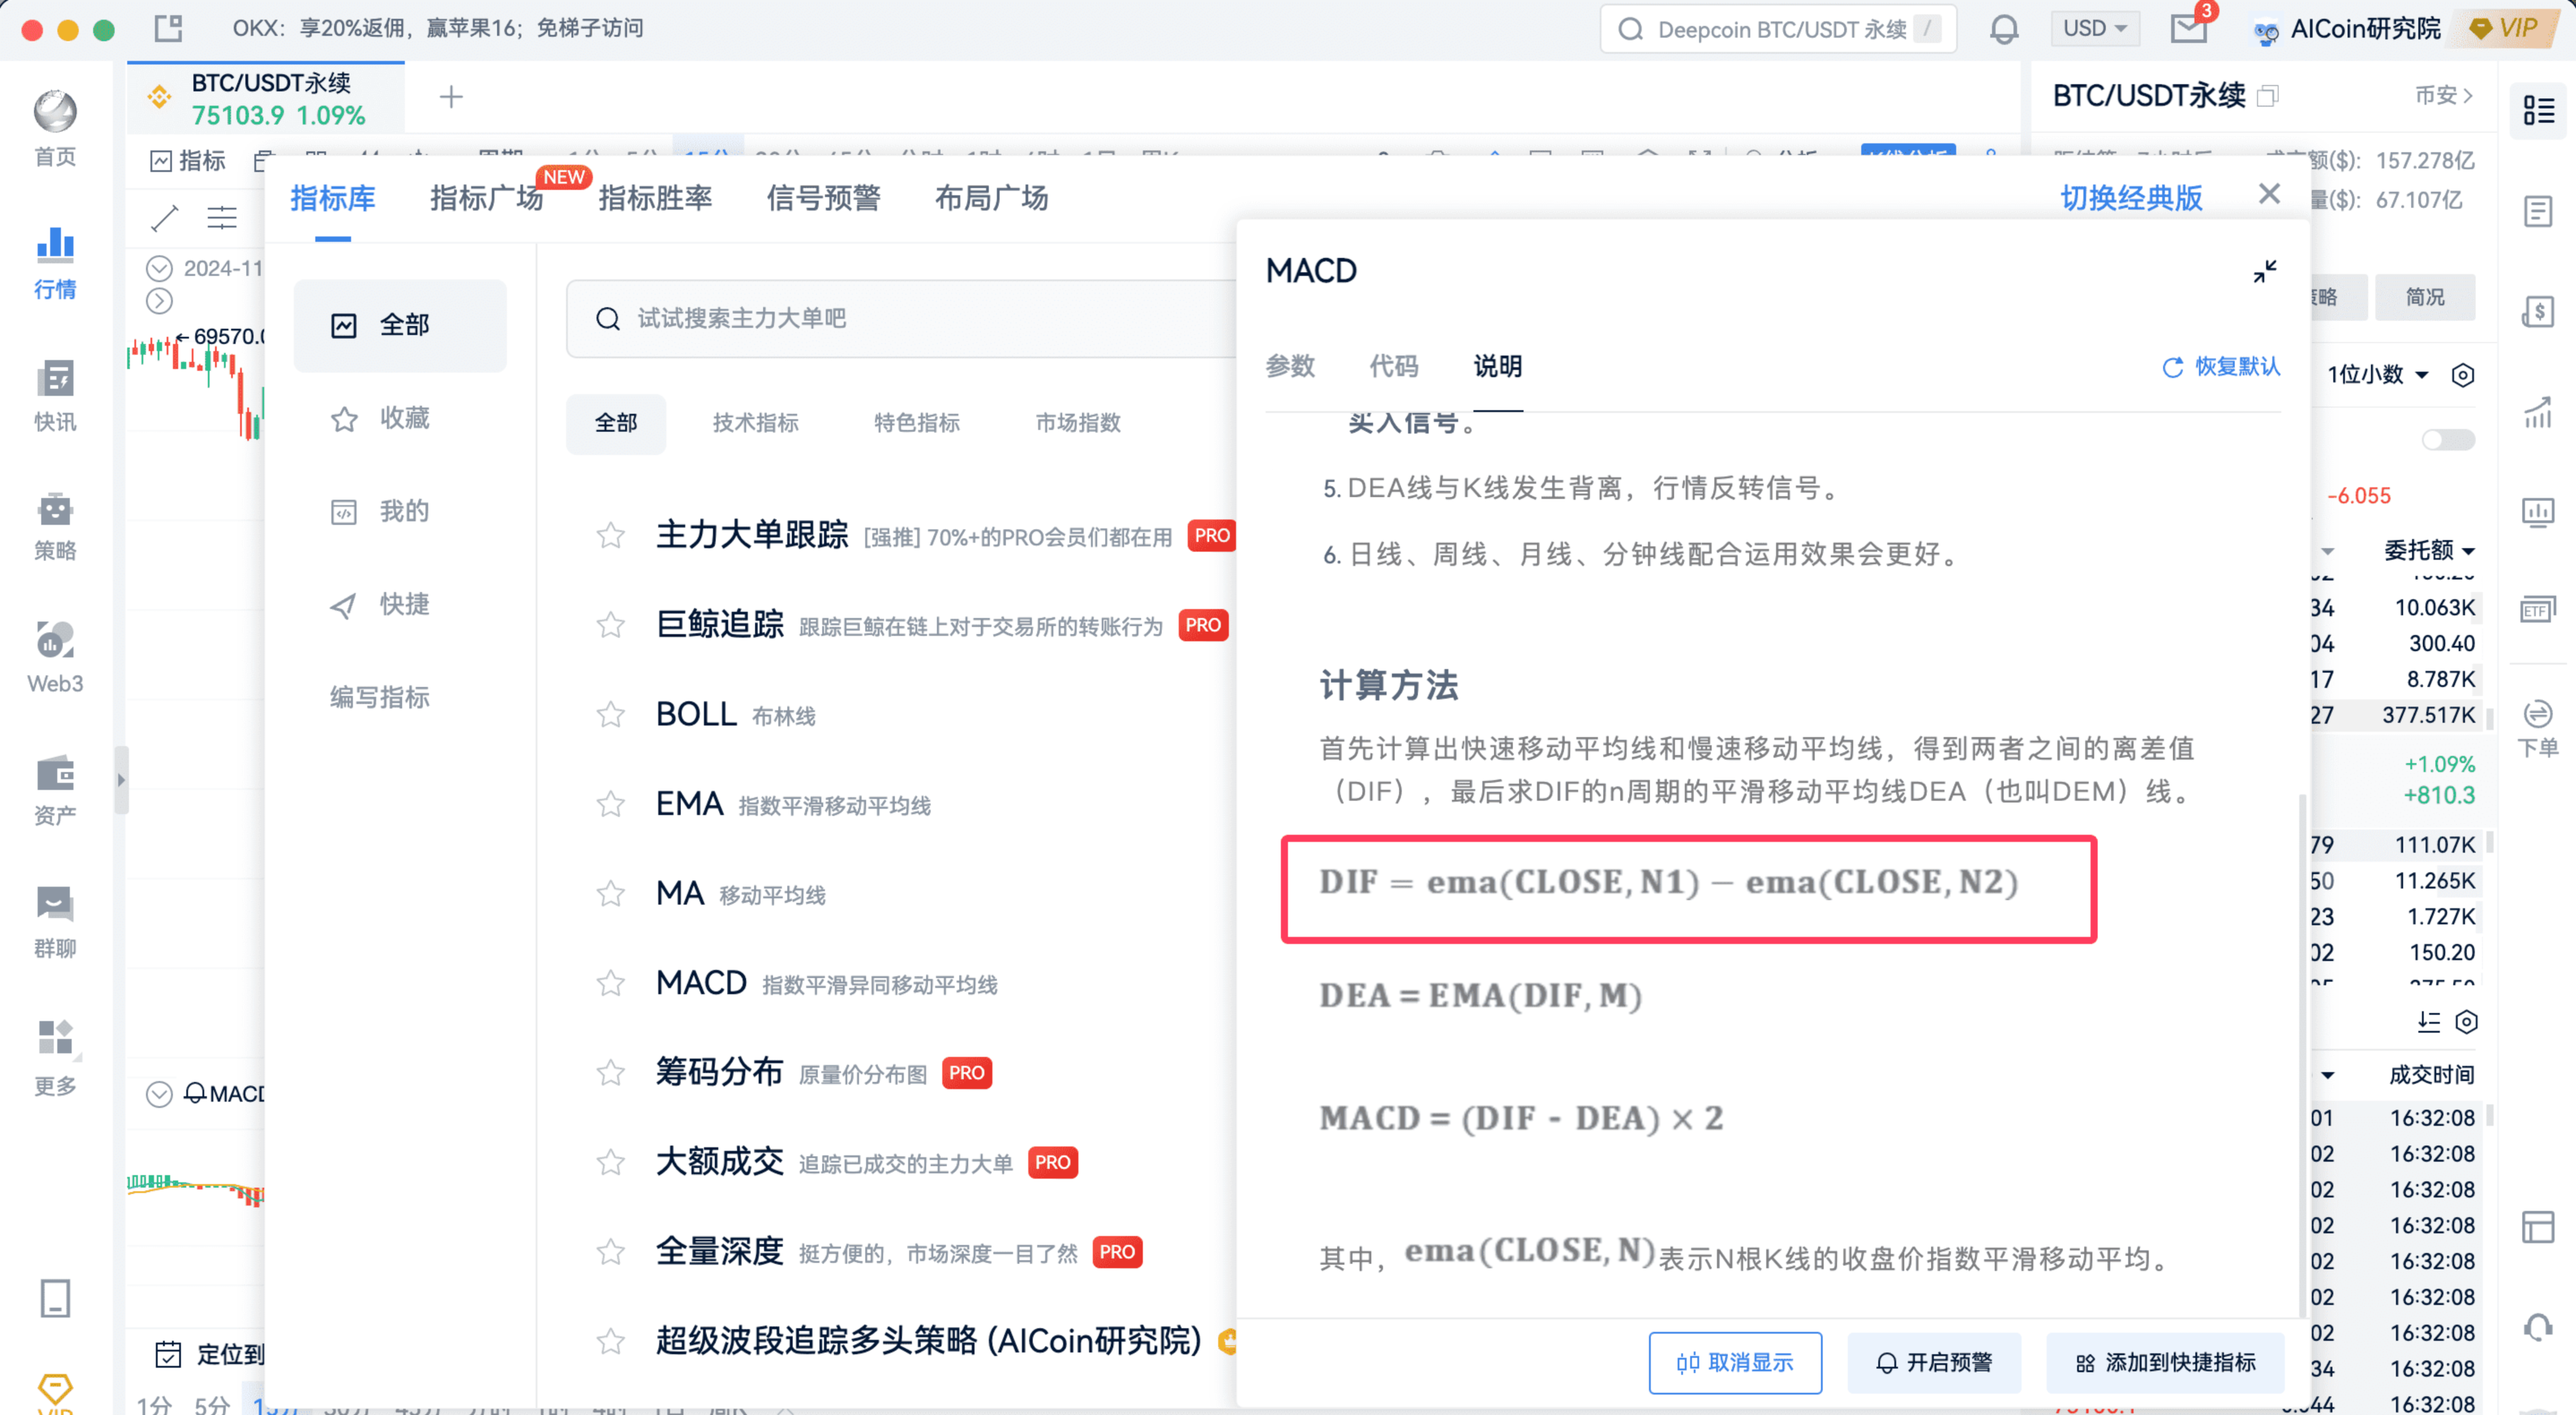
DIF is composed of two EMA lines, so it has the characteristics of EMA;
At the same time, because it is a difference, it also removes some lag, which is actually better.
: Some may say EMA is slow, but actually, it is not slow at all. Why?
: It's simple, EMA is a weighted moving average, which is very sensitive to recent price levels.
So, it was developed as an indicator that keenly captures changes in recent price levels.
Let's take a look at ETH to see if it has this good effect and verify it.
This ability to grasp trends is very strong.
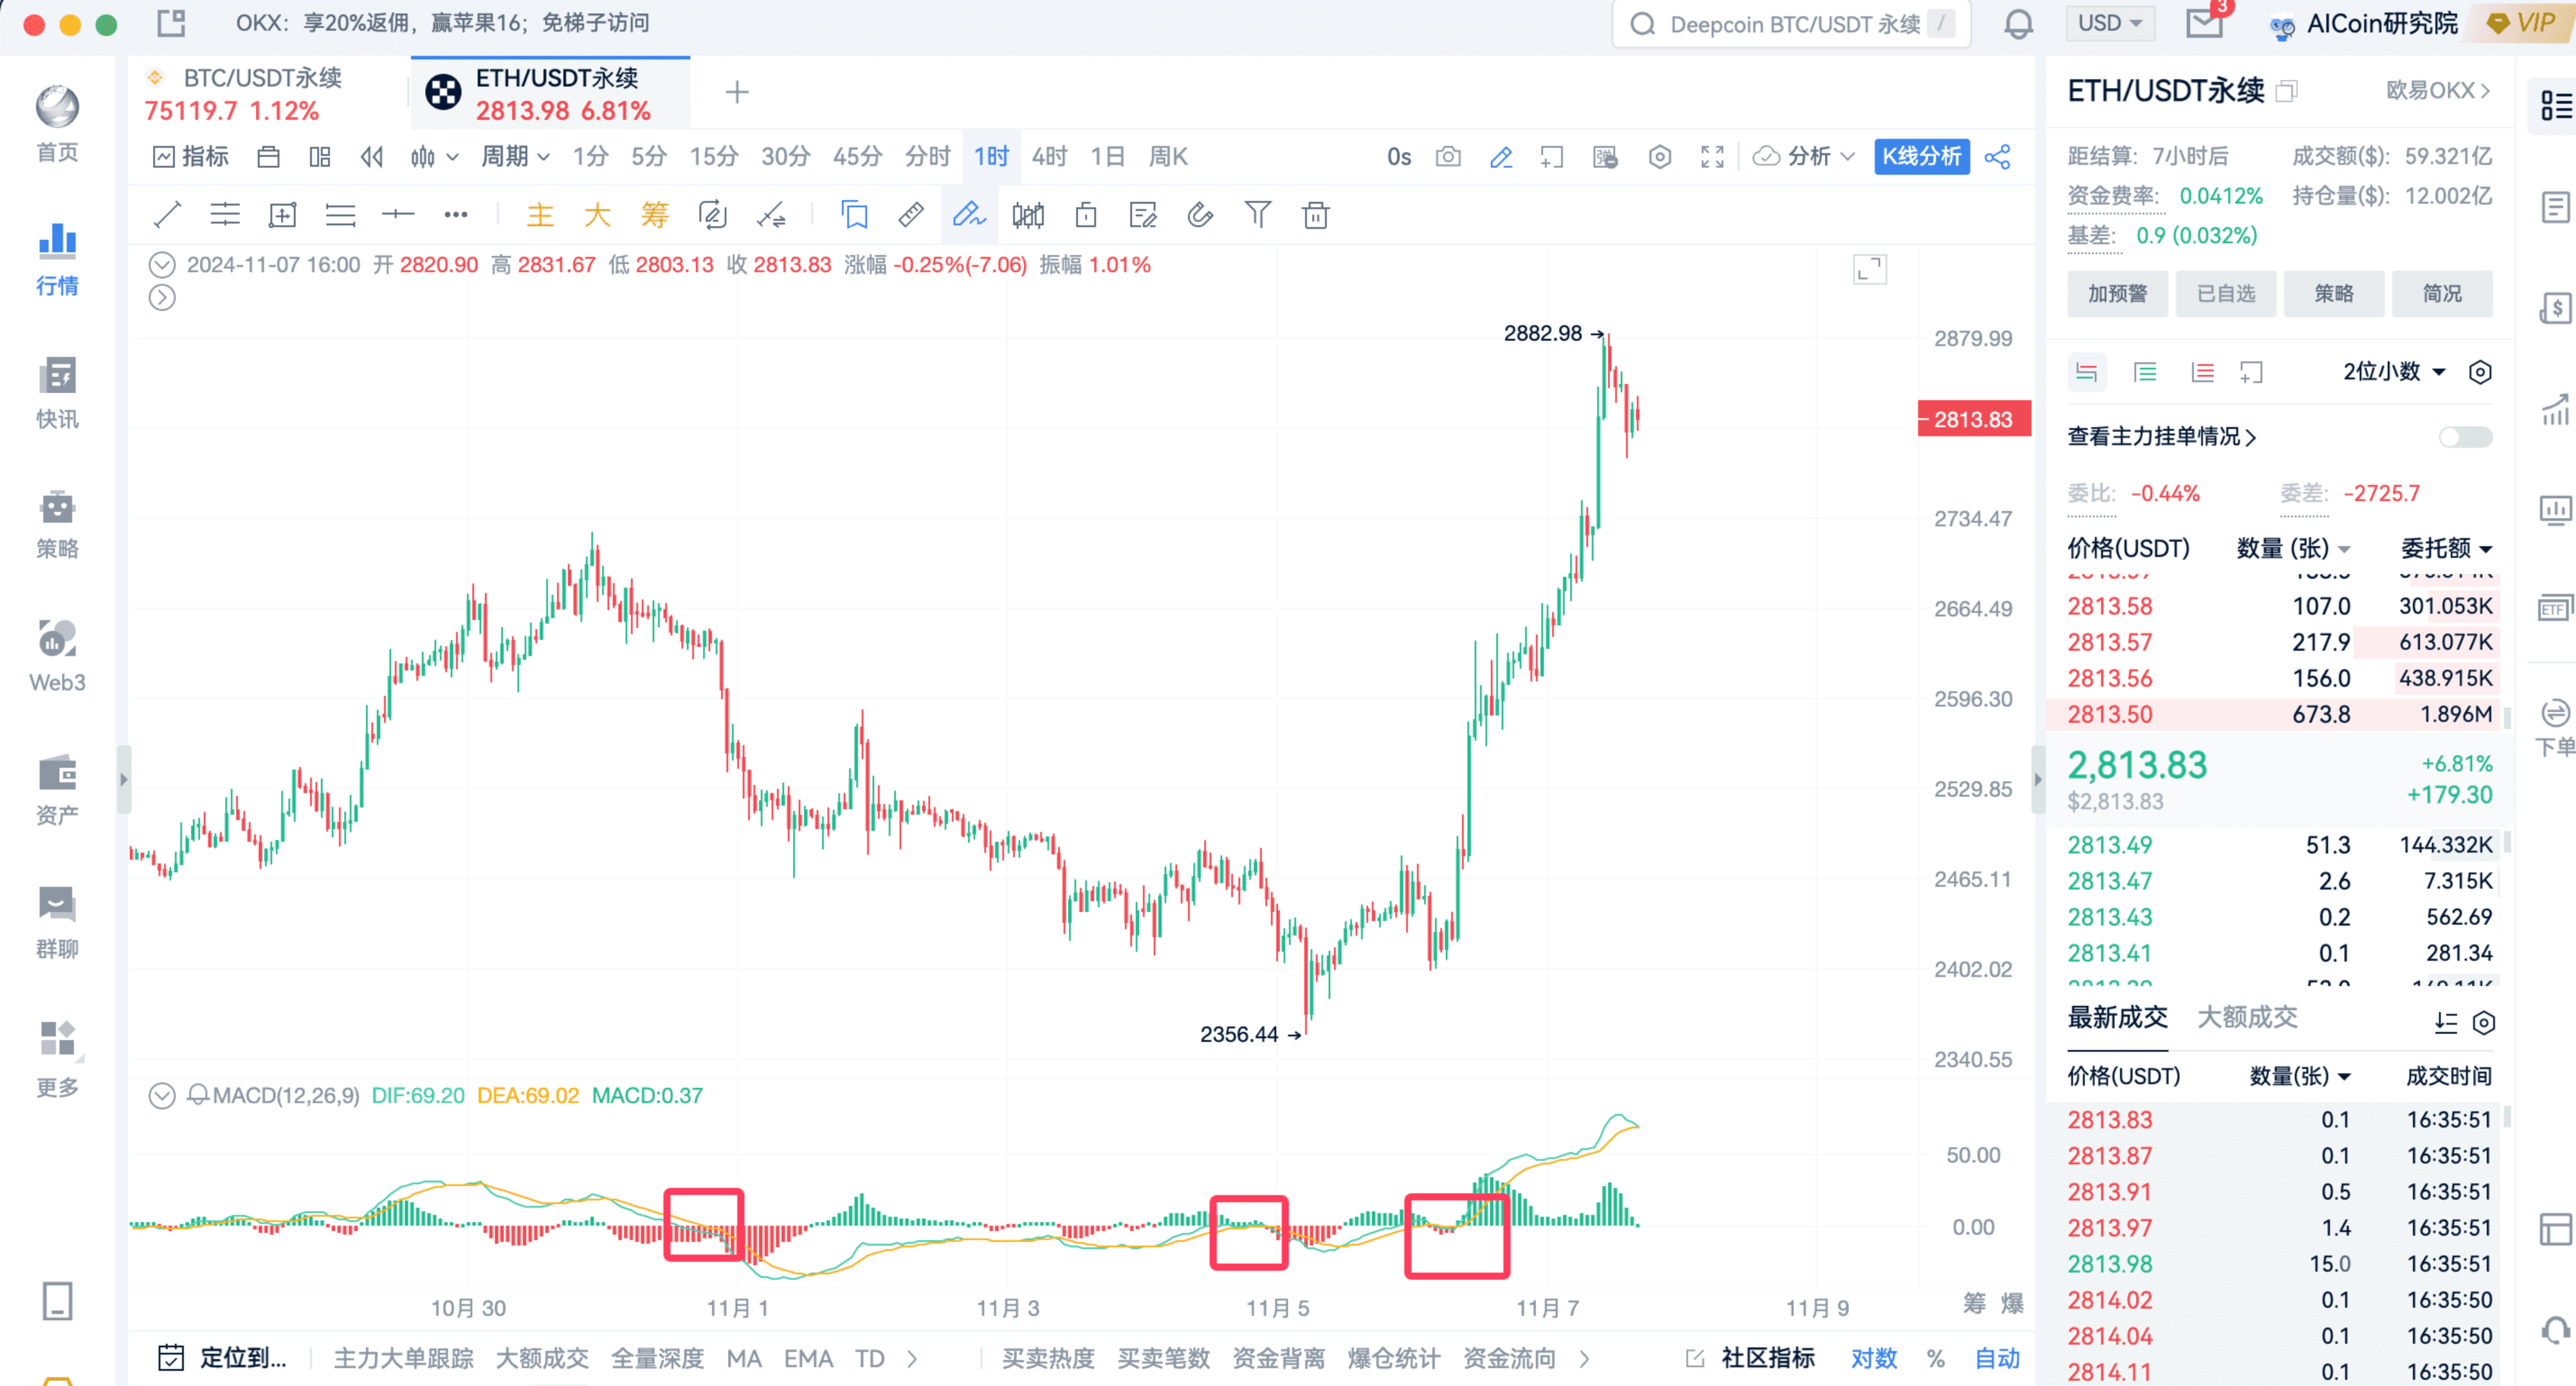
Here, I would like to emphasize that because the period is set relatively large, crossing above and below can allow everyone to capture a large wave of trend profits. However, if you encounter rapid crossings, the probability of being stopped out or liquidated is also relatively high.
So everyone needs to be cautious!
The Research Institute reminds that when encountering this indicator with crossings, it is suitable to take a small position to explore, combined with other indicators for investment.
Or use this indicator to verify trends.
This is the first charm of the king of indicators; with just one line, you can have what you want!
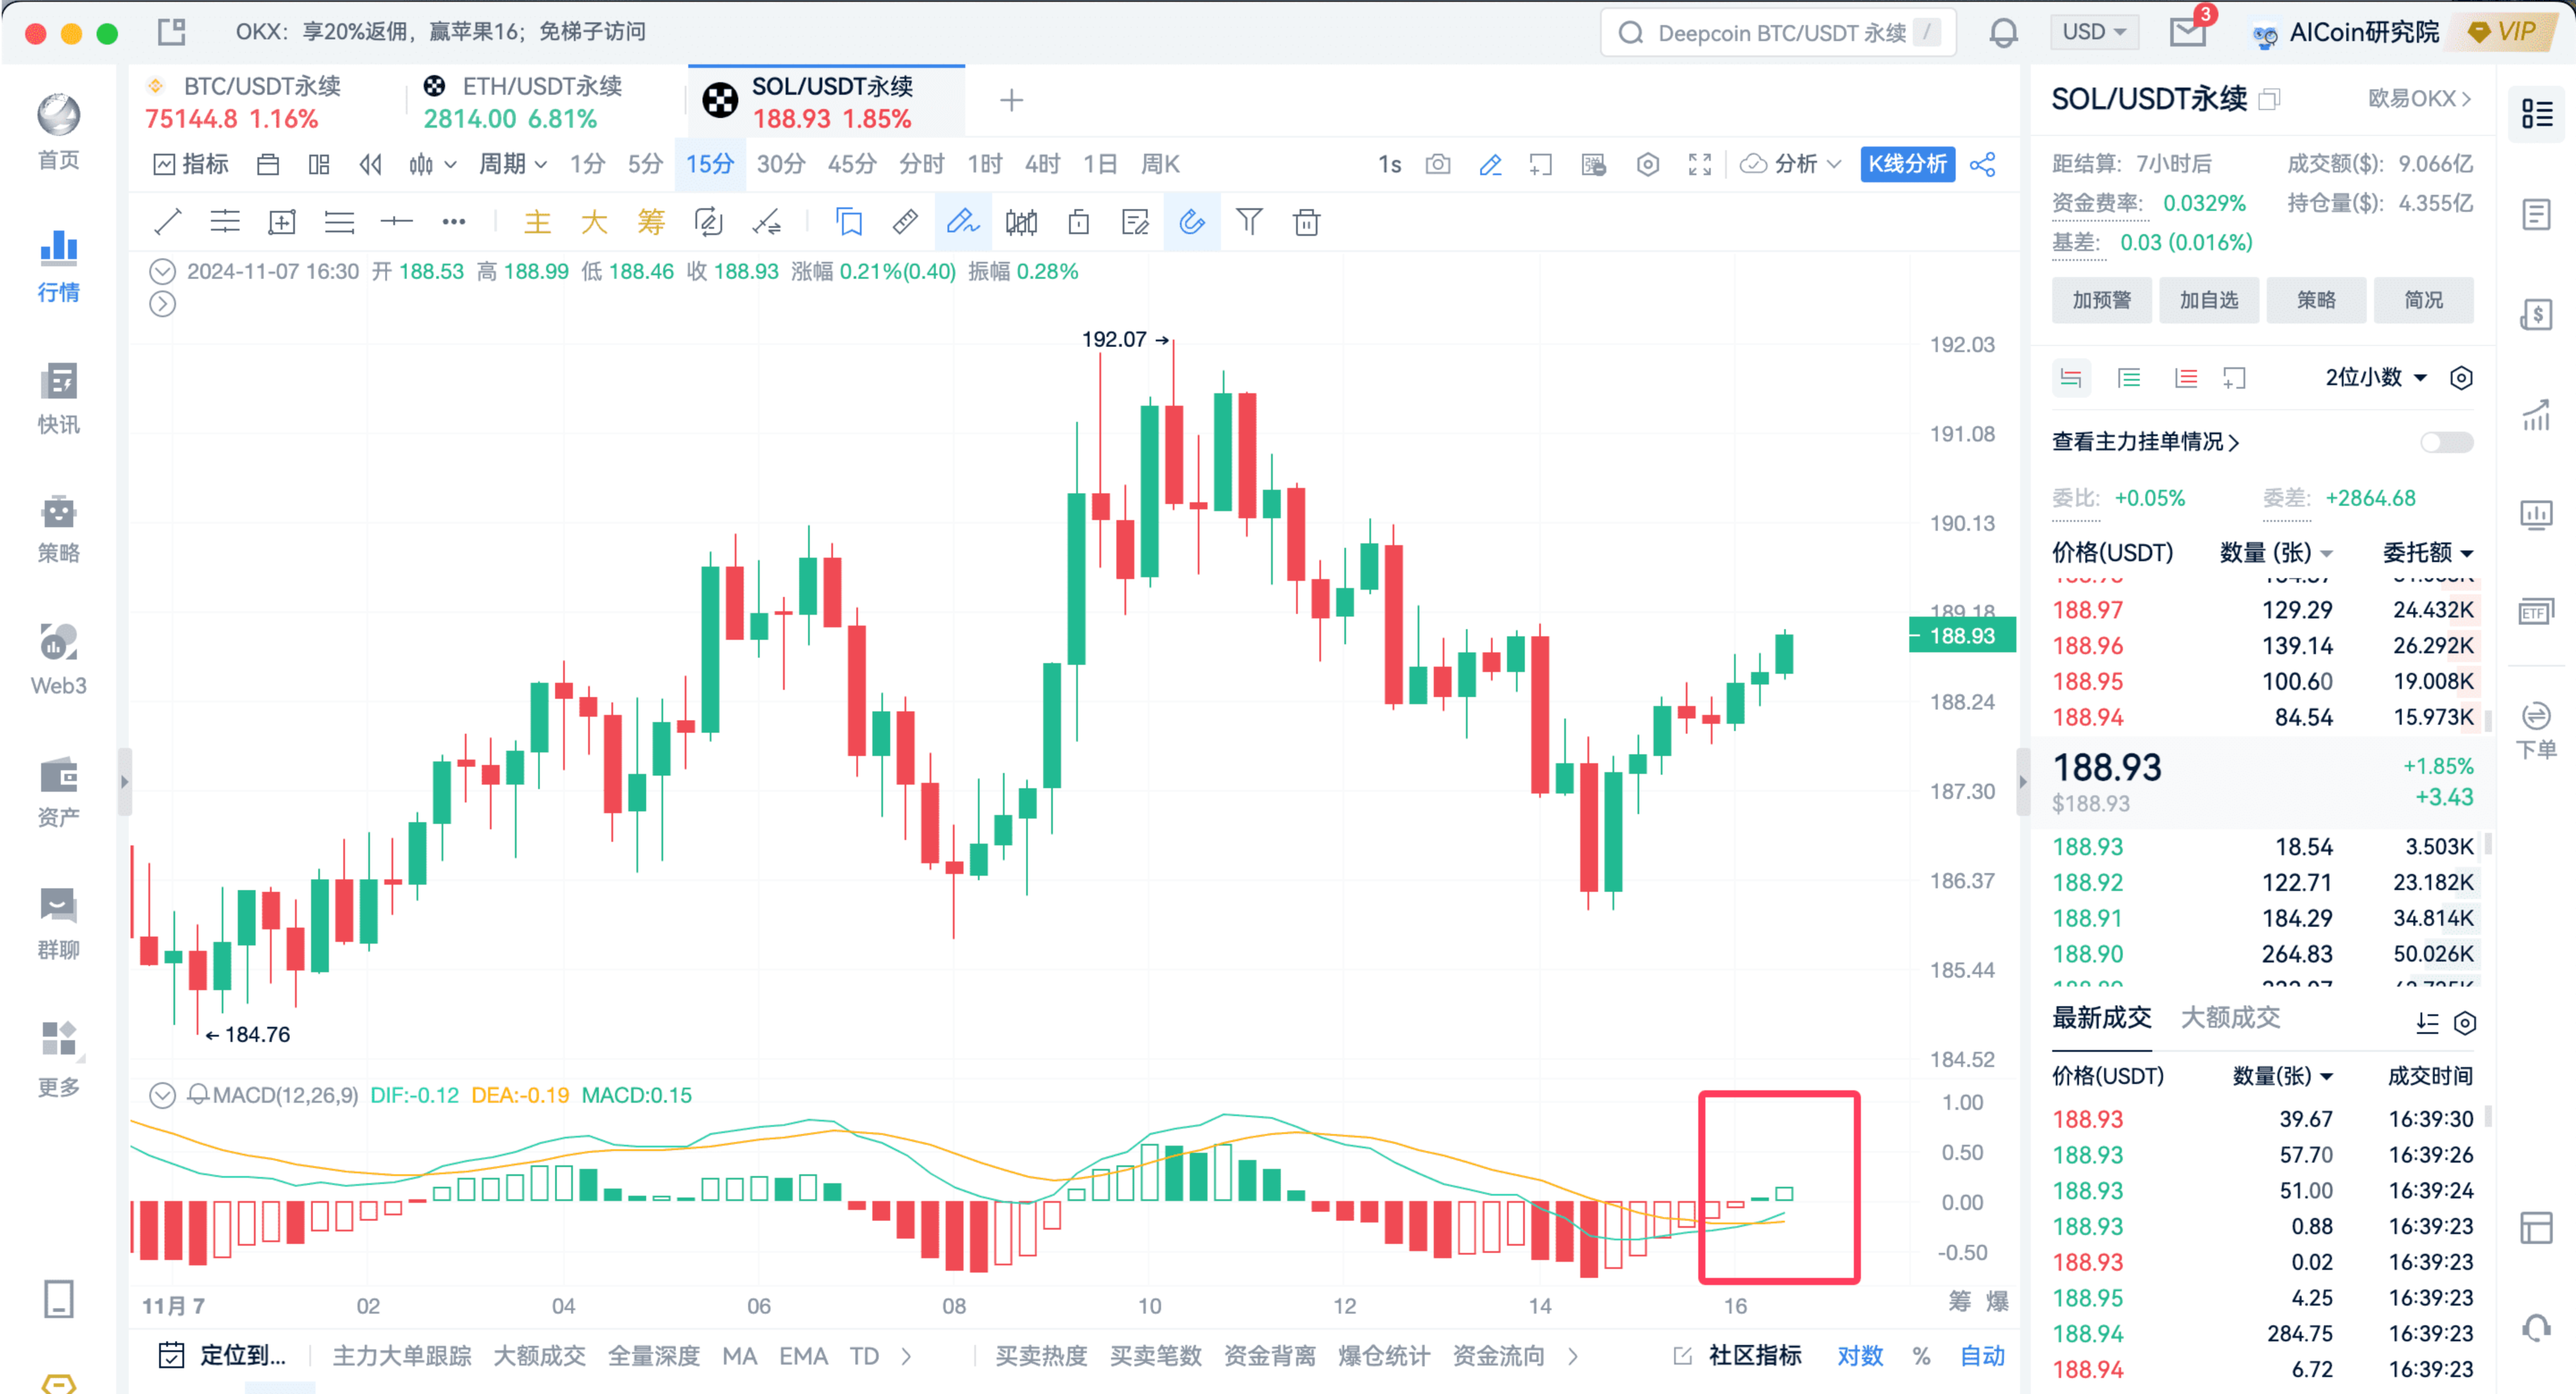
If SOL crosses above in 15 minutes, it may also experience a wave of upward movement. Let's see if it will break out.
Second MACD Practical Tip: MACD Divergence and Resonance Divergence
We have created a mnemonic for divergence, which is easy to understand:
● Price makes a new high, but MACD does not make a new high, this is a top divergence.
● Price makes a new low, but MACD does not make a new low, this is a bottom divergence.
Conclusion: Top divergence indicates bearish; bottom divergence indicates bullish.
Let's take a look at the recent BTC divergence signals and identify them together.
Among them, MACD divergence can be categorized into many types: bar divergence, peak divergence, line divergence.
This time we will first explain bar divergence.
Everyone, please open BTC with me.
The host has written an indicator to identify divergence signals.
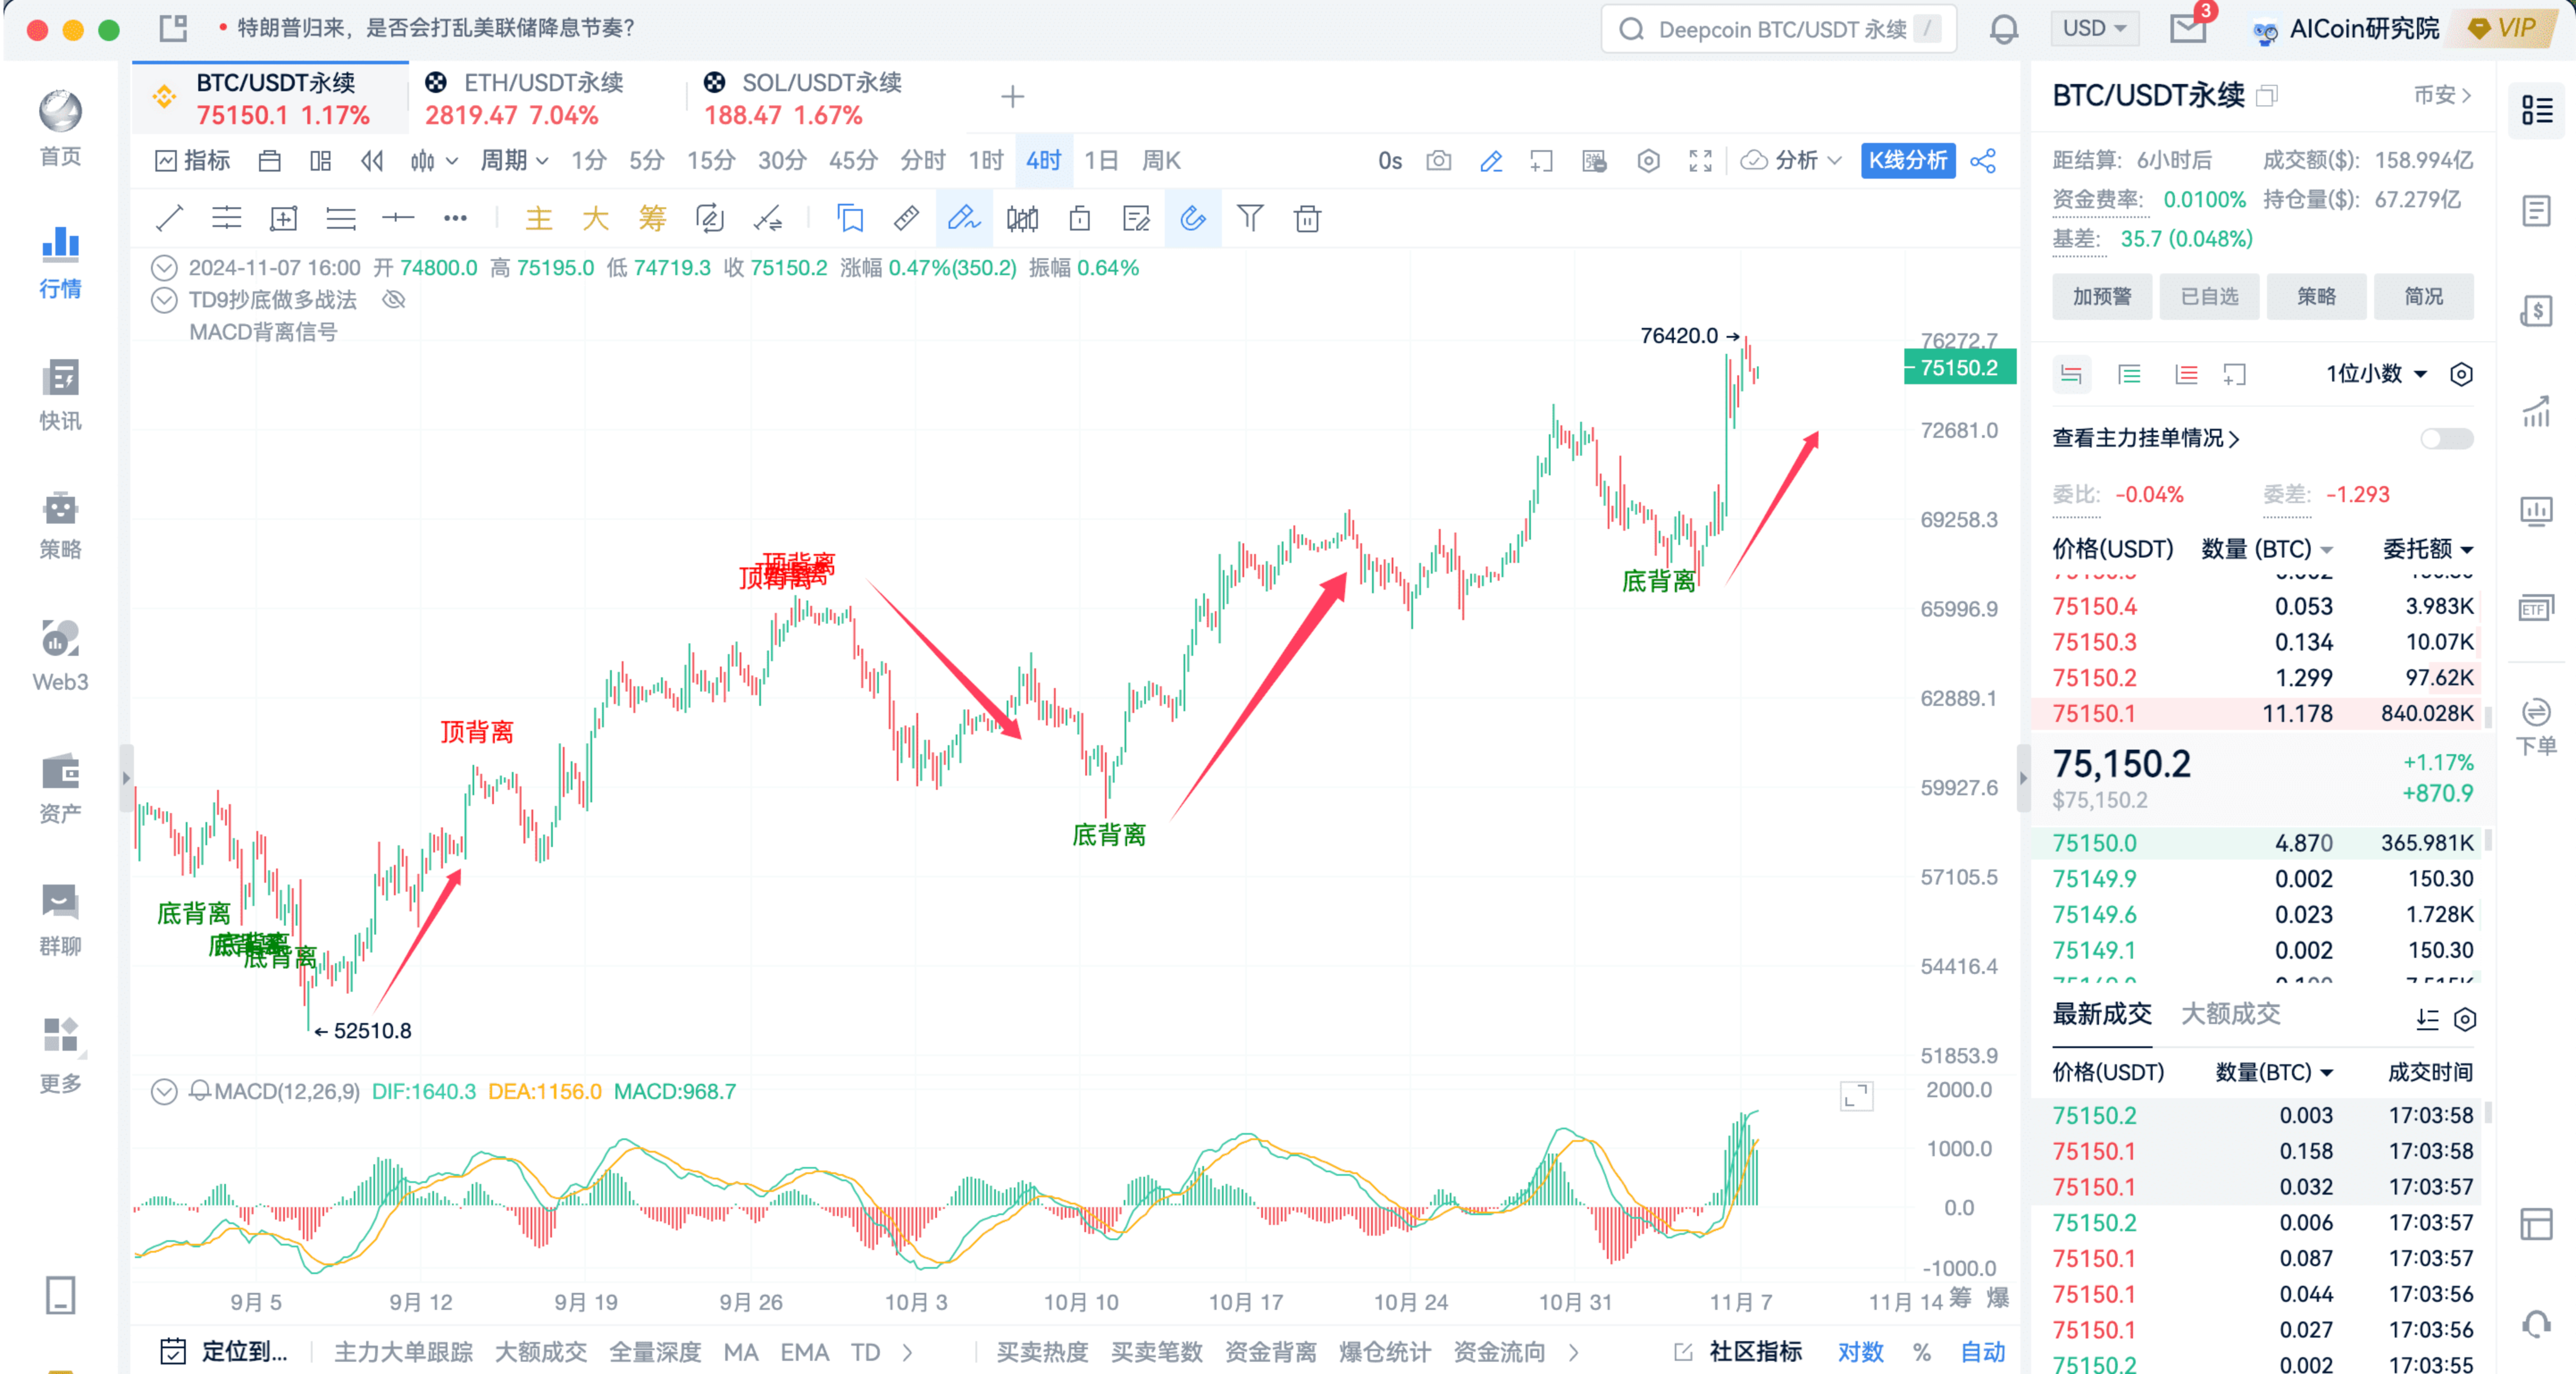
In the 4-hour period, it performs quite well.
Looking back at history, we can see that it is not necessarily 100%, but it can buy at relatively low positions.
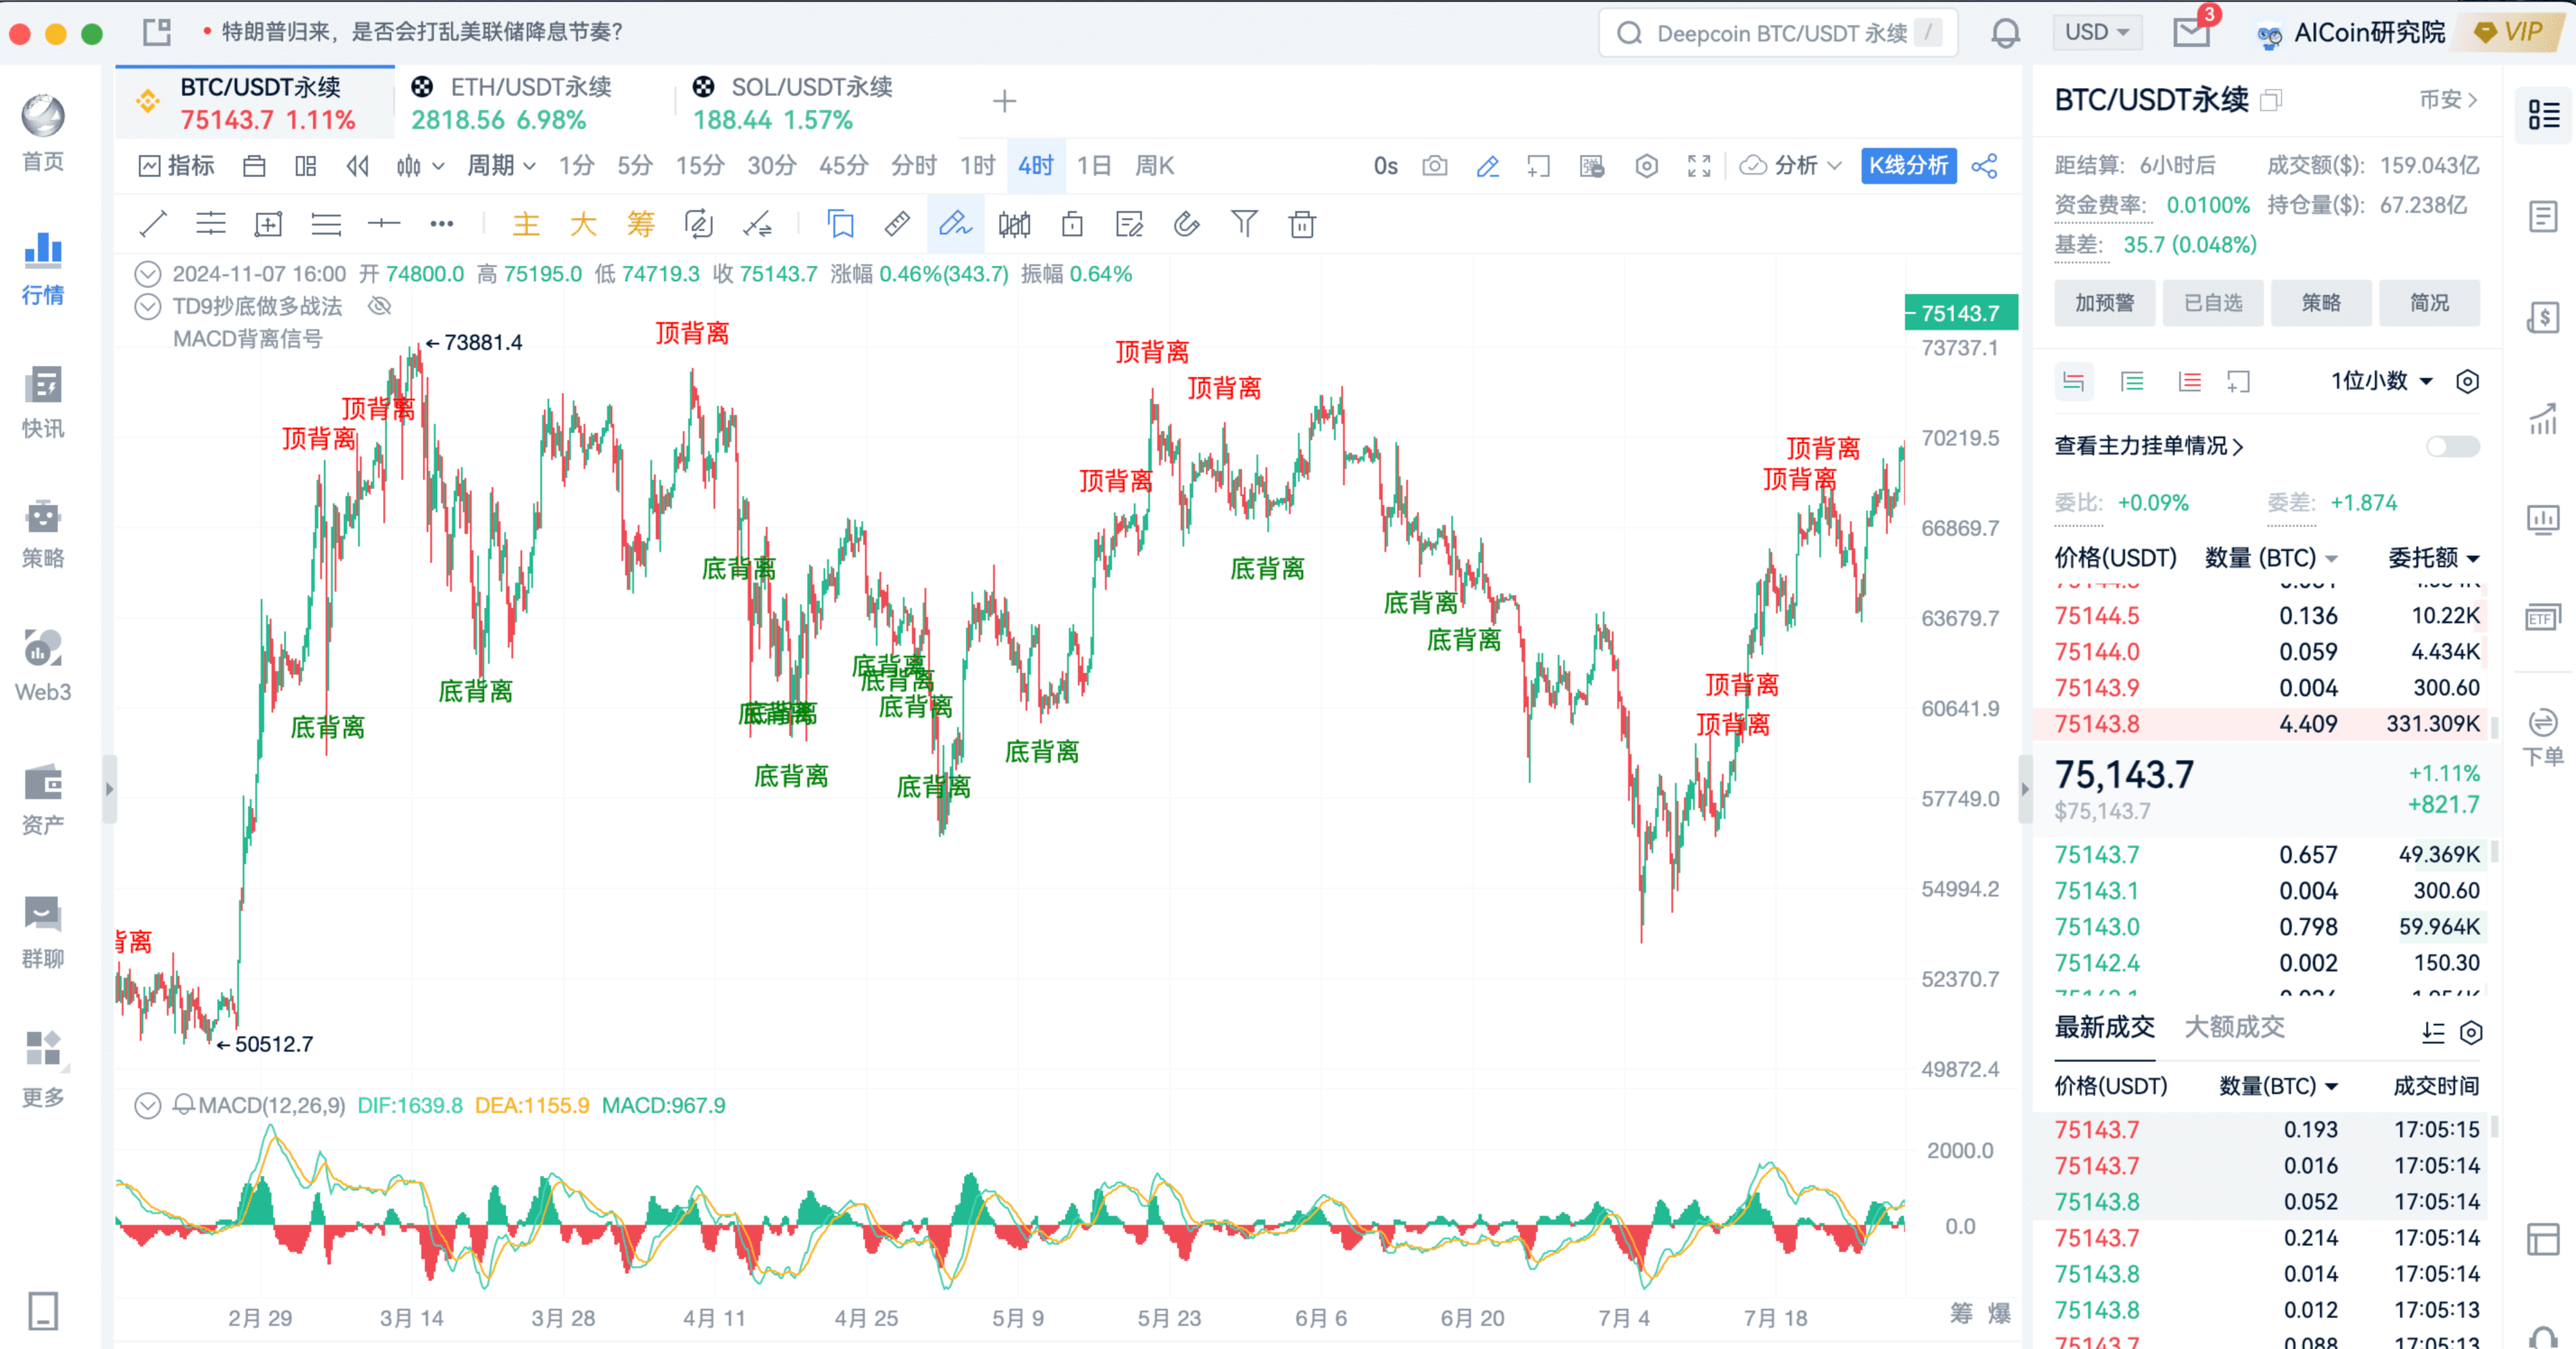
So MACD divergence actually has some left-side trading flavor.
Now I will share it with everyone; you can add it to your indicator system and try it out! It is very helpful!
// @version=2
// Calculate MACD indicator
[dif, dea, macd] = macd(close, 12, 26, 9, 'EMA', 'EMA');
// Detect MACD line divergence
dibeili = divergence(close, macd, 5, 50, 0, 1)
dingbeili = divergence(close, macd, 5, 50, 1, 1)
// // Draw MACD line and bars
// plot(dif, title='DIF');
// plot(dea, title='DEA');
// plotColumn(macd, title='MACD');
plotText(dibeili, title='Bottom Divergence', text='Bottom Divergence', color='green', refSeries=low, placement='bottom');
plotText(dingbeili, title='Top Divergence', text='Top Divergence', color='red', refSeries=high, placement='top');
alertcondition(dibeili, title='Bottom Divergence', direction='buy');
alertcondition(dingbeili, title='Top Divergence', direction='sell');
// Execute trading instructions!!! Must write when using backtesting!!!
// Close long position or sell spot. exitLongSignal is the signal to close long/sell.
exitLong(dingbeili, price='market', amount=1)
// Close short position. exitShortSignal is the signal to close short.
exitShort(dibeili, price='market', amount=1)
// Open long position or buy spot. longSignal is the signal to open long or buy spot.
enterLong(dibeili, price='market', amount=1)
// Open short position. shortSignal is the signal to open short.
enterShort(dingbeili, price='market', amount=1)
Just add it here like the host.
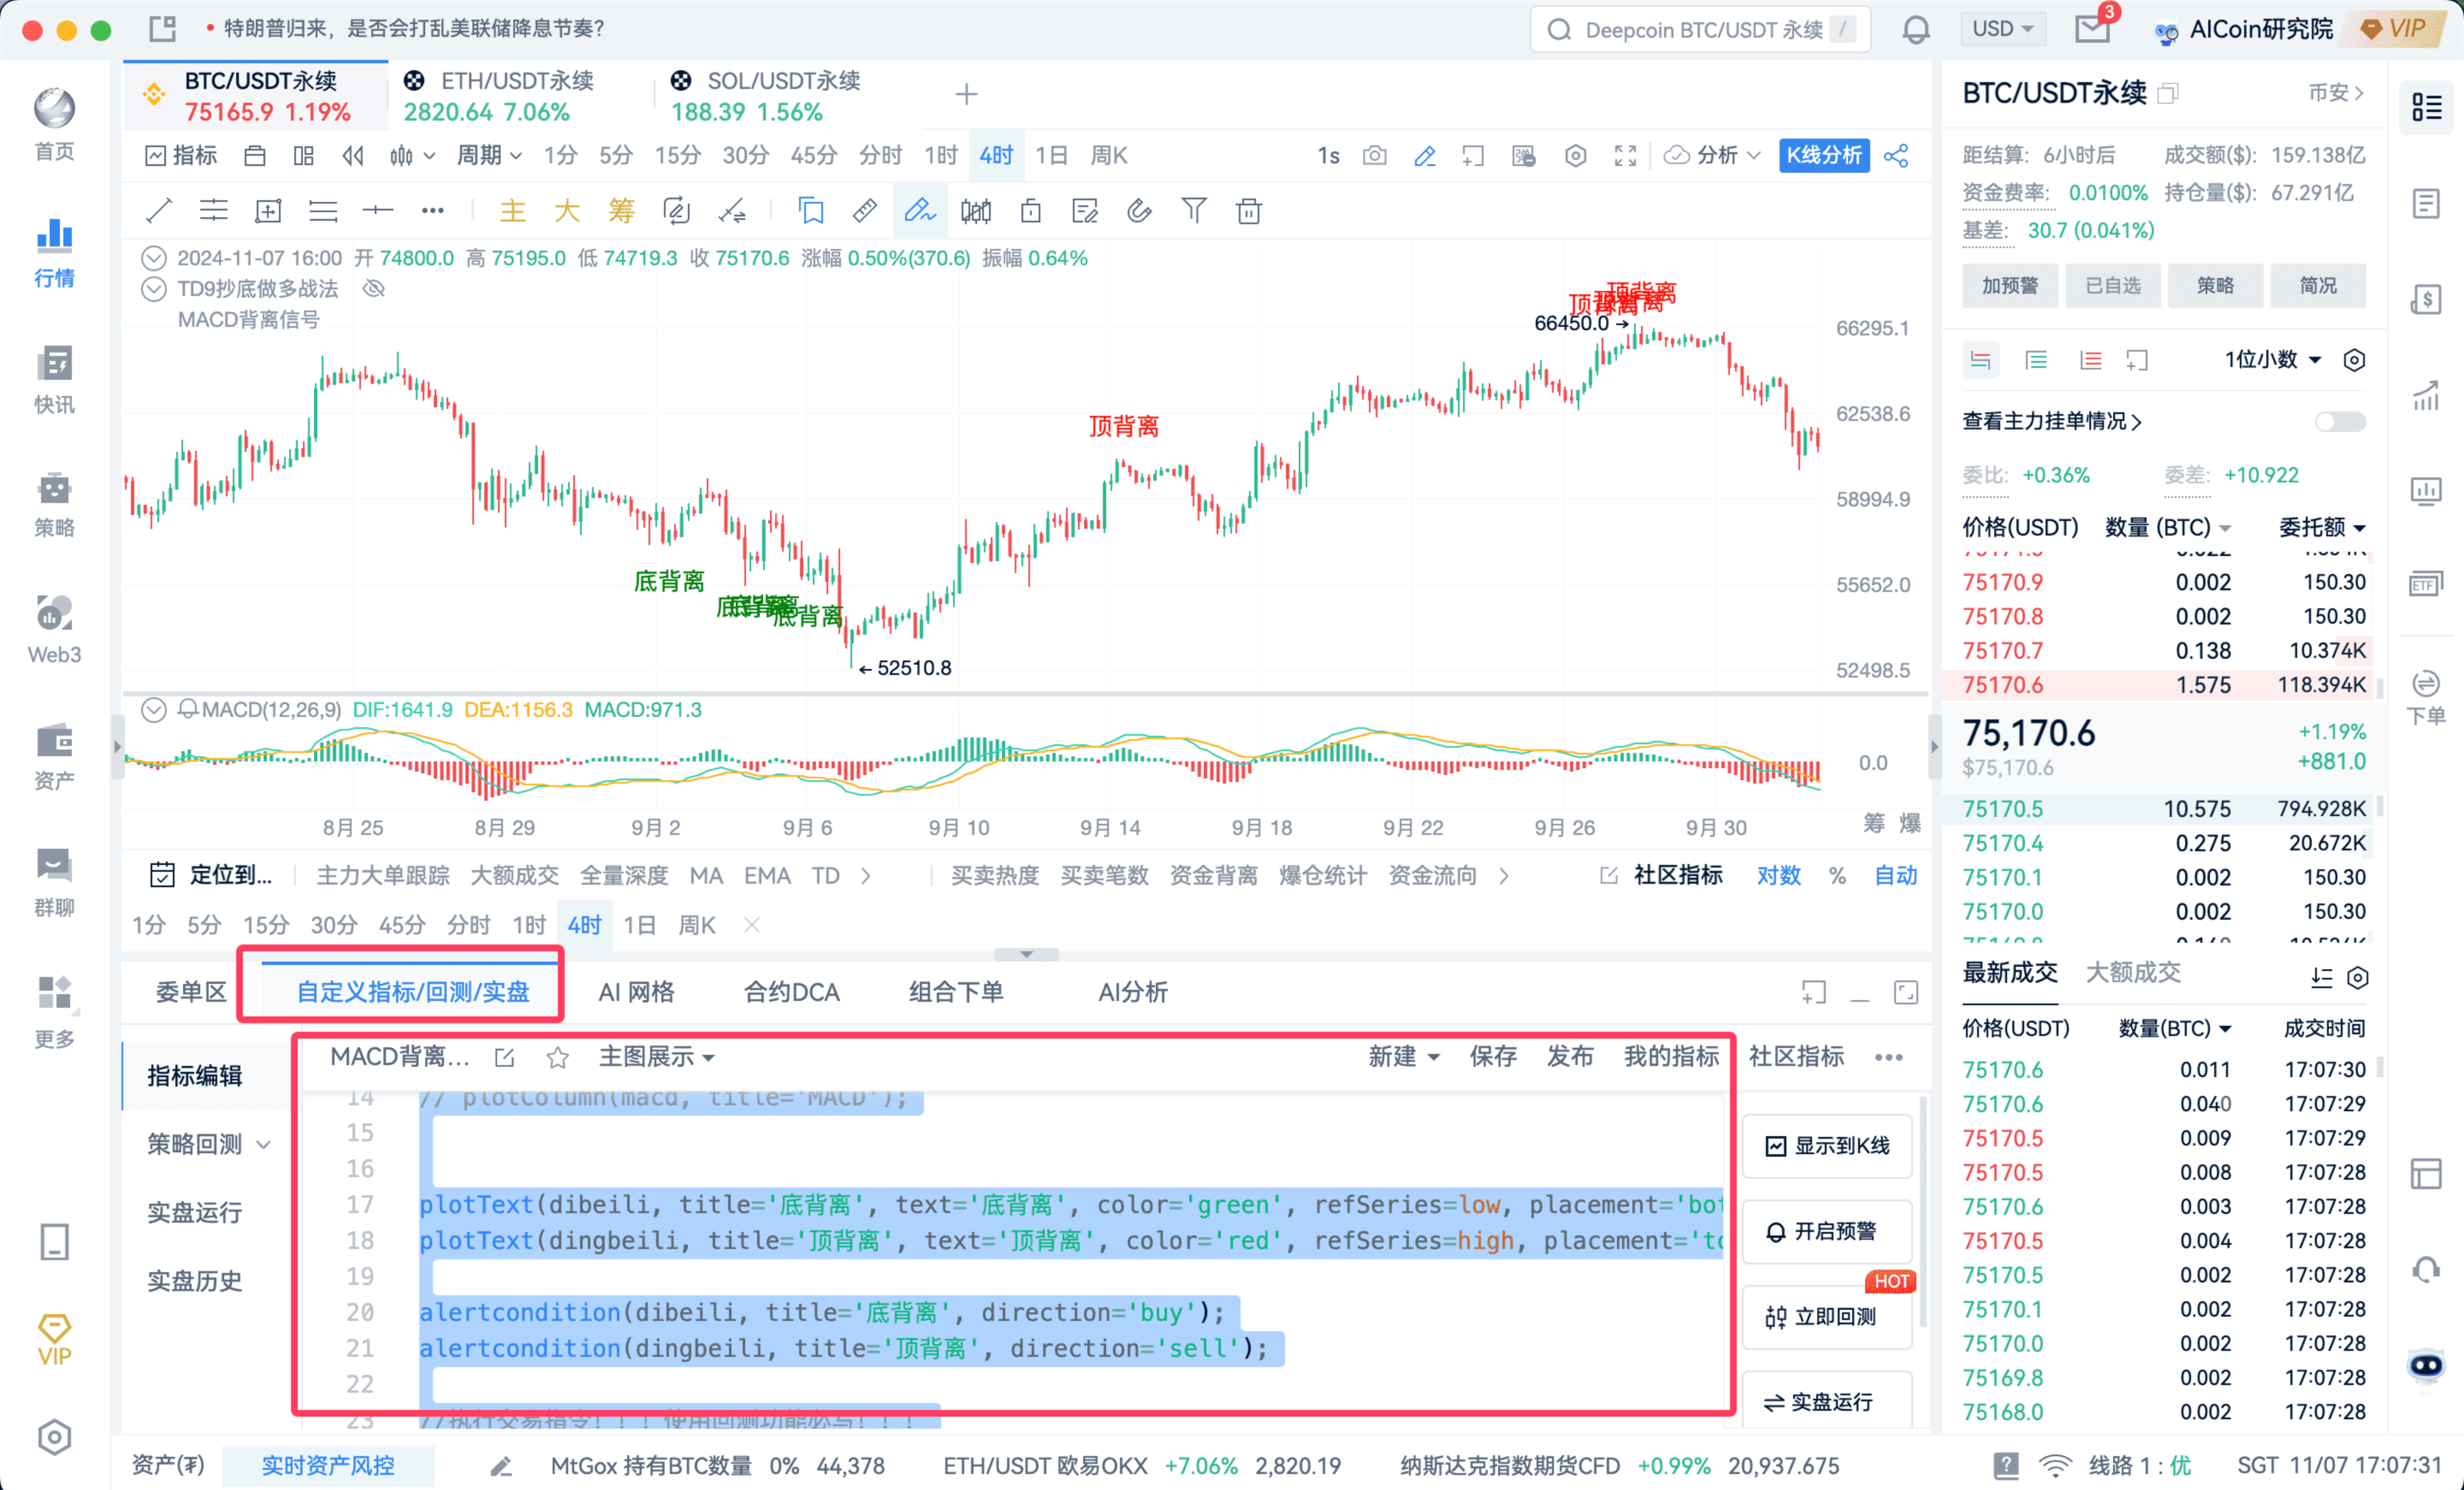
This concludes the content of this sharing session.
Thank you for watching, and we hope every AICoin user can find suitable indicator strategies and achieve financial success!
Recommended Reading
For more live stream insights, please follow the AICoin “AICoin - Leading Data Market and Intelligent Tool Platform” section, and feel free to download AICoin - Leading Data Market and Intelligent Tool Platform.
免责声明:本文章仅代表作者个人观点,不代表本平台的立场和观点。本文章仅供信息分享,不构成对任何人的任何投资建议。用户与作者之间的任何争议,与本平台无关。如网页中刊载的文章或图片涉及侵权,请提供相关的权利证明和身份证明发送邮件到support@aicoin.com,本平台相关工作人员将会进行核查。


