Conveying the Way of Trading, Enjoying a Wise Life.

Any decisions or trading plans made before the closing price of Bitcoin is established may backfire. The content I will discuss and share next, if you can understand it, will help you avoid many detours in your trading career. It is best not to make corresponding trading plans or decisions before the closing is confirmed.

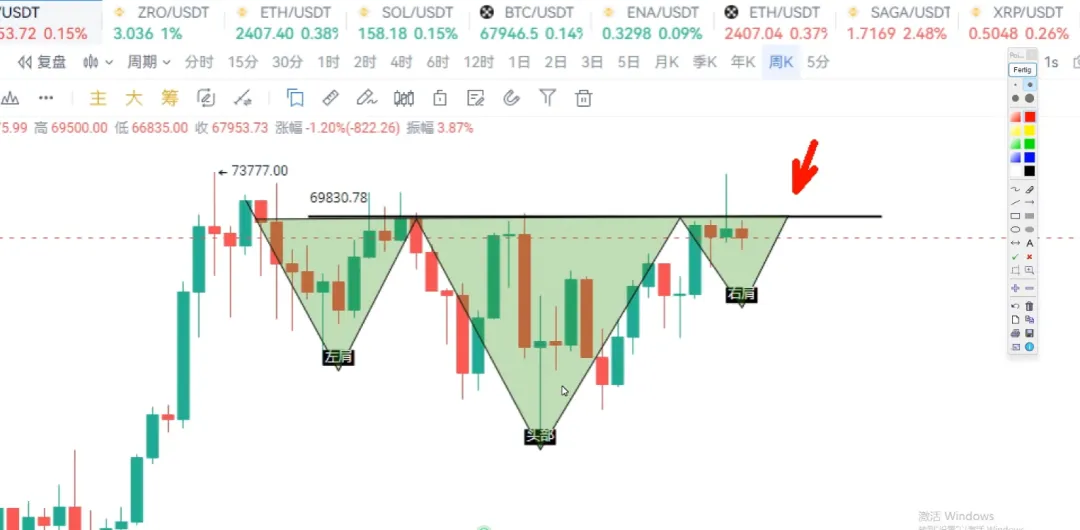
Last week, Bitcoin formed an inverted hammer candlestick, which is clearly a special candlestick in the five-star reversal pattern, with significant selling pressure above. Of course, if it appears at the bottom, it is a bullish signal; if it appears at the top, it is a bearish signal. In the battle between bulls and bears during the trading session, we found that the bullish force started to strongly attack from the bottom. During the attack, we did not see Bitcoin showing signs of weakness, but as the bears began to exert force subsequently, the price gradually pressed down from the high area, starting to sell off to offset the bullish attack. Ultimately, the closing price settled below $70,000, which is the neckline level. At this position, the appearance of such a candlestick pattern indicates that the price of Bitcoin will inevitably be suppressed by the bears in the subsequent price movements.
Therefore, Bitcoin is facing a new problem, which is the weekly MACD. After the golden cross, if a death cross occurs, it will exert pressure on Bitcoin or create a bearish force, which will bring some incredible blows to a group of enthusiasts or speculators who are keen on trading technology. We hope Bitcoin does not drop too deeply, leading to a divergence at the weekly level. This weekly divergence has actually evolved multiple times at the daily level, evolving into a double divergence. As for the daily chart divergence, we found that during the bullish attack, the price continuously reached new highs, but the corresponding indicators, including the energy bars, did not reach new highs, which means that the subsequent bullish momentum is insufficient. So what causes the lack of momentum? Some say it’s the election, others say it’s the Mentougou. So, does news affect prices, or do prices create news? Let’s leave this topic here for now; if you are interested, feel free to message me.

Regarding the daily chart divergence of Bitcoin, is there a possibility that the downward adjustment could evolve into a bearish divergence at the weekly level? We will put a question mark on that. From another perspective, is it possible for Bitcoin to form a head and shoulders bottom pattern? This kind of candlestick combination pattern, from the weekly chart perspective, has not yet fully formed the left shoulder, head, and right shoulder. For the head and shoulders bottom pattern to be established, it must break through $70,000 and stay above it. Until it is established and stays above $70,000, we cannot confirm the formation of the head and shoulders bottom structure.

So, the price of Bitcoin needs to test the right shoulder next, and this right shoulder position should ideally not fall below the left shoulder position. It appears that the right shoulder of Bitcoin at the weekly chart breakout point is $62,800, while the left shoulder's high point is $57,300, indicating that Bitcoin still has considerable room for fluctuation at this point.
Next, we need to pay attention to the support level of $69,000 for Bitcoin, which has already passed without effectively holding above it. Therefore, we should focus on Bitcoin's important support level, which is its 10-week moving average at $65,600. If the 10-week moving average breaks, we need to pay attention to the 30-week moving average at $62,000. The 30-week moving average is also a trend indicator that determines Bitcoin's direction and movement. If this level is also broken or closes below it, the consequences could be dire.
Summary: The current decline is not over. If it can stay above $69,000 or even $70,000, the head and shoulders bottom will be established; otherwise, Bitcoin will fall back down. During the pullback process, we need to pay attention to several points: the first point is the 10-week moving average at $65,500, and the 30-week moving average at $62,000. Currently, it is consolidating around the 5-week moving average at $67,200. This is today's analysis of Bitcoin's market.
Try not to make decisions before the price closes. If there is a possibility of a bullish or bearish reversal, after making a decision, be mentally prepared for the price to move in the opposite direction; otherwise, it will lead to a collapse of our mindset.
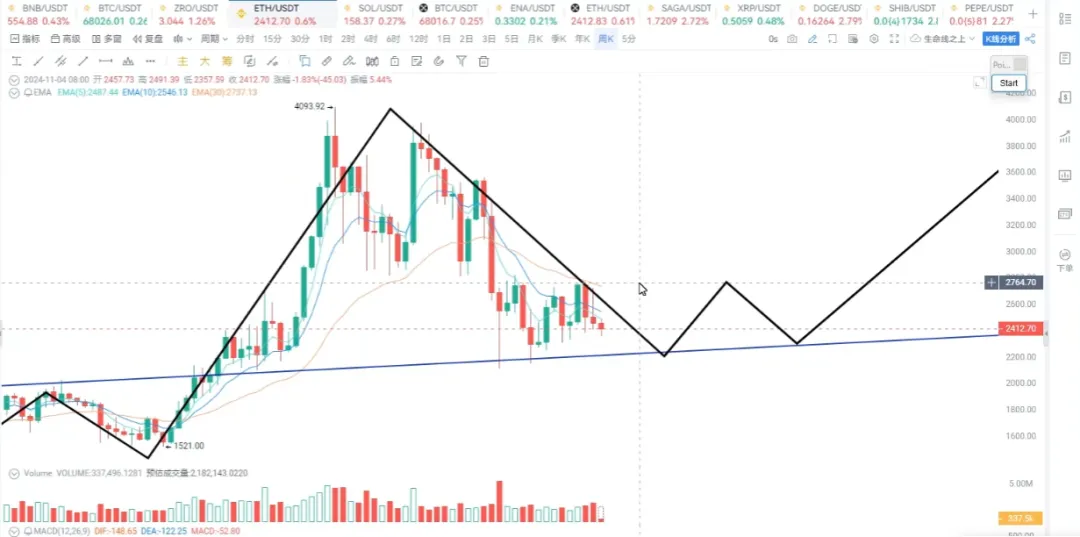
From the weekly chart perspective, Ethereum's price movement is under pressure from the 30-week moving average, closing below the 5-week moving average. Clearly, Ethereum's performance as a mainstream asset is far weaker than Solana.

Ethereum is currently at a very critical point, with $2,250 becoming a defensive level for bulls. If this level is broken, the consequences for Ethereum could be severe. Therefore, $2,250 can also be an opportunity to build a position in Ethereum again; if it breaks, stop loss.
For more information, you can contact our assistant and join the VIP group.
免责声明:本文章仅代表作者个人观点,不代表本平台的立场和观点。本文章仅供信息分享,不构成对任何人的任何投资建议。用户与作者之间的任何争议,与本平台无关。如网页中刊载的文章或图片涉及侵权,请提供相关的权利证明和身份证明发送邮件到support@aicoin.com,本平台相关工作人员将会进行核查。


