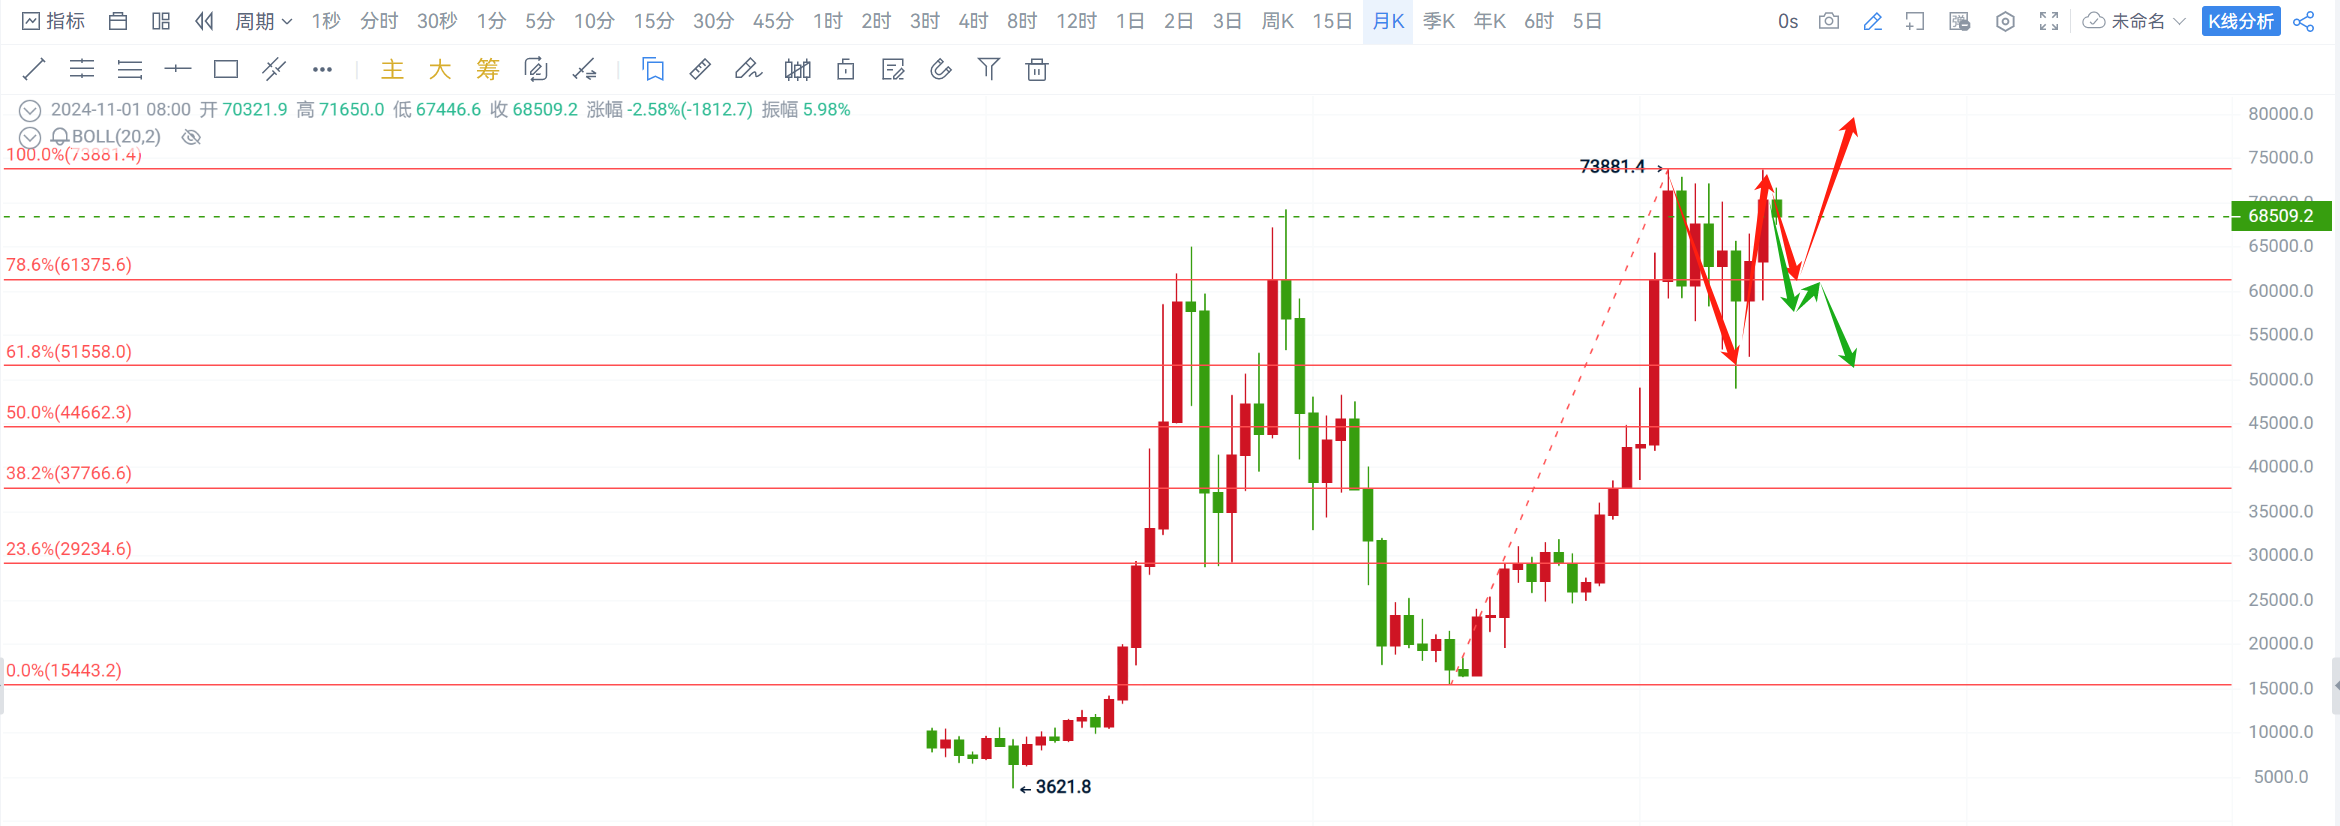
Currently, looking at the monthly chart, Bitcoin has risen to around 73880 after breaking the previous historical high of 69000. The trend over the past six months has been characterized by high fluctuations and pullbacks, with a significant retracement to the Fibonacci 61.8% level (51558). After confirming support with a second dip, it began to rebound, recently testing the previous high of 73880 again. The monthly chart has once again closed with a large bullish candlestick, but the body of the candlestick has not broken the previous high, making another pullback inevitable unless there is a decisive news event that could change the trend.
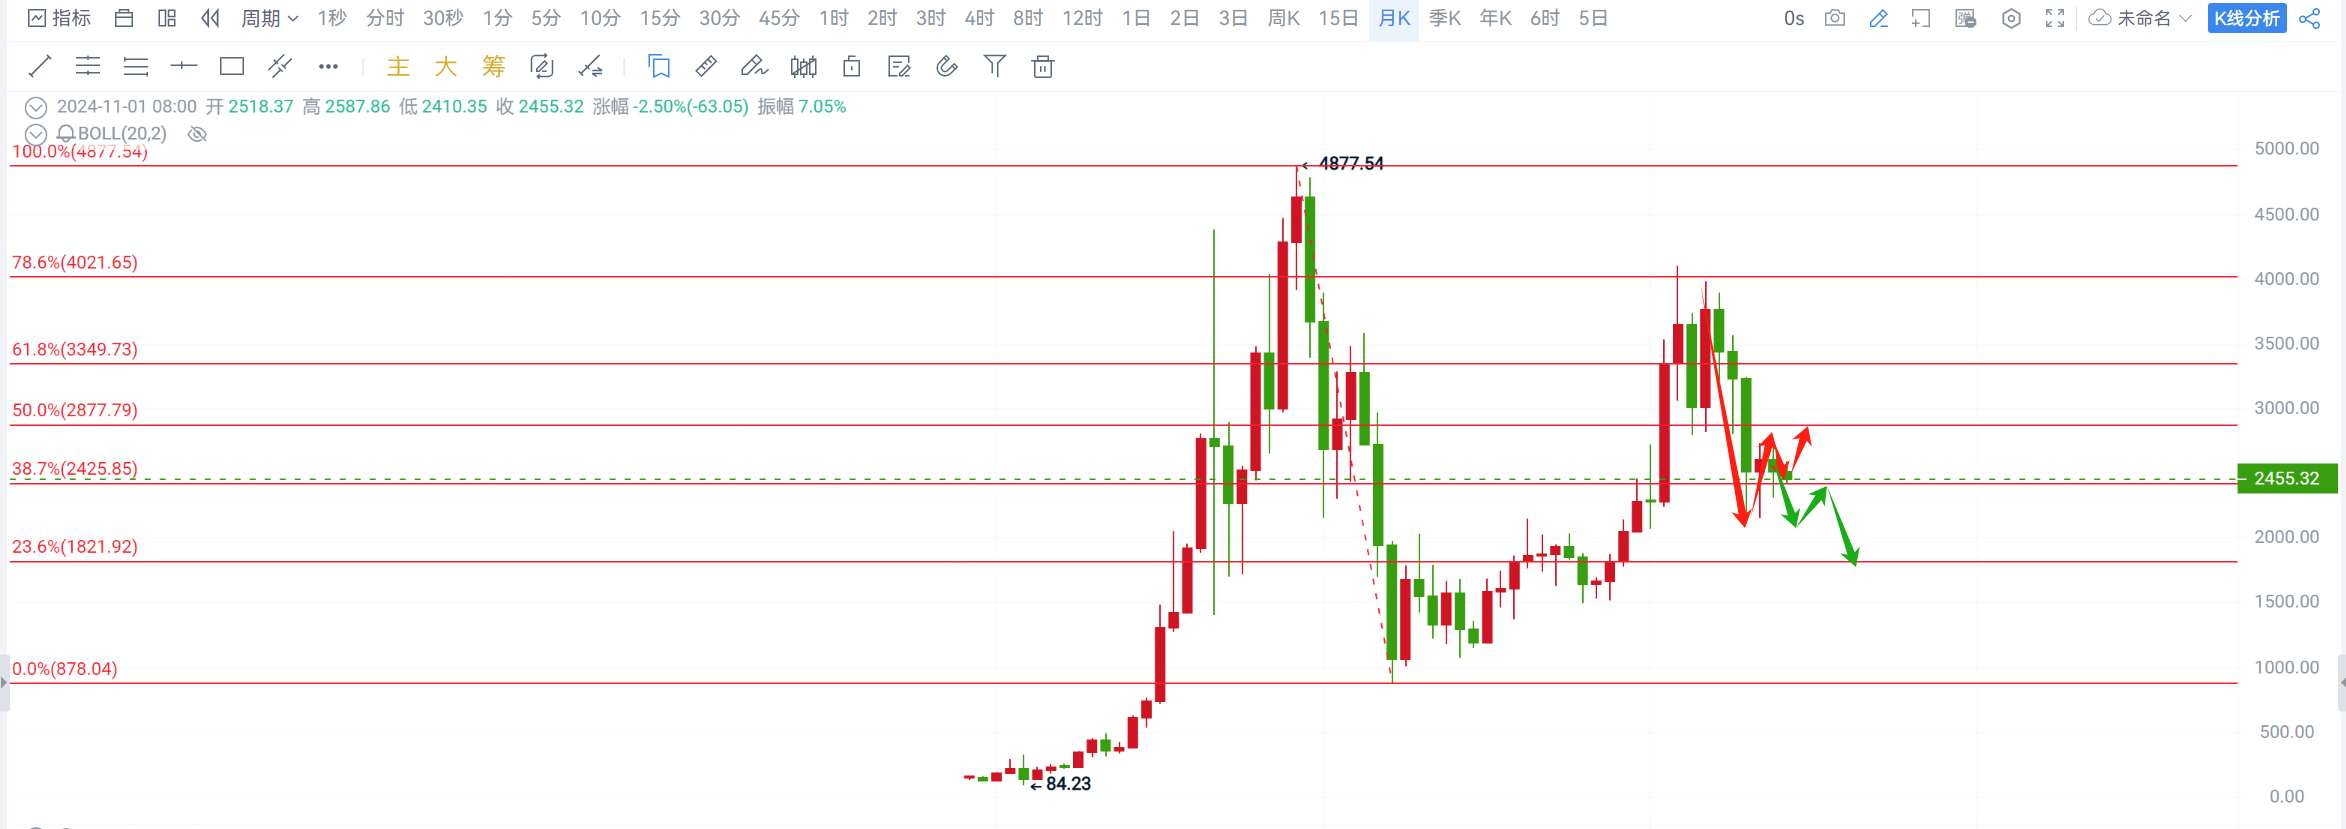
The performance of Ethereum is even less satisfactory. Compared to Bitcoin's previous high of 73880, Ethereum is at least around 4000; however, since it fell below 3000, it has not been able to reach that level again. This month, Bitcoin's strong performance has surprisingly resulted in a bearish continuation pattern, indicating that Ethereum is in a range-bound consolidation between 2700 and 2400. Currently, two points need attention: the upper Fibonacci 50% level (2877) and the lower 38.7% level (2425). A break of the daily candlestick body can be followed for entry!
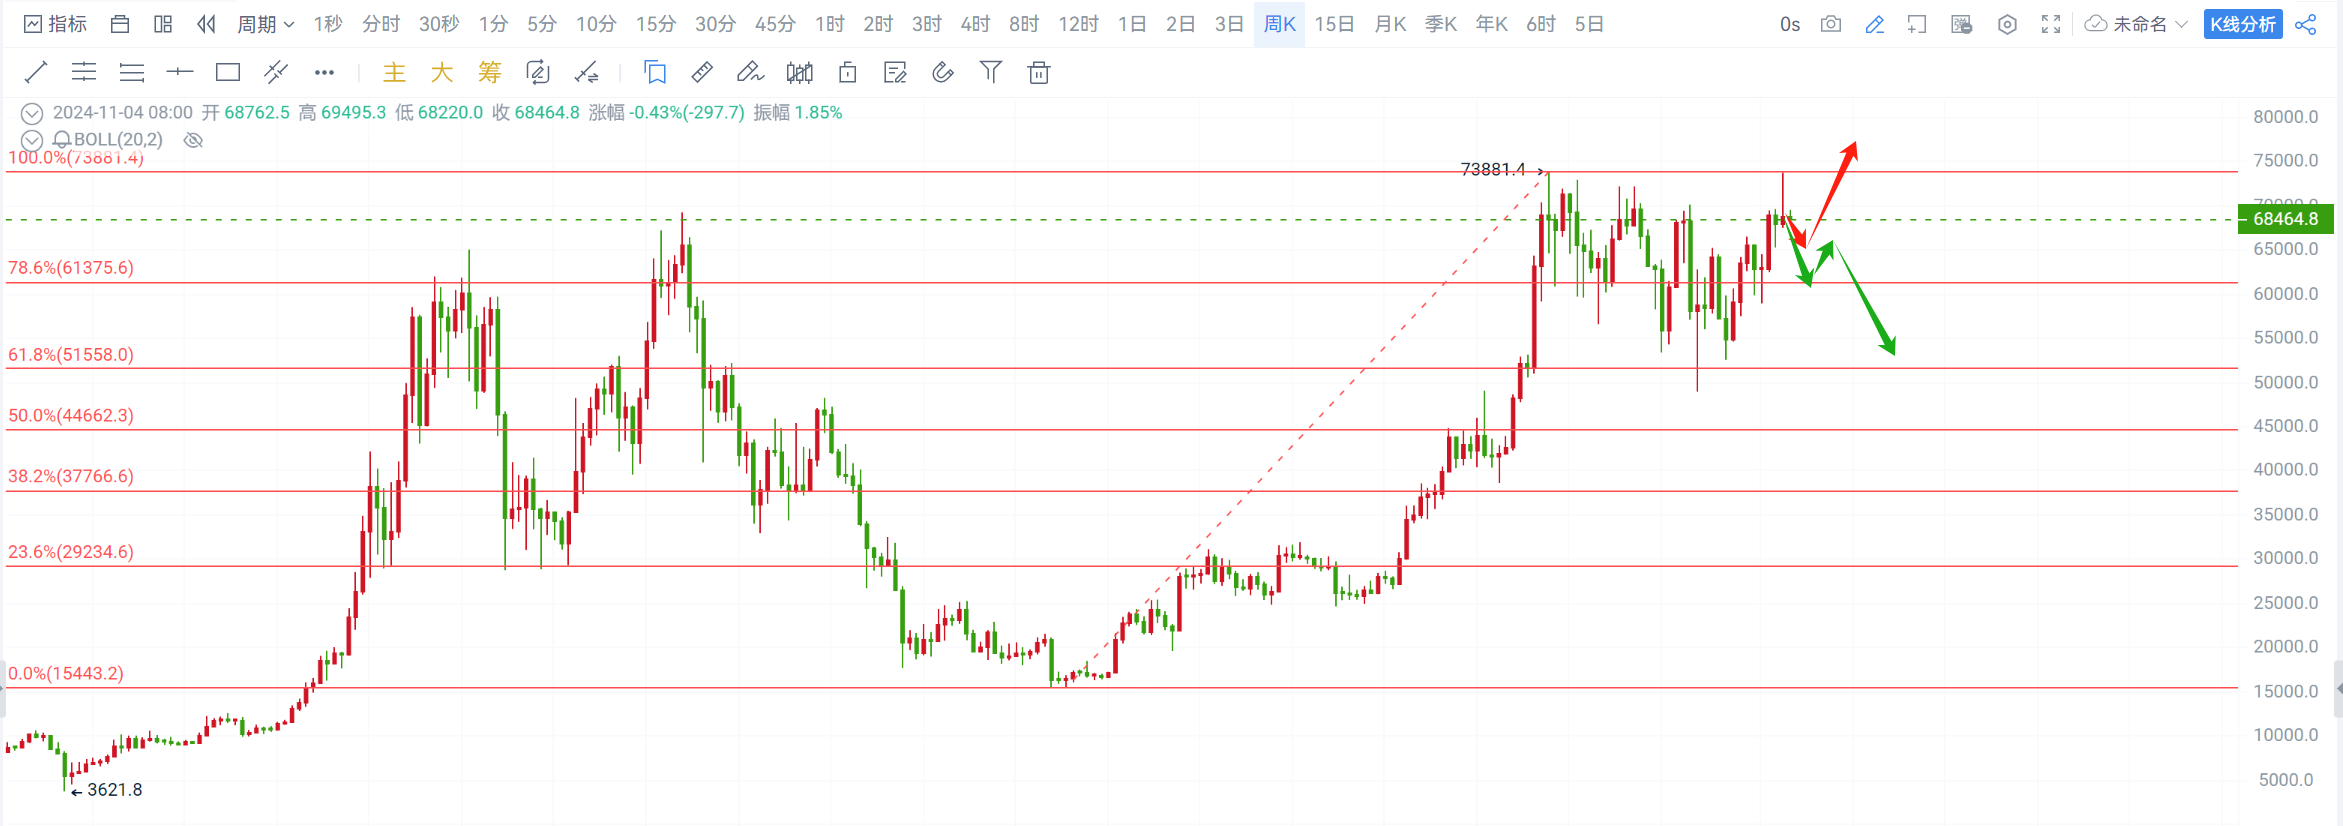
On the weekly chart, after Bitcoin tested the previous high, it closed with an upper shadow bullish candlestick. The body of the candlestick did not break the resistance level of 69000, indicating that the pressure above is still very strong. The support level to watch below is 68000; a break below this level would continue the bearish trend. Ethereum continues to close with an upper shadow bearish candlestick, remaining in the 2700-2400 range, and a break can be followed for entry!
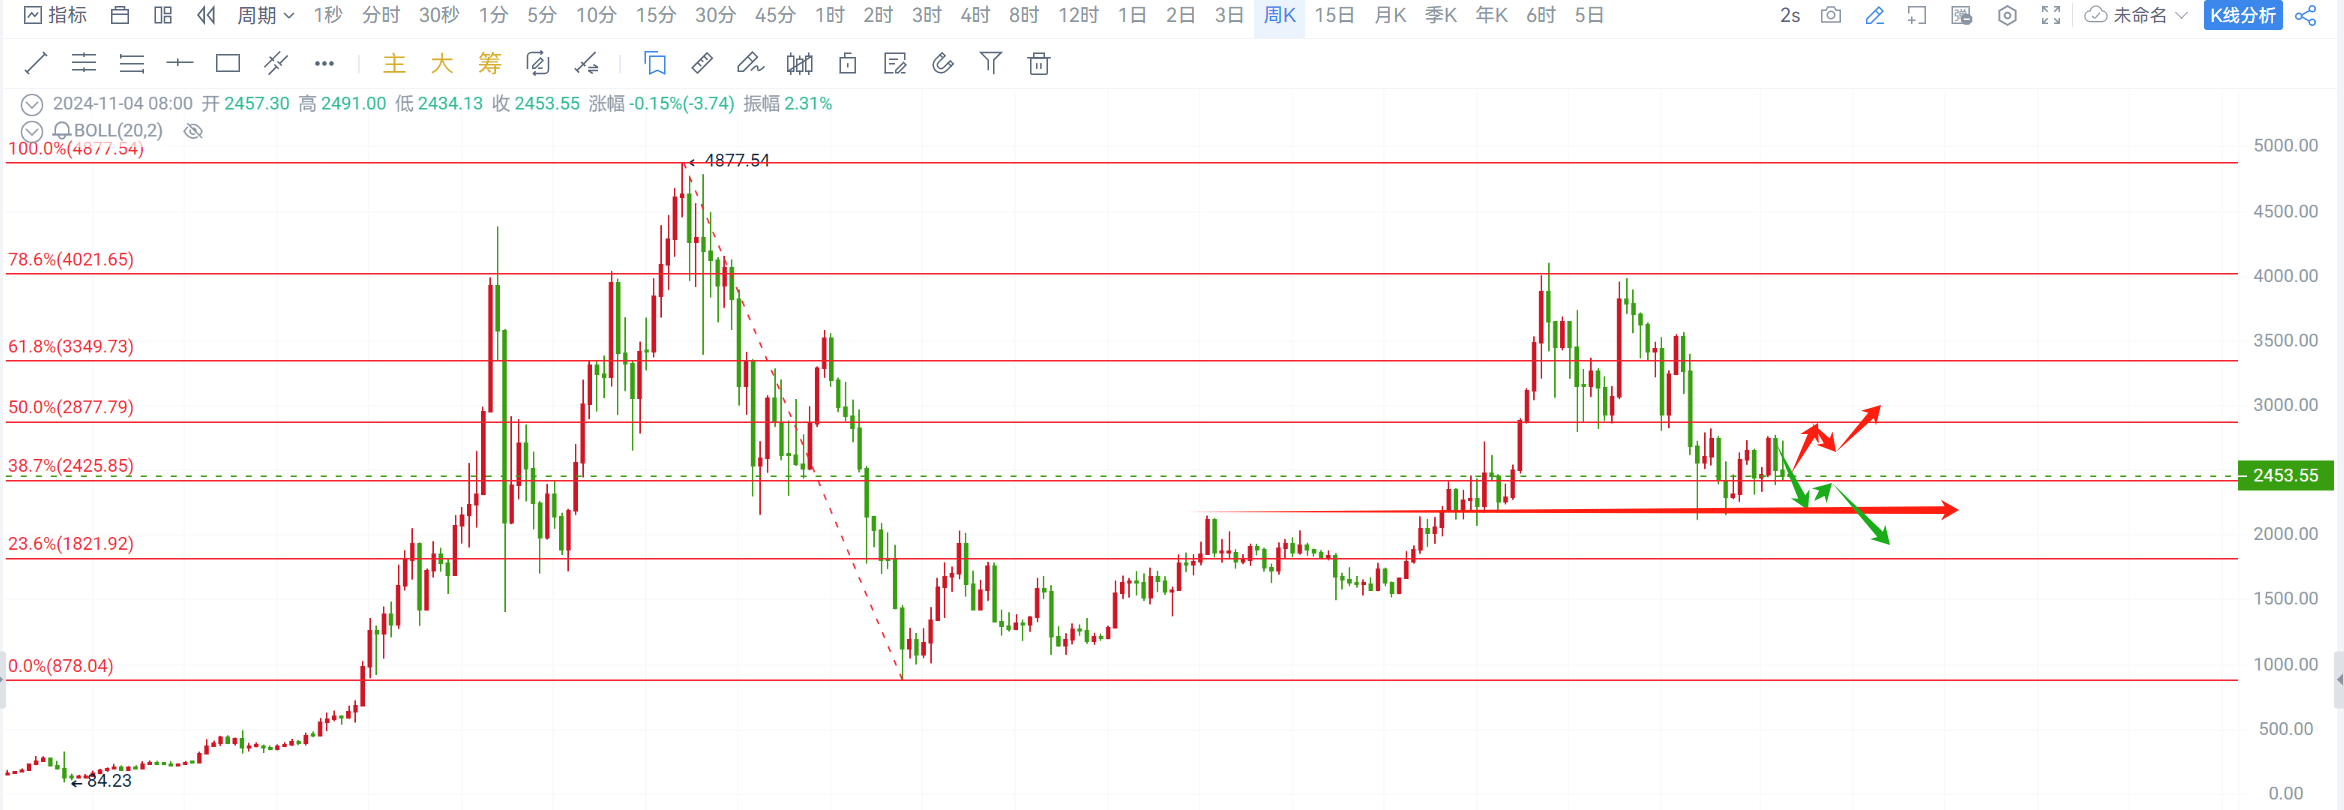
On the daily chart, Bitcoin has closed with five consecutive bearish candlesticks, and the anticipated bearish trend is progressing smoothly. Currently, we need to observe the support situation at the 68000 level; if it breaks, we look at the 66000 level. The resistance level is temporarily set at 69500. For Ethereum, there is no need for extensive analysis; resistance is at 2500, and support is at 2400!
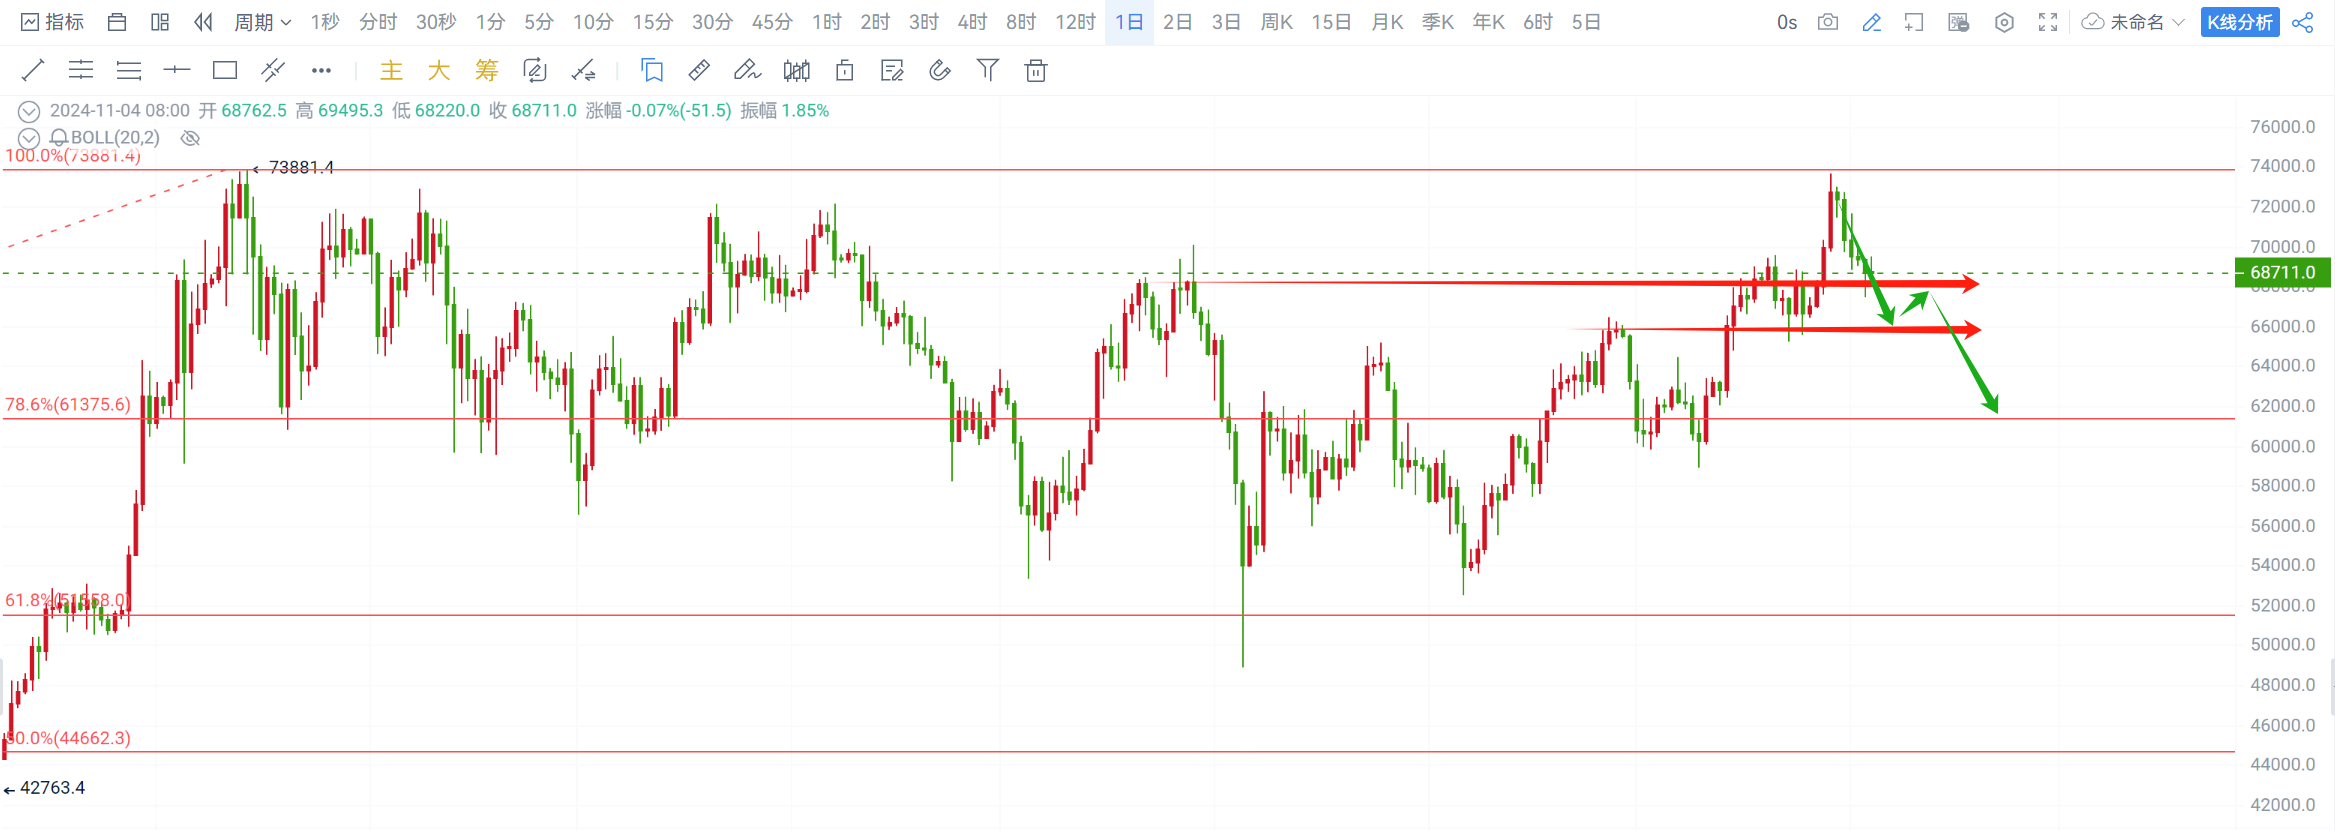
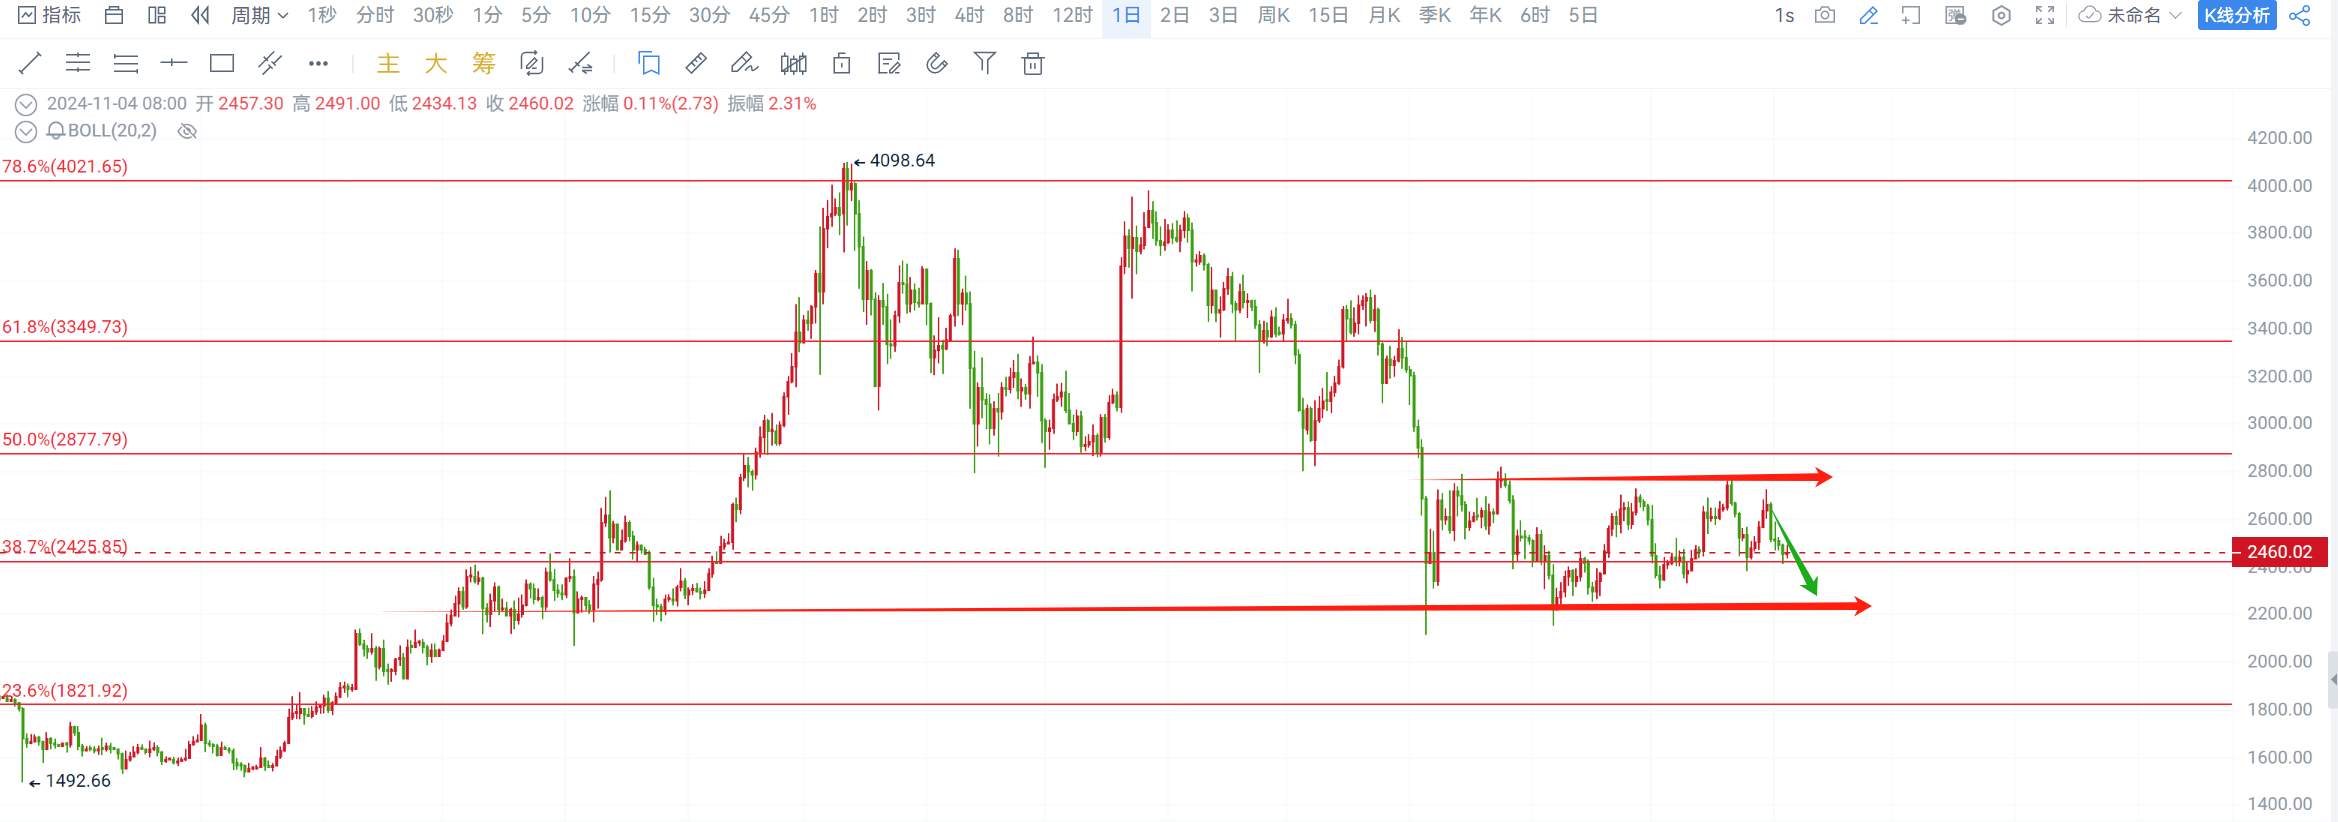
At the end of last month, the medium to long-term short positions established when Bitcoin tested the previous high have basically met expectations, and the shorts have successfully taken profit. The subsequent recommendation is still to focus on shorting near the resistance level with a bearish continuation mindset!
Trading strategy: Aggressive shorting!
Short Bitcoin at 69200-69600, target 68500-67500, stop loss above 70200;
Short Ethereum at 2480-2510, target 2420-2380, stop loss above 2540;
The strategy is time-sensitive; specific guidance will be provided in real-time privately!
Professional team gold medal analyst Ruo Yu focuses on contract trading guidance. Follow the WeChat public account "Coin Circle Ruo Yu" to understand real-time market analysis and trading strategies!

免责声明:本文章仅代表作者个人观点,不代表本平台的立场和观点。本文章仅供信息分享,不构成对任何人的任何投资建议。用户与作者之间的任何争议,与本平台无关。如网页中刊载的文章或图片涉及侵权,请提供相关的权利证明和身份证明发送邮件到support@aicoin.com,本平台相关工作人员将会进行核查。


