Author: The Giver
Translation: Deep Tide TechFlow
This is a very long thread aimed at documenting the process of Bitcoin's price rise since October 15. I will reiterate my original viewpoint from my guest appearance on @1000xPod.
Before we begin, I want to make it clear that this is not a suggestion for you to go long or short on any coin, especially since the open contracts and positions are extremely crowded in the coming week. The likelihood of us challenging the all-time high (ATH) is very high, and one could even say it is very likely. This could bring significant right-side effects. Specifically, I believe managing a new short position here could be very difficult. That said, moving on—
Today, I hope to define the nature and intensity of the capital flows into Bitcoin since mid-October. I will discuss how BTC has increased by $250 billion since its low of $59,000, the total crypto market cap has increased by $400 billion, and describe what I believe to be a constrained capacity that exists in Q4 2024, which I think will not be substantially broken.
I have two aspects of views: 1) New capital is still constrained, which is a necessary premise; the strong inflows we have observed over the past two weeks are primarily speculative capital; 2) The excess liquidity required to generate a surge like we saw in 2021 does not exist.
However, I believe the following principles are severely overlooked and discussed very little, mainly because the analysis regarding price increases is very superficial and is usually only focused on when prices are falling.
You need to believe:
1) The direction of the elections will not drive price-dependent outcomes; rather, Bitcoin is currently being used as a liquidity tool to hedge against a Trump victory.
2) The "relaxation conditions" necessary to create new all-time highs today are not sufficient. The correlation of interest rates and other popular heuristics with genre liquidity is far weaker than popular discourse suggests, and signs indicate that prices are ultimately being suppressed rather than discovering prices.
Restating Previous Views
When Bitcoin broke through about $61,000/62,000 during the Columbus holiday, it made me want to revisit the events at that time. Therefore, starting from that week (which will be presented later on @1000xPod), I predicted the following, summarized as follows:
- BTC.D increases (while BTC itself may challenge $70,000 before the election results)
- Meanwhile, mainstream coins and altcoins generally decline relative to BTC—because the speculative capital mentioned in point 1 is only focused on BTC as a hedge against a Trump victory.
- Initial inflows (cost basis between $61,000 and $64,000) are sold off before the actual election, leaving new directional capital (and speculative capital).
- Through the effects of points 1 to 3, regardless of who wins, Bitcoin will decline in the medium term.
Therefore, I suggest going long on BTC and shorting "everything else."
Why Are Capital Flows Mercenary in Nature?
My understanding of this positioning has three main aspects:
1) Microstrategy is the preferred tool for large-scale investments and risk exposure: rapid expansion is often accompanied by local peaks.
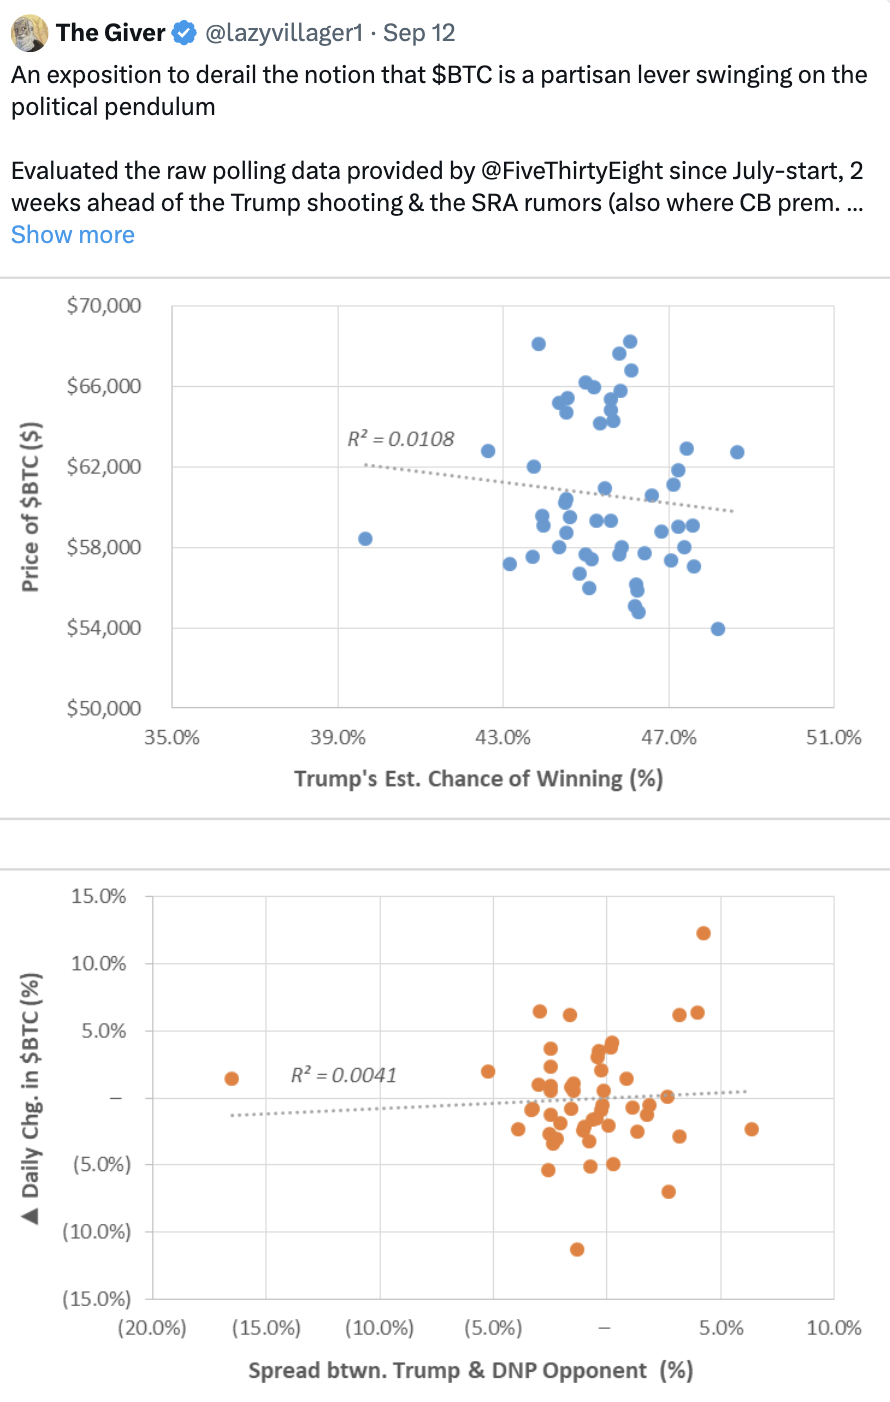
2) The market consensus on the "Trump trade" is incorrect; its impact is not causal, meaning that an increase in Trump's chances does not linearly create opportunities for BTC's performance, but rather the basket of assets that rose this month reflects an underestimation of a Trump victory.
3) A new participant has emerged in this cycle—this capital is different from previous participants—it has no intention of recycling funds within the ecosystem; crypto-native capital has already been fully deployed, and the likelihood of spot follow-up is low.
Case Study on Microstrategy
I believe Microstrategy is one of the most misunderstood investment tools currently: it is not just a simple holding company for BTC, but more like a FIG (NOL (net operating loss) covered through new capital raising), with its core business revolving around generating non-liquid net interest income (NIM).
NIM is a concept that can be most easily understood through insurance companies seeking returns on long-term deposits, typically obtaining such returns in the form of liquidity premiums (like bonds), where ROE (return on equity) is greater than ROA (return on assets).
In the case of MSTR or any other stock, MSTR is compared on two fronts:
- Expected BTC price growth (defined as BTC yield)
- Weighted average cost of capital (WACC)
Microstrategy can be said to be an under-leveraged enterprise with a light asset burden—most of the company's obligations are covered before BTC reaches $10-15K, making its capital efficiency very high:
It can efficiently enter the credit market and has arranged over $3 billion in convertible bonds, typically structured the same way: a 1% coupon and a 1.3 times conversion premium cap, redeemable if the exercise price exceeds the actual price at some point in the future. However, from its 2028 secured notes, we can see that MSTR's fixed debt cost is about 6% (already repaid).
Thus, we can visualize MSTR's overall capital cost from a credit perspective, utilizing the allocation to achieve a 1.3 times MOIC implied probability, using a mixed convertible bond tool.
If within 5 years, you receive $1 annually (without redemption), then for the lender, to maintain balance between providing convertible bonds and $6/year payment notes, this means that a gap of $5 annually over 5 years must be filled by a one-time payment of $30 in year 5.
Therefore, we can derive the following formula: 5 + 5/(1+x)^1 + 5 + 5/(1+x)^2 + 5 + 5/(1+x)^3 + 5 + 5/(1+x)^4 must equal 30/(1+x)^4. This equates to about 9% capital cost, while the implied equity cost of current debt as a proportion of market value is about 10%.
In simple terms: If BTC yield, i.e., the expected annual growth rate of BTC, can exceed 10%, then MSTR's premium should expand relative to net asset value (NAV).
Through this framework, we can arrive at an understanding that the premium reflects overly eager sentiment or expectations of imminent BTC expansion—thus, the premium itself is reflexive and patient, rather than lagging.
Therefore, when we overlay the premium onto the BTC price, we see two periods where the premium exceeds 1—first half of 2021 (when BTC first approached $60,000), and the peak in 2024, when we were previously close to $70,000+.
I believe that as the stagnation premium ends tomorrow, the stock market is aware of this and anticipates that the earnings will be used to purchase BTC, expressing this expectation in two ways:
Buying MSTR in advance, predicting that the premium will recalibrate to ~1-2 times, as Saylor may buy more BTC;
Directly purchasing BTC, not only to cater to a Trump victory but also for Saylor's buying intentions (through IBIT inflows).
This theory aligns with the options market (which leans towards the short term), where we have seen increasing activity, expecting BTC prices to reach $80,000 by the end of the year, which matches the implied BTC yield created by MSTR purchases (1.10x $73,000 ≈ $80,000).
However, the question is: What type of buyers are these? Are they here to collect price discovery at $80,000+?

How Did This New Capital Affect October's Price Movements?
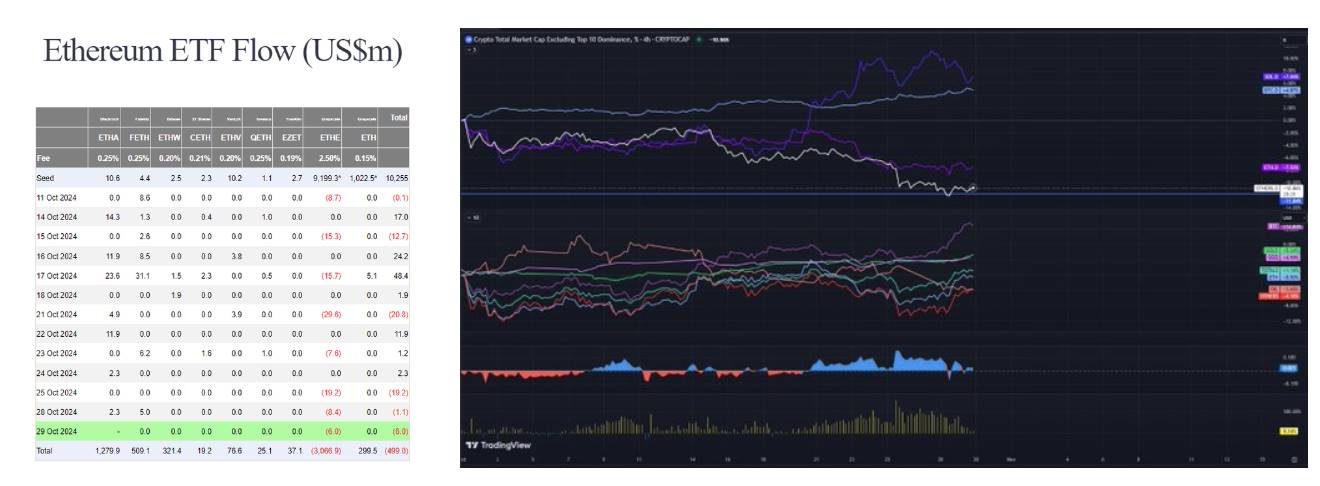
Despite the initial correlation through algorithms and perpetual contracts, almost all assets, except BTC, lack sustained follow-up, leading to speculation that the current bidding is merely through MSTR and BTC ETF inflows.
We can draw several points from this:
- ETH ETF: Despite new inflows into ETH ETF exceeding $3 billion since mid-October, there has been virtually no net inflow. Similarly, ETH CME's open interest (OI) appears unusually flat, leading us to conclude that this buyer is not inclined to diversify; they are only interested in Bitcoin.
- BTC exchanges and CME's open interest are also at historical highs or close to historical highs. The open interest in futures reached a peak this year, hitting 215,000 units, which is 30,000 units higher than mid-October, increasing by 20,000 units since last weekend. This behavior reminds us of the desperation for exposure we saw before the BTC ETF launch.
- Before mid-October, the strength of alternative coins against BTC gradually weakened, with Solana's strength following ETH and other altcoins, showing lackluster performance and appeal. From an absolute perspective, other altcoins actually declined this month, about $220 billion, down from $230 billion on October 1.
What changed for Solana on October 20? I believe the growth of SOL (+$10 billion) mainly reflects an unexpected repricing of meme assets (observing the GOAT chart and underlying AI field, these phenomena occurred in abundance on Solana). Users must purchase Solana when entering the ecosystem and redeem it for Solana when profiting, which aligns with the L1 fat tail theory, reflecting a larger trend we saw this year with APE and DEGEN. During this period, I believe about $1 billion in wealth was created and passively held SOL during the election.
- For the first time this year, there has been a reduction in stablecoins, leading to a lack of self-generated dollars to create new demand (slowing) beyond the demand created today.
In traditional markets, we also saw similar repricing phenomena—we can observe how this demand emerged through the case study of Trump Media and Technology: the stock's price today is $50, while it was about $12 on September 23, with no new earnings or news releases. To better understand, Trump Media's current market cap is comparable to Twitter—an increase of $8 billion within a month.
Therefore, two possible conclusions can be drawn:
- The use of Bitcoin as a liquidity proxy merely reflects the funding of election bets and does not indicate sustainable long-term positions implied by other narratives (such as interest rate cuts, easing policies, and productive labor markets). If it were the latter, market performance should be more consistent, and other risk proxies (gold during dollar depreciation, otherwise SPX/NDX) should show more uniform strength this month.
- The market has fully anticipated a Trump victory; this capital is unstable and unwilling to participate in the broader ecosystem, despite today's positions indicating it should/will participate. This fractal is not prepared by crypto natives, as this type of buyer did not exist in the past.

What Does This New Buyer Refer To?
When analyzing the composition of participants, historically, it usually includes the following categories:
- Speculators (short-term/mid-term, typically causing deep capital troughs and peaks, very sensitive to price and interest rates)
- Passive bidders (through ETFs or Saylor, although he is making bulk purchases) are insensitive to price, happy to support pricing because they have formed a deep-rooted HODL behavior in typical 60/40 portfolio construction.
- Arbitrage bidders (insensitive to price but sensitive to interest rates)—employed capital, but overall have no impact on price, possibly the initial drivers of momentum at the beginning of the year.
- Event-driven bidders (creating open interest expansion over specific time periods), such as ETH ETFs and Trump’s summer activities, which we believe is what we are seeing now.
The fourth type of bidder has a summer playbook, which can be expressed through my previous tweets about Bitcoin as partisan leverage (next tweet).
This indicates that buying behavior is indeed impulsive and jumpy, but this buyer does not care about the election results (which can be interpreted as a lack of linear correlation between Trump's chances and Bitcoin's price). They may de-risk similarly to Greyscale bidders when the ETF trades go live, involving closed-end funds of BTC/ETH.
BTC as Leverage in Bipartisan Games
How Do Interest Rates Affect Bitcoin's Price?
In June/July (next tweet), I hypothesized that it is difficult to view interest rate cuts as a simple aspect of easing policy. In this tweet and subsequent content, I will debunk this theory and discuss a key missing variable that I believe has led us to overestimate Bitcoin demand: excess liquidity.
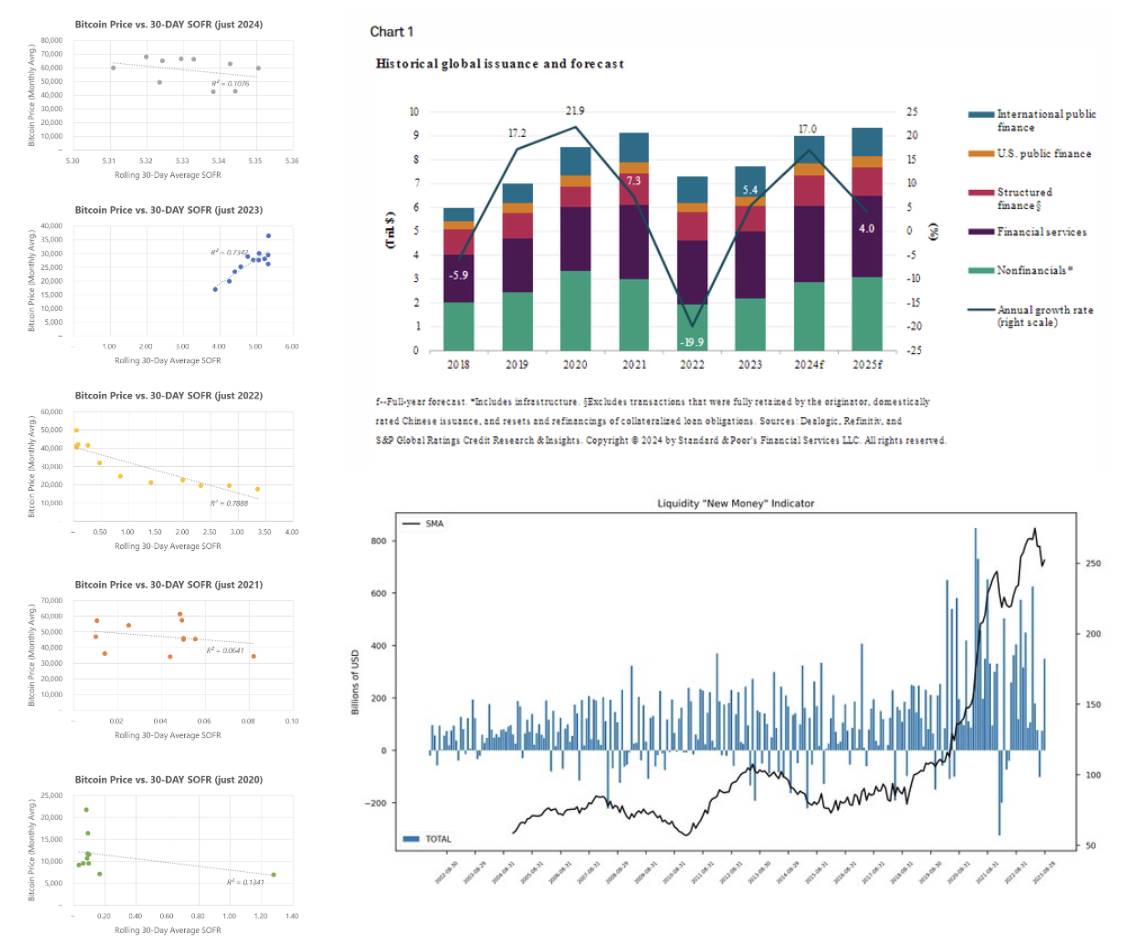
First, let’s independently compare Bitcoin's price over the past 5 years with historical SOFR (interest rates). This shows that the correlation in 2022 and 2023 is very strong, while in 2020, 2021, and 2024, it seems to exhibit a dispersed trend. Why is that? Shouldn't lower interest rates make borrowing easier?
The issue is that, unlike those special years, the lending market in 2024 is already quite strong, indicating that interest rate cuts are imminent. A unique mechanism is that the issuance period for lower-grade average debt is shorter (thus maturing in 2025-2027), which can be traced back to a few years of "high-level persistence."
You can also look at the debt index created by @countdraghula (ignoring quantitative easing) to outline actual debt growth.
Similarly, the stock market's performance has also been very strong: "The S&P 500 has surpassed any consecutive rebound in the past decade, totaling 117 weeks" (with no -5% returns). The last longest rebound was 203 weeks, when the economy recovered from the lows of the global financial crisis.
In other words, the credit and stock markets have created a massive recovery rebound without a recession occurring.
My reasoning is that we experienced unique mechanisms in 2021 and 2023 (COVID and SVB failure), which led to liquidity injections. Utilizing the power of the Federal Reserve's balance sheet to build new facilities.
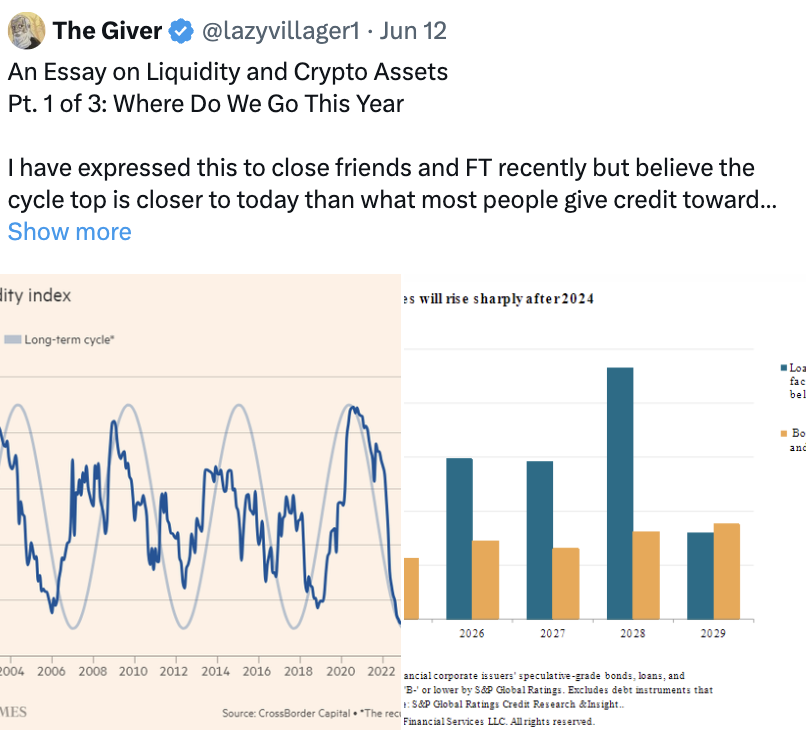
The Business/Liquidity Cycle Has Been Disrupted
Correlation Between Bitcoin and M2: Arguing How Emergency Measures Create Growth and Volatility
Bitcoin's growth is often seen as the primary cause, however, since 2022, the correlation between Bitcoin and M2 has been weakening (and has begun to resemble the peaks of 2021 again). I believe this is closely related to the current government's willingness to open its balance sheet to achieve financial stability. This is a do-whatever-it-takes approach.
Therefore, the key question is—what exactly is Bitcoin? Is it a leveraged stock? Is it a chaotic asset? Given that the underlying market (about $2 trillion) is already so large, nearly matching the TOTAL1 peak we saw in 2021, what conditions must occur for price discovery to happen?
I believe these questions are unlikely to be answered during this year's office transition period.

How Emergency Measures Support Bitcoin: Quantitative Easing Triggered by COVID in 2021
I believe that using the 2021 fractal to visualize future price movements is flawed. In 2021, at least about $2 trillion was injected through some projects. The maturity of these projects interestingly coincides with Bitcoin's price behavior (PA).
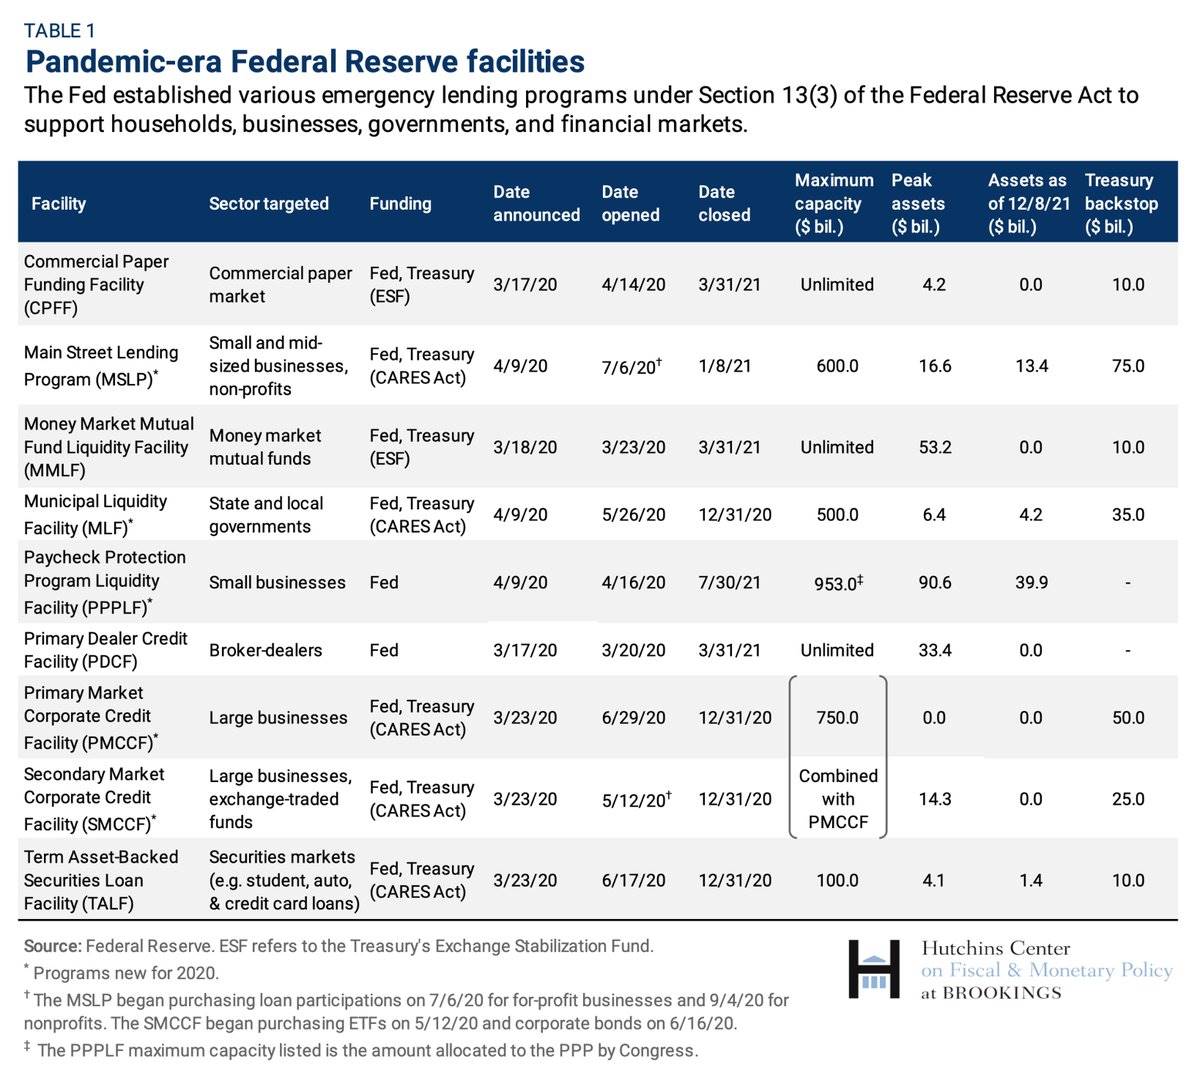
On March 15, 2020, the Federal Reserve announced plans to purchase $500 billion in Treasury securities and $200 billion in mortgage-backed securities. This ratio doubled in June and began to slow down in November 2021 (the pace doubled again by December 2021).
PDCF and MMLF (providing loans to high-quality money markets through stable funds) matured in March 2021.
Direct loans were reduced from 2.25% to 0.2% in March 2020. Direct loans to companies were introduced through PMCCF and SMCCF, ultimately supporting $100 billion in new financing (increased to $750 billion to support corporate debt) and purchases of bonds and loans. This would gradually slow down between June and December 2021.
Through the CARES Act, the Federal Reserve was prepared to provide $600 billion in 5-year loans to consumers, while the PPP program ended in July 2021. According to a report from December 2023, about 64% of the 1,800 loans at that time were still outstanding. As of August, 8% of these loans were in default.
The speed of this monetary injection and creation is very unique. This also clearly reflects the price movements of 2021—peaking in the first and second quarters, declining in the summer (when many projects ended). Ultimately, when these projects completely stopped, Bitcoin's price experienced significant downward volatility.
Further Easing in 2023: Bank Failures
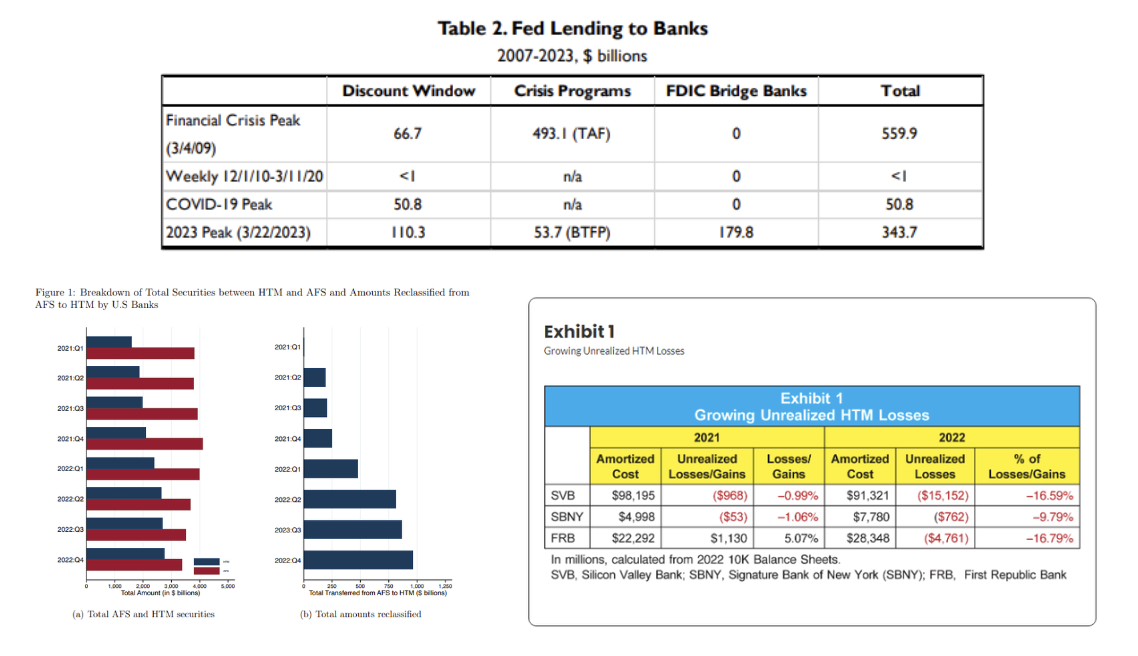
According to the Federal Reserve's balance sheet, as of March, the total loans from BTFP amounted to $65 billion, and the peak of the discount window also reached $150 billion. The Federal Reserve also lent about $180 billion to bridge banks to address the crises of Silicon Valley Bank (SVB) and Signature Bank.
To better understand, during this period, the level of loans from the Federal Reserve to banks was about 6.5 times that during the pandemic.
The reason is clear: all these holdings on bank balance sheets of held-to-maturity (HTM) securities are unrealized losses. These losses do not need to be reported according to FASB accounting standards. In 2022, U.S. banks' HTM investment portfolios grew from $2 trillion to $2.8 trillion, primarily due to being reclassified as HTM. This is generally acceptable (the market value of long-term fixed-income securities is affected by persistently high interest rates), but actual depositor demand led to bank runs, forcing liquidity to be realized—this involved markdowns on these securities.
Since March 2023, Bitcoin's price discovery has essentially been fluid, coinciding with the rollout of this plan—this plan stopped new loans in March 2024—during this period, crypto assets became overheated and experienced short-term corrections.
Glass Ceiling: Why It Exists
Overall, I believe the sequence of operations is:
- Capital was likely activated after the U.S. government's sell-off (central bank discount) and MSTR front-running trades, pushing the price from $59,000 to $61,000 through premium expansion.
- The rise from $61,000 to $64,000 occurred during the long weekend, primarily due to the impact of Trump hedging. Some capital exited last week when the price adjusted down to $65,000, resulting in some specific buyers this week having a very high cost basis (over $70,000).
- Driven by Trump's directional opportunities, ETFs continue to support spot prices (even though Bitcoin's beta has not increased), while laggards continue to lag despite expanding positions, lacking capital recovery.
- Bitcoin's buying pressure remains static within its own ecosystem and is unwilling to "participate" elsewhere.
Why I Don't Think There Will Be Strong Price Discovery in 2024:
- Lack of re-staking (measured by total locked value in DeFi compared to 2021).
- Overconfidence in the degree of volatility that will actually occur after interest rate cuts.
- Lack of very strong government stimulus (emergency injections).
- Weakened responses in other markets (such as stocks, gold, etc.).
In fact, the last part - some potential upside risks (some I have already considered, and some I believe are irrelevant within this timeframe)
- This week, M7's earnings totaled about $15 trillion. If they perform well (a month ago, I thought it would be difficult for most companies to surpass growth), then part of this new capital may flow in and invest in Bitcoin and its related assets. I believe earlier today, Alphabet rose $10 in after-hours trading.
- China's stimulus measures (which I believe have already been reflected in Bitcoin investments) continue to expand, beyond previous statements.
- The impact of the primaries on the market remains sticky; however, the results of 75 elections show a contrary and more severe perspective: link.
- Inflation hedging has unraveled from foundational measures (performing very strongly during the IRA bill passed by the Democrats) and has shifted towards Bitcoin and gold for a longer duration during Trump's term.
Overall, I believe that if Trump wins, the market will reach a higher level, while Harris (as another candidate) may not have received the attention it deserves, leading to an undervaluation. Therefore, even with the aforementioned risks, the expected value of the market can still be secured.
免责声明:本文章仅代表作者个人观点,不代表本平台的立场和观点。本文章仅供信息分享,不构成对任何人的任何投资建议。用户与作者之间的任何争议,与本平台无关。如网页中刊载的文章或图片涉及侵权,请提供相关的权利证明和身份证明发送邮件到support@aicoin.com,本平台相关工作人员将会进行核查。


