There is a saying in the market, "We have all become U.S. stock traders," because the cryptocurrency market not only closely follows the fluctuations of U.S. stocks but traders also need to keep an eye on U.S. economic data, among which the Federal Reserve's interest rates, CPI, and non-farm payrolls are the most important. But why should we pay attention to this data? What is the relationship between these data points? Below, the AICoin editor will provide answers, so please read the following carefully.
Federal Reserve Interest Rates
The Federal Reserve (the U.S. Federal Reserve System) is the central bank of the United States, and its main responsibility is to formulate and implement monetary policy to achieve stable economic growth. Generally, the Federal Reserve has three types of interest rate adjustment actions:
• Maintain interest rates unchanged: Market expectations are stable, and there is no significant impact on economic signals.
• Raise interest rates: To curb inflation, adopting a contractionary monetary policy.
• Lower interest rates: To stimulate the economy, adopting an expansionary monetary policy.
Typically, when we mention the Federal Reserve raising or lowering interest rates, we are actually referring to adjustments in the federal funds rate, which is the interest charged between banks for borrowing money.
Taking interest rate hikes as an example: When the Federal Reserve raises interest rates, it increases the federal funds rate, leading to higher borrowing costs between banks. Consequently, banks will control costs by increasing reserves (cash held by banks that can be used for immediate expenditures). The main method for increasing reserves is to raise deposit rates to attract people to deposit money in banks. At the same time, they will increase loan rates to suppress consumer and business loan demand, controlling the outflow of funds. The end result is that dollars flow into banks, reducing the amount of currency circulating in the market, thereby achieving the goal of curbing inflation.
When the Federal Reserve raises interest rates, it leads to an appreciation of the dollar (supply does not meet demand), resulting in more dollars flowing into banks, while the money flowing into the stock market and other investment markets decreases, which is negative.
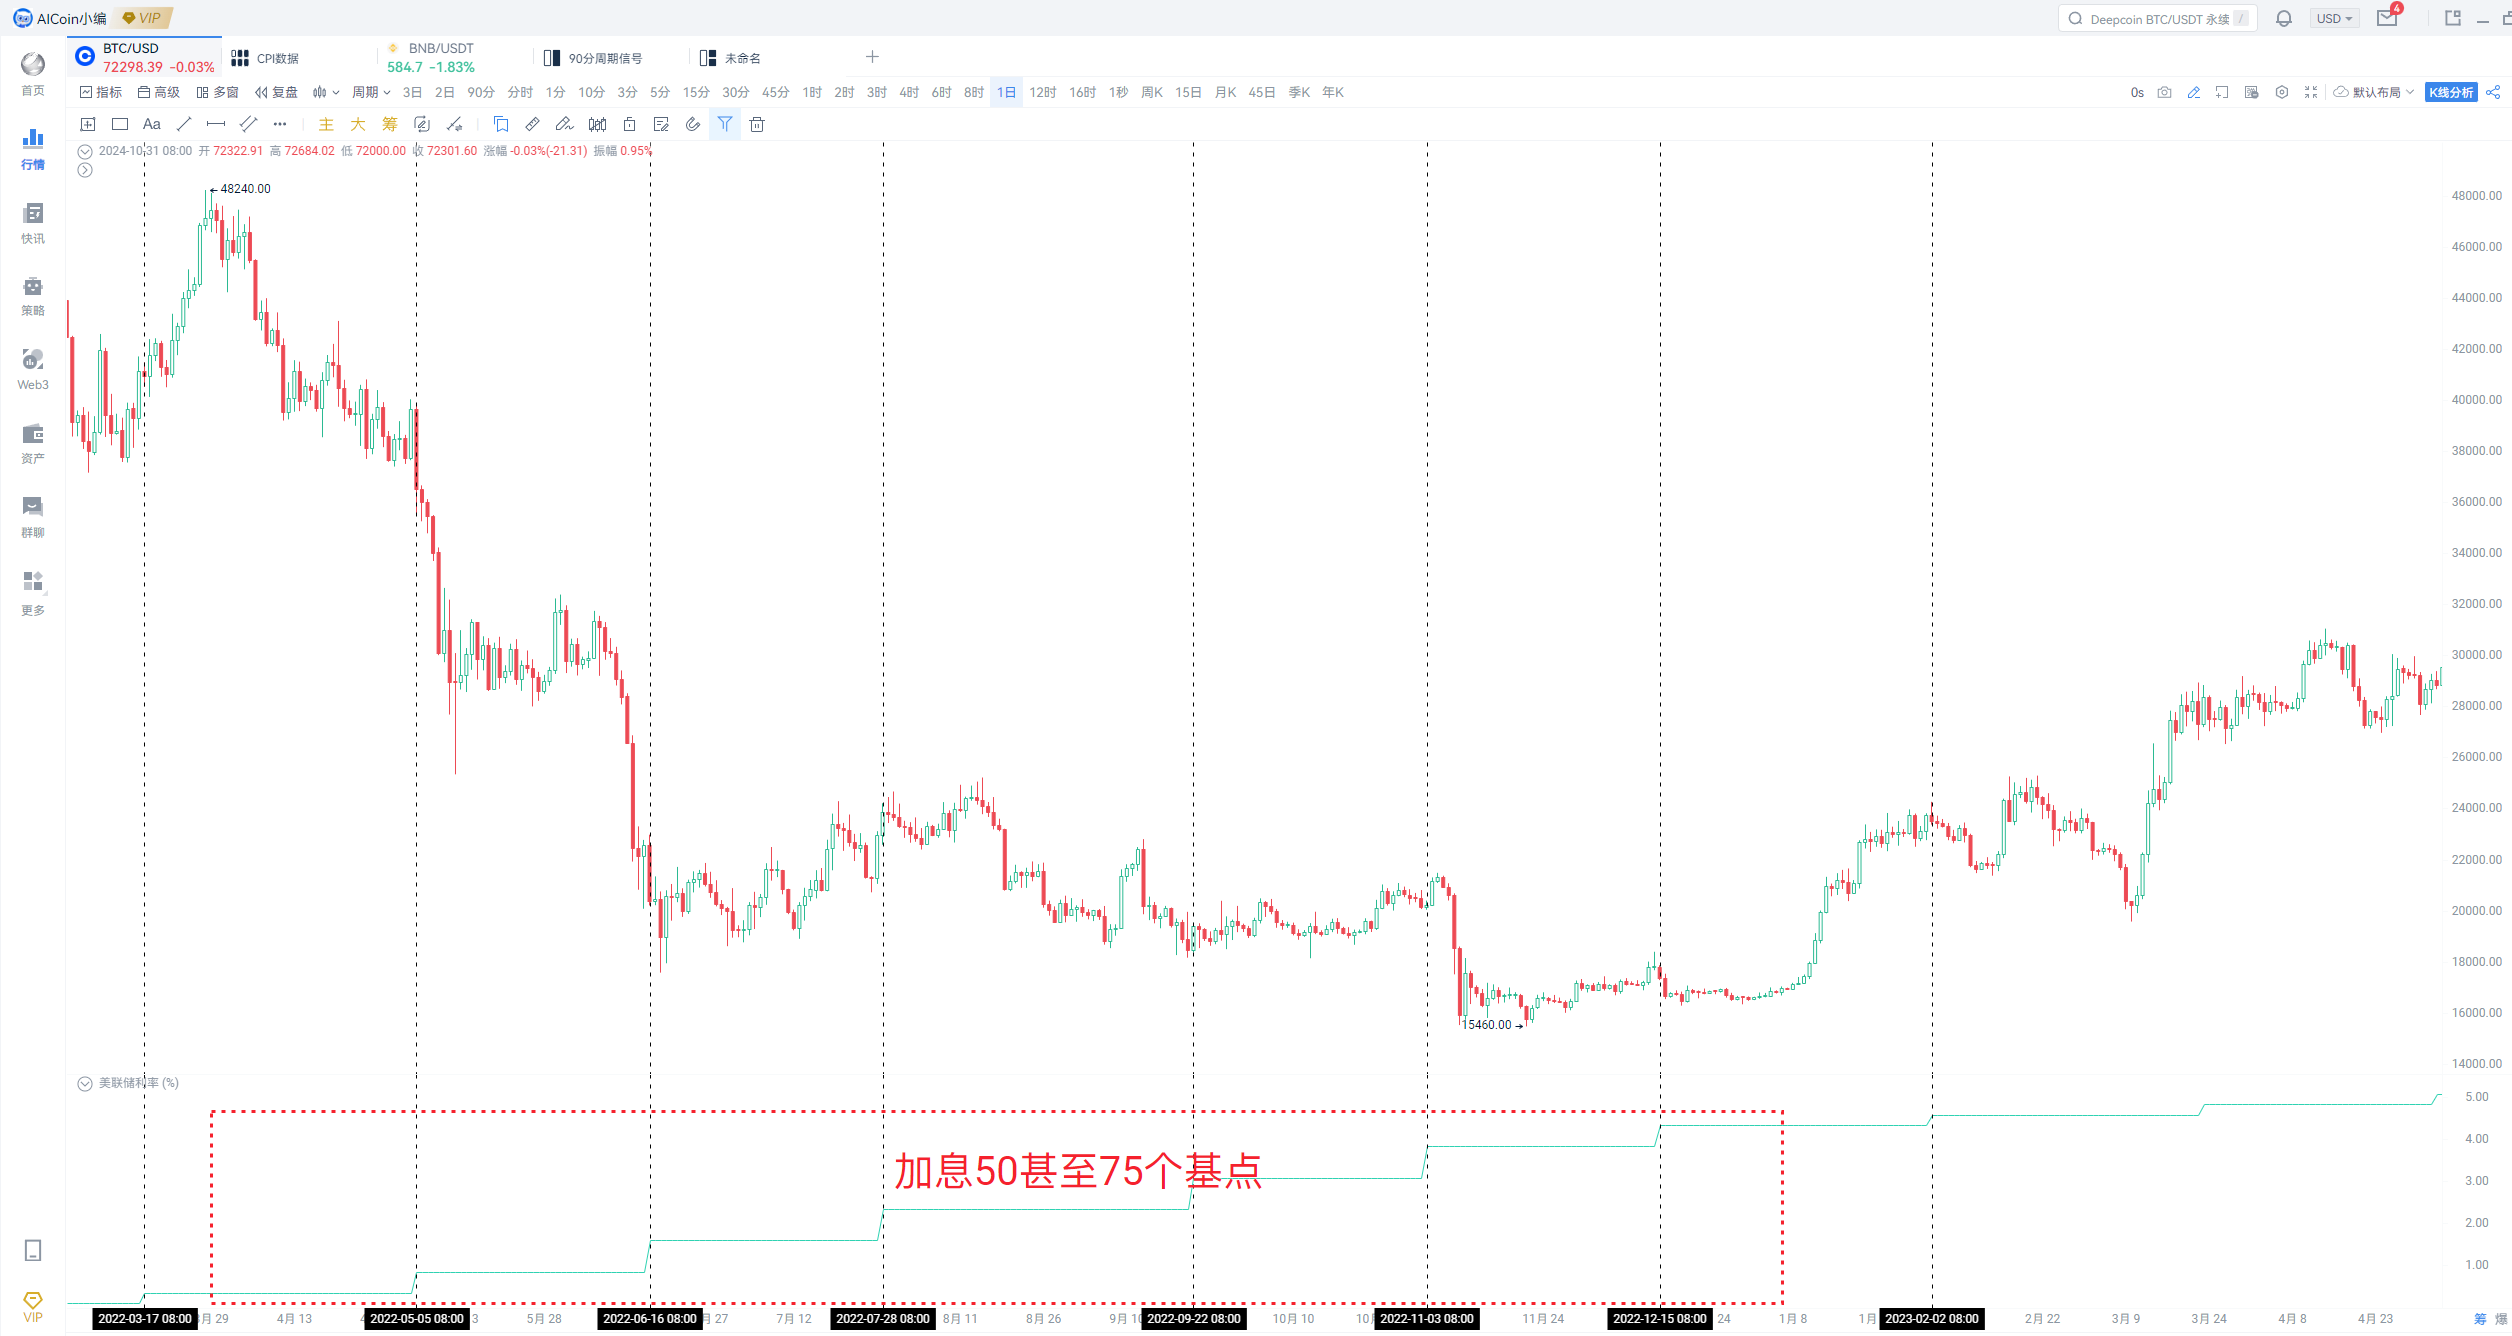
Similarly, when the Federal Reserve lowers interest rates (commonly referred to as "injecting liquidity"), the amount of circulating dollars increases, the dollar depreciates, and more funds flow into the stock market and other investment markets, which is positive.
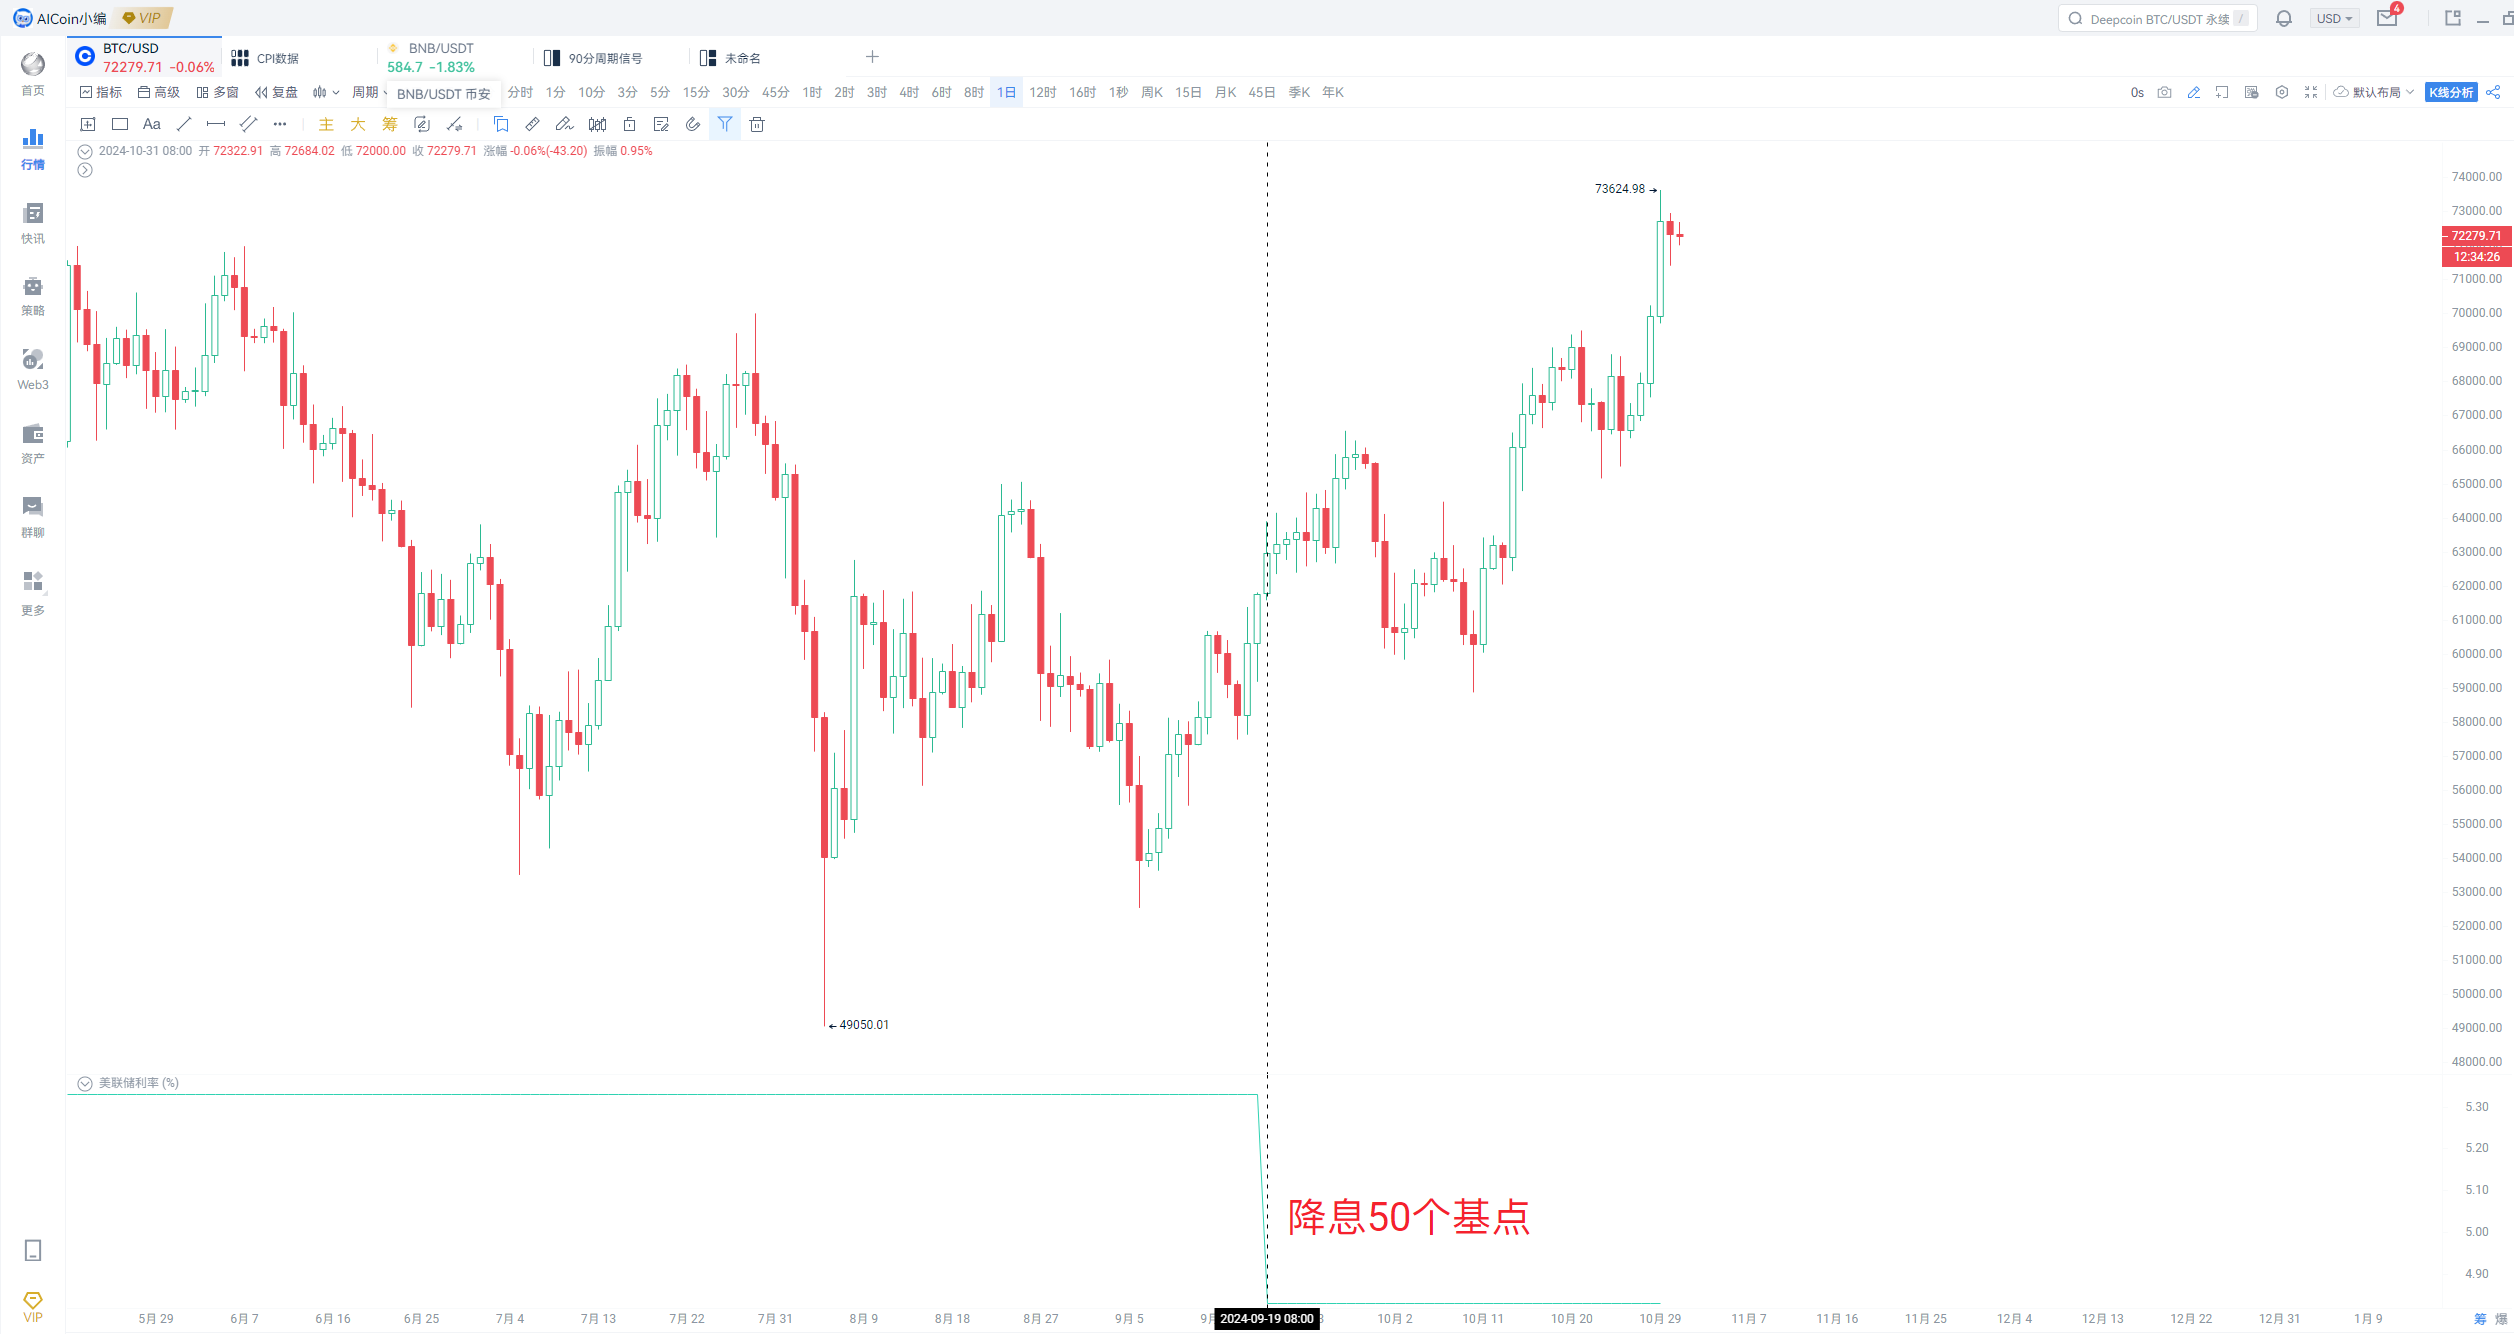
At this point, you may wonder: With so much economic data, why do we focus on non-farm payrolls and CPI?
Because the Federal Reserve's monetary policy goals include promoting full employment and maintaining price stability. To this end, the Federal Reserve closely monitors CPI data to assess inflation levels and non-farm employment data to understand the state of the job market. In other words, these two key data points influence the Federal Reserve's decisions.
U.S. Inflation Data
CPI (Consumer Price Index) is the U.S. consumer price index, also known as inflation data. Generally, excessively high inflation will prompt the Federal Reserve to raise interest rates to curb rising prices; conversely, low inflation or deflation will lead the Federal Reserve to lower interest rates to stimulate economic growth.
Inflation means that money is losing value, purchasing power is declining, and the same amount of money can buy fewer goods, simply understood as "money is not worth much." At this point, the Federal Reserve will raise interest rates to draw money back into banks, thereby cooling consumption and investment, which in turn curbs price increases. Conversely, the same logic applies to deflation.
In 2022, U.S. inflation rose to 7.0% and continued to increase, which was the main reason for the Federal Reserve's rate hikes of 50 basis points and even 75 basis points that year.
Through aggressive rate hikes, U.S. inflation has decreased and is steadily moving towards the Federal Reserve's 2% inflation target, prompting the Federal Reserve to end the rate hike cycle and shift its focus to employment data (the market was very focused on non-farm data in August and September, even paying attention to initial jobless claims).
Non-Farm Data
The core data of the U.S. non-farm employment report includes the unemployment rate, non-farm payrolls, and the employment-to-population ratio, with the highest market attention on the unemployment rate and non-farm payrolls.
Unemployment Rate: The proportion of unemployed individuals in the total labor force, which is a measure of the health of the labor market. Typically, an unemployment rate below 4% is considered an ideal level.
Non-Farm Payrolls: Refers to the number of new jobs added in industries outside of agriculture, serving as an indicator of labor market strength.
Generally, when we say the "labor market is strong," it mainly refers to a significant increase in non-farm payrolls while the unemployment rate remains stable or decreases; conversely, a "weak labor market" is characterized by a decrease or sluggish growth in non-farm payrolls while the unemployment rate rises. The former will prompt the Federal Reserve to raise interest rates, while the latter will lead to rate cuts for the following reasons:
• Strong non-farm data and low unemployment rate: This indicates an increase in employment, which is linked to wages. With jobs come wages, and with wages comes purchasing power. An increase in consumer demand can lead to inflationary pressures, prompting the Federal Reserve to raise interest rates to prevent the economy from overheating and to control inflation.
• Weak non-farm data and rising unemployment rate: This indicates a decrease in disposable income for consumers, which can slow economic growth (consumption is the main driver of economic growth). This will prompt the Federal Reserve to lower interest rates, putting money back into consumers' pockets to stimulate economic activity.
Therefore, in terms of the labor market, the ideal situation is a declining unemployment rate alongside increasing non-farm payrolls, which is positive; the least ideal situation is a rising unemployment rate alongside decreasing non-farm payrolls, indicating a weak labor market, which is negative.
Market Performance
This year, there has been a significant phenomenon of anticipatory trading. Taking the most recent six months of non-farm data as an example, even when the data is positive, the market still rises first and then falls (the market rises before the data is released and falls afterward).
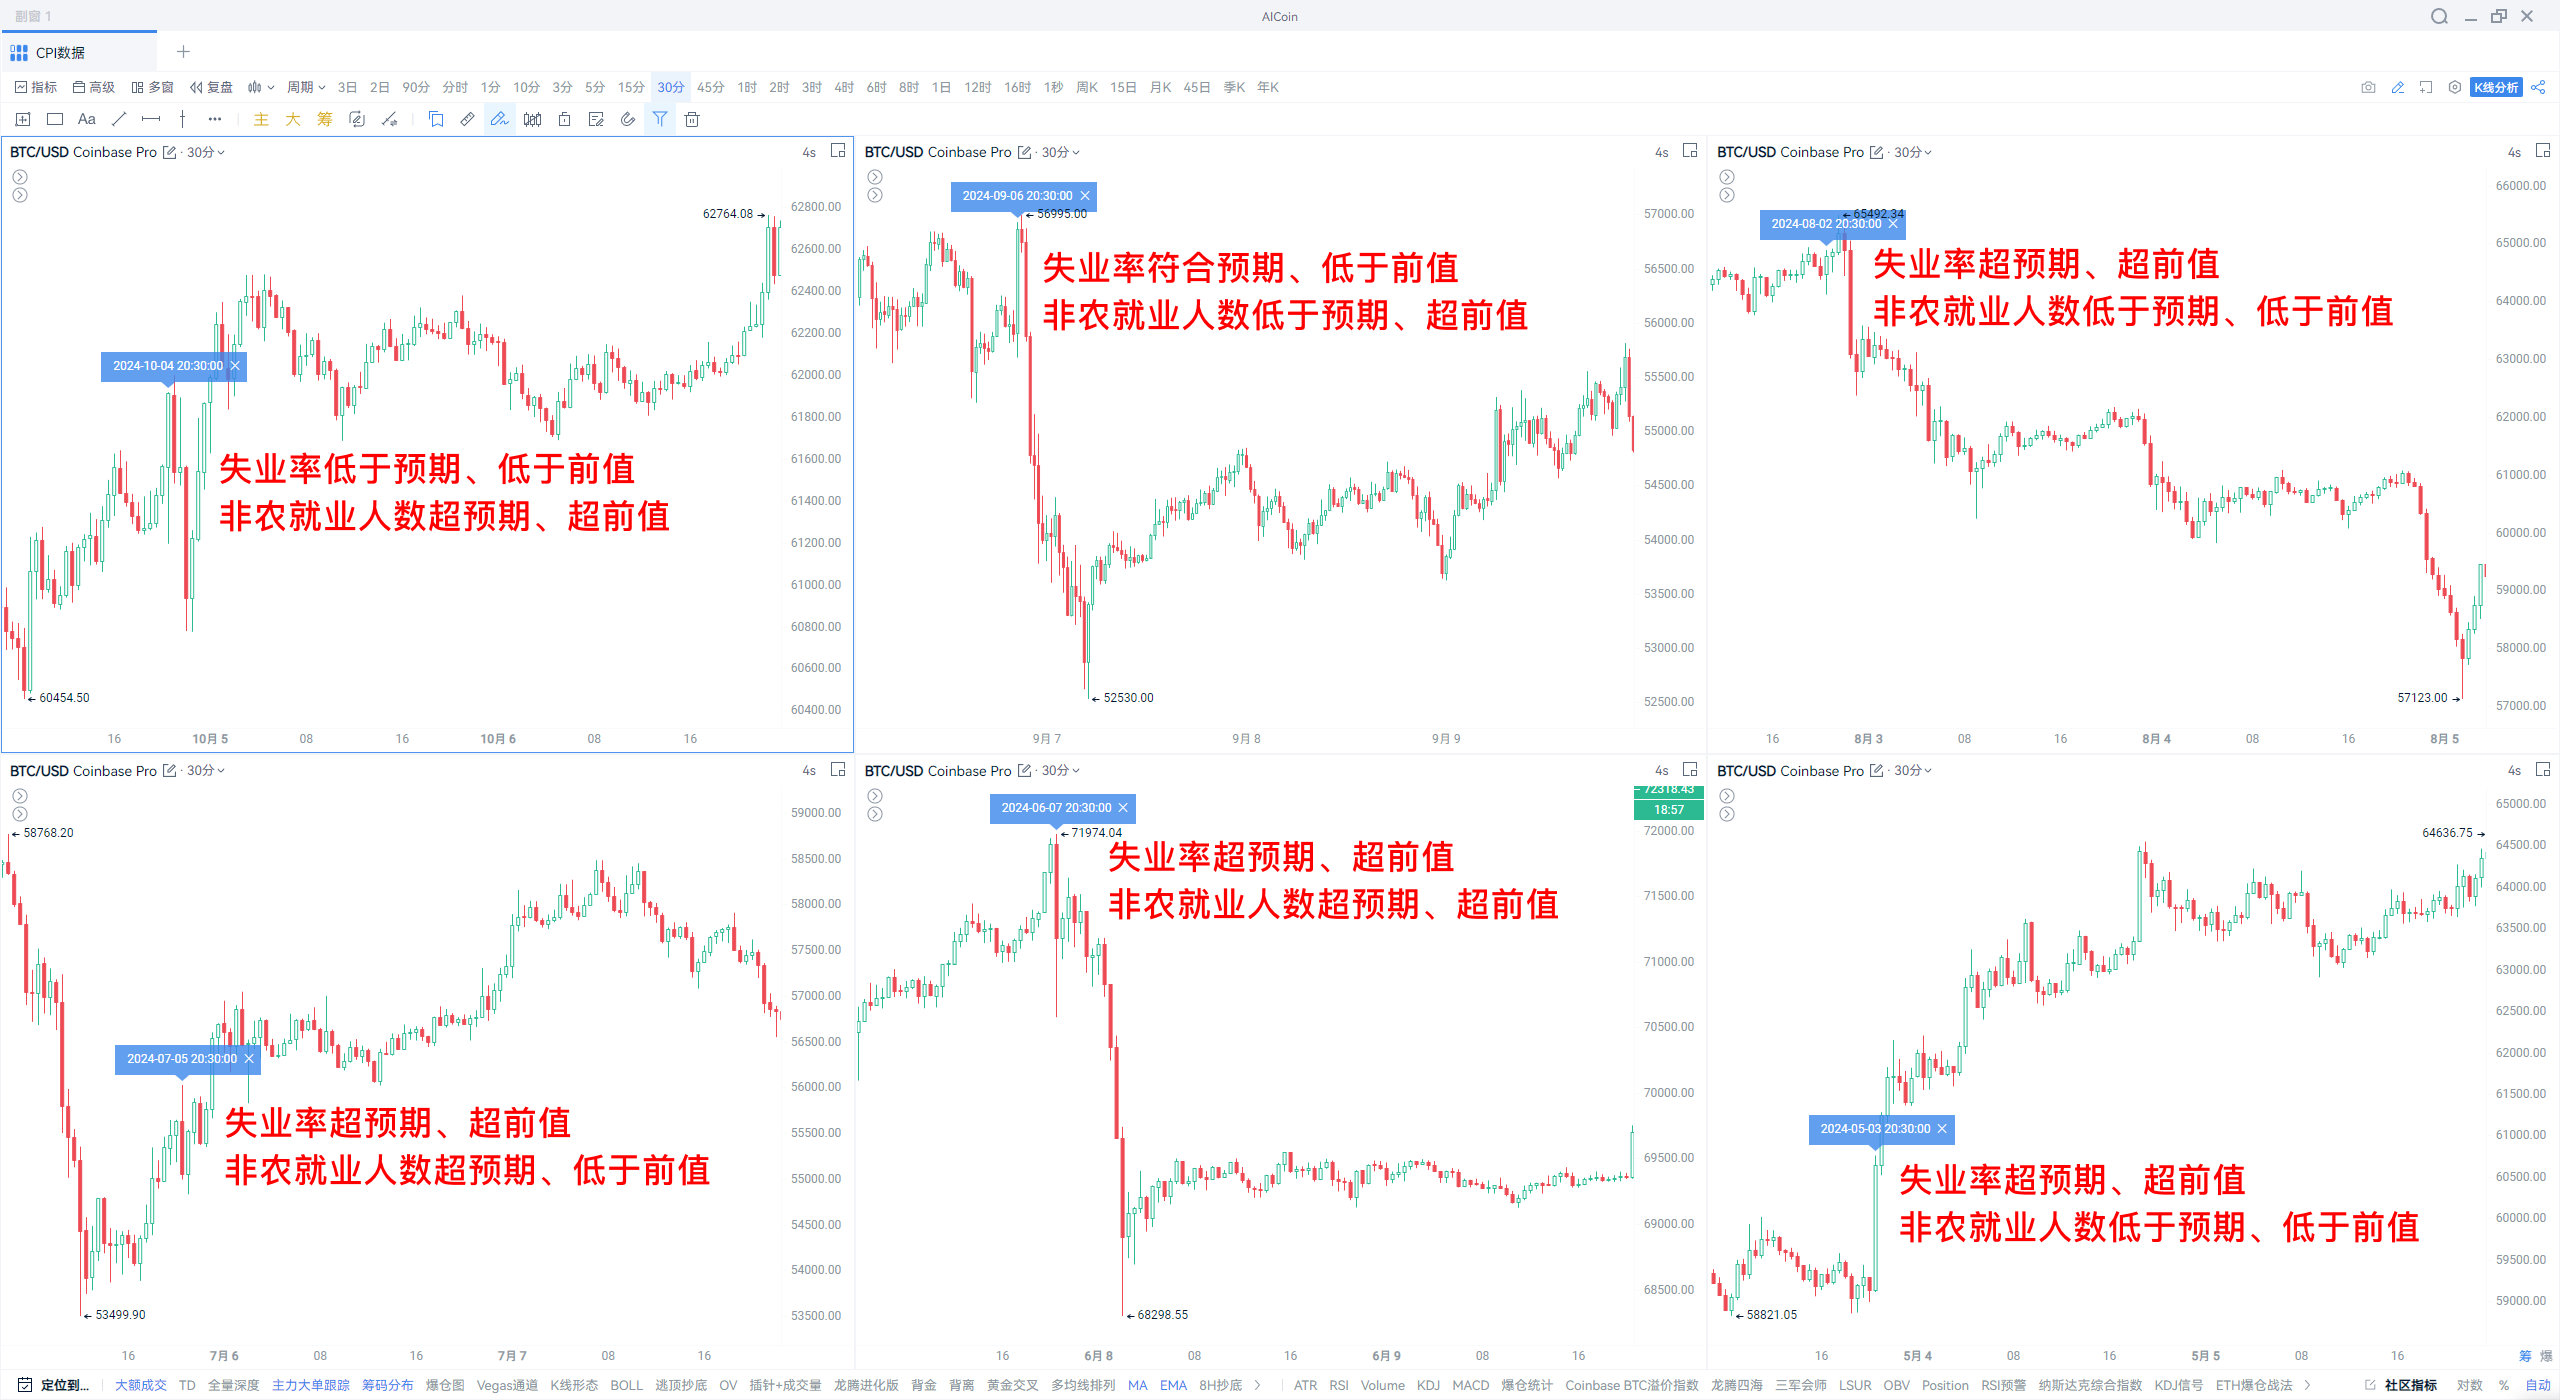
Note: Using the multi-window and positioning functions can quickly compare the market trends during previous macro data releases: https://www.aicoin.com/vip
Therefore, when trading, it is necessary to prepare for both scenarios and utilize the following tools:
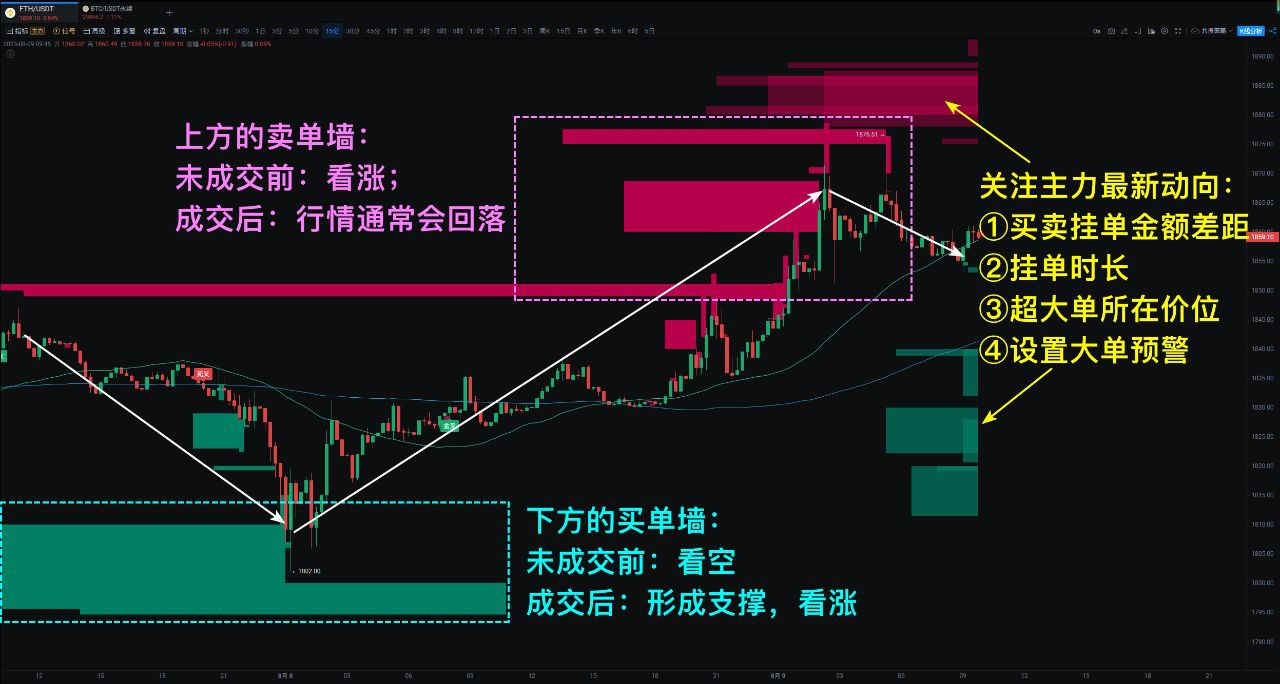
1. Large Orders: Pay attention to the points where large investors are betting, focusing on large orders that have been placed for a long time and involve significant amounts. Specific usage is as follows:
① Buy Orders: Bearish before execution (buy orders are below the current price, and the price must fall to execute), bullish after execution (executed buy orders will form support);
② Sell Orders: Bullish before execution (sell orders are above the current price, and the price must rise to execute), bearish after execution (executed sell orders will form pressure).
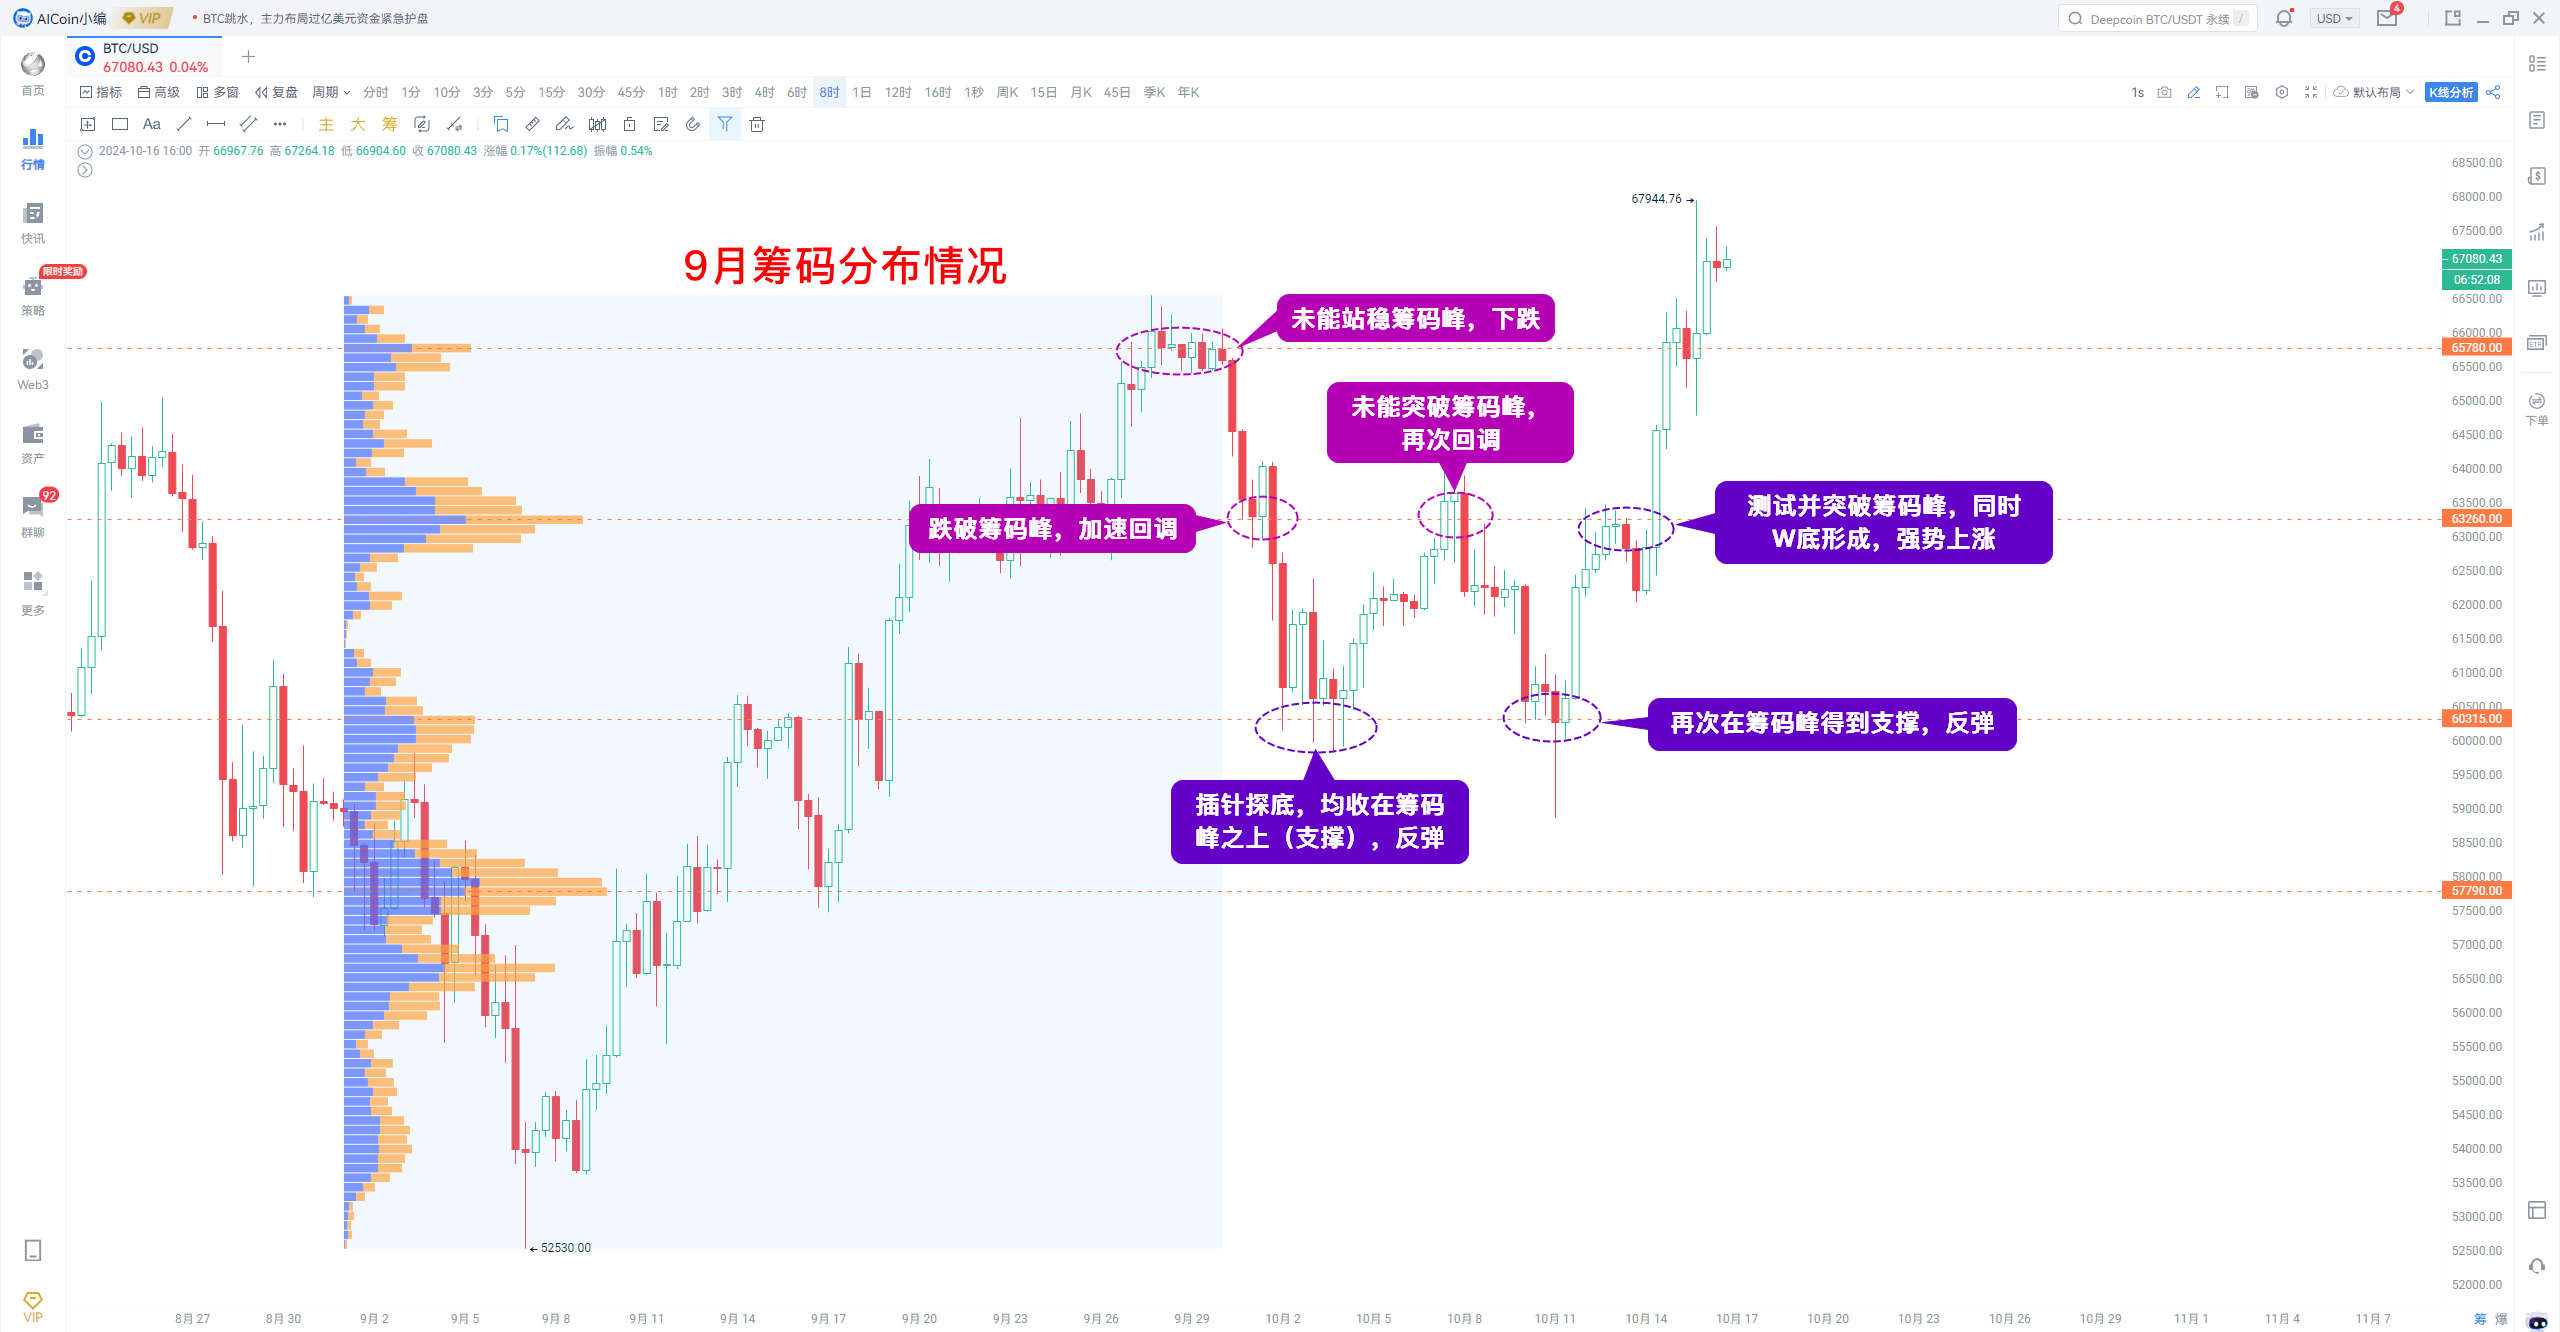
2. Chip Peaks: Mainly used to identify support and resistance. If the price moves sharply in the short term but does not break the chip peak, it may indicate a reversal opportunity. Specific usage is as follows:
① Support Level: Located below the price; if the support level holds, the price will rebound; if it breaks, the market will accelerate downward;
② Resistance Level: Located above the price; if the resistance level holds, the price will pull back; if it breaks, the price will accelerate upward.
3. Moving Averages: Such as MA and EMA moving averages.
Usage 1: Break above the moving average, bullish; break below the moving average, bearish.
Usage 2: If the price approaches but does not break the moving average, it will pull back; if it approaches but does not break the moving average from below, it will rebound.
Usage 3: Use two moving averages together; a golden cross is bullish, a death cross is bearish.
Usage 4: Multiple moving averages arranged; a bullish arrangement is bullish; a bearish arrangement is bearish.
For specifics, see: “Moving Average Game: The Transformation from K-Line to Wealth”
The above content is for sharing purposes only and does not constitute any investment advice. If you have any questions, feel free to contact the AICoin editor~
免责声明:本文章仅代表作者个人观点,不代表本平台的立场和观点。本文章仅供信息分享,不构成对任何人的任何投资建议。用户与作者之间的任何争议,与本平台无关。如网页中刊载的文章或图片涉及侵权,请提供相关的权利证明和身份证明发送邮件到support@aicoin.com,本平台相关工作人员将会进行核查。


