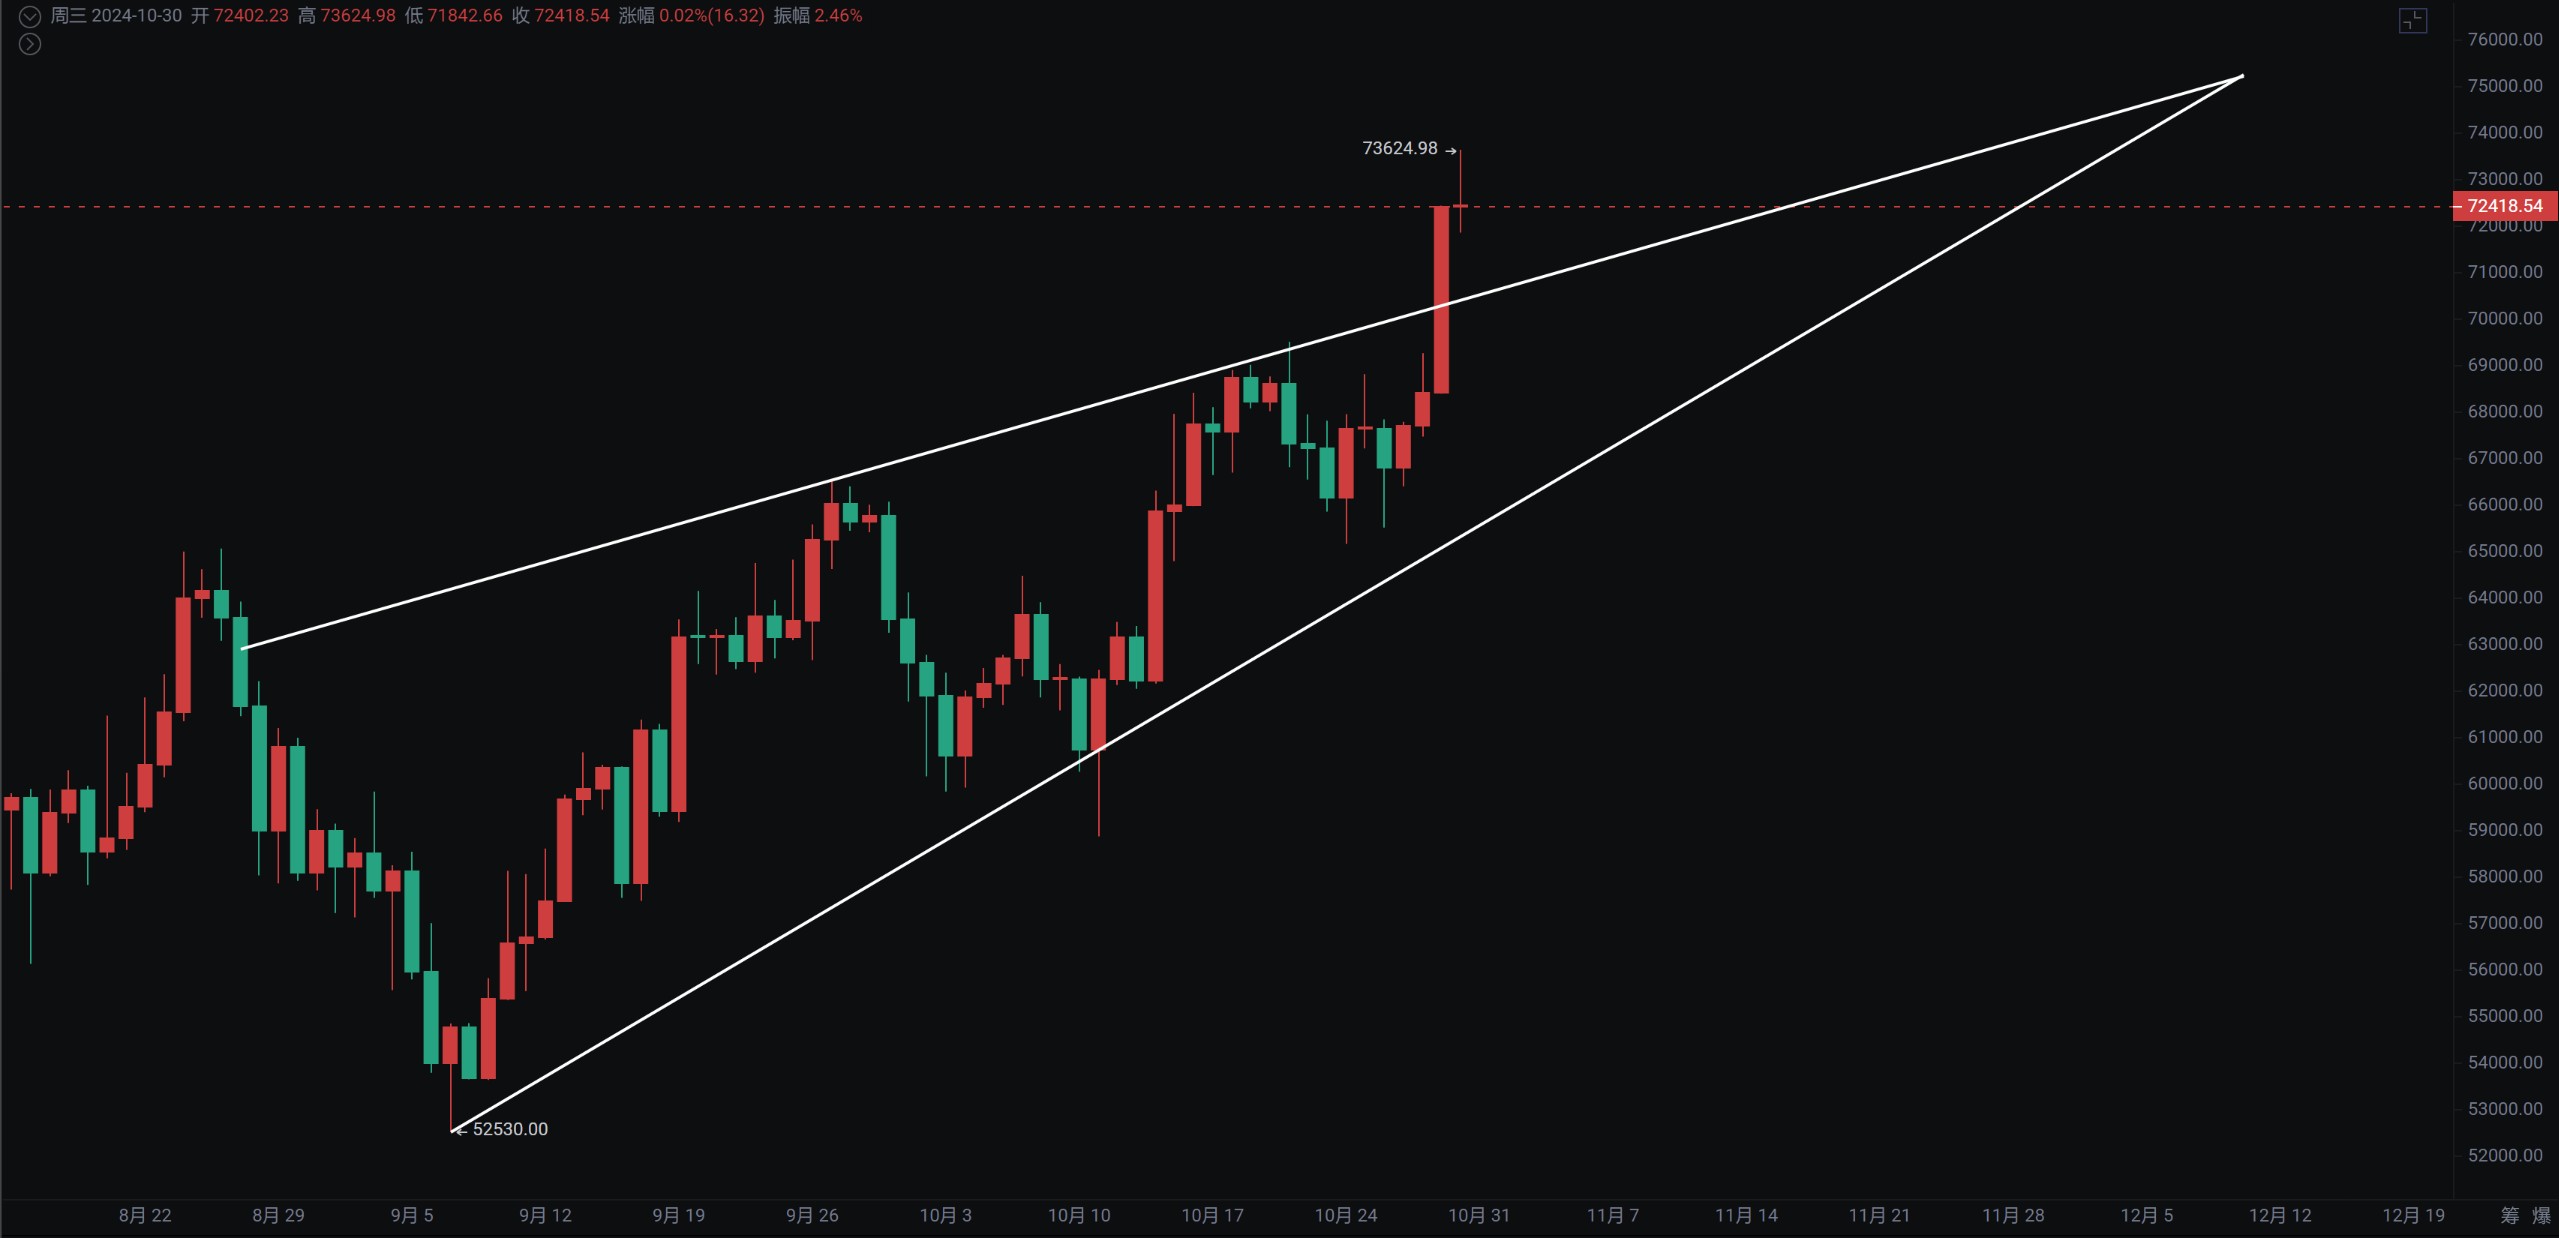
Last night, Bitcoin's price reached a high of 73620, just 1-200 points away from the March peak. Yesterday's bullish candle also showed some volume, indicating capital inflow. Now it's a crucial moment—will it break through directly, or will it need to pull back before breaking through?
The weekly cup and handle pattern has been in play since we alerted on March 15, and it has actually broken out as of the time of this writing, but it has yet to solidify this week and is currently just below the previous high. The next few days are very critical.
Bitcoin
After the weekly chart stood above the BOLL middle band, last week formed a bullish engulfing pattern, which is a continuation pattern. The weekly chart has also formed a duck bill shape. Those who have positions from the previous lows should not easily discard their chips, while those who haven't entered can only wait for a pullback. Move the stop-loss position up to 70888.
On the daily chart, it is currently forming an ascending triangle within an upward flag pattern. In the future, it should not fall back into the triangle, with the upper price around 70888. Technical indicators are consistently bullish. Hold onto low-priced chips around 60000, and those who haven't entered can only consider short-term pullbacks or a breakthrough followed by a retest that does not break.
Support: Pressure:

Ethereum
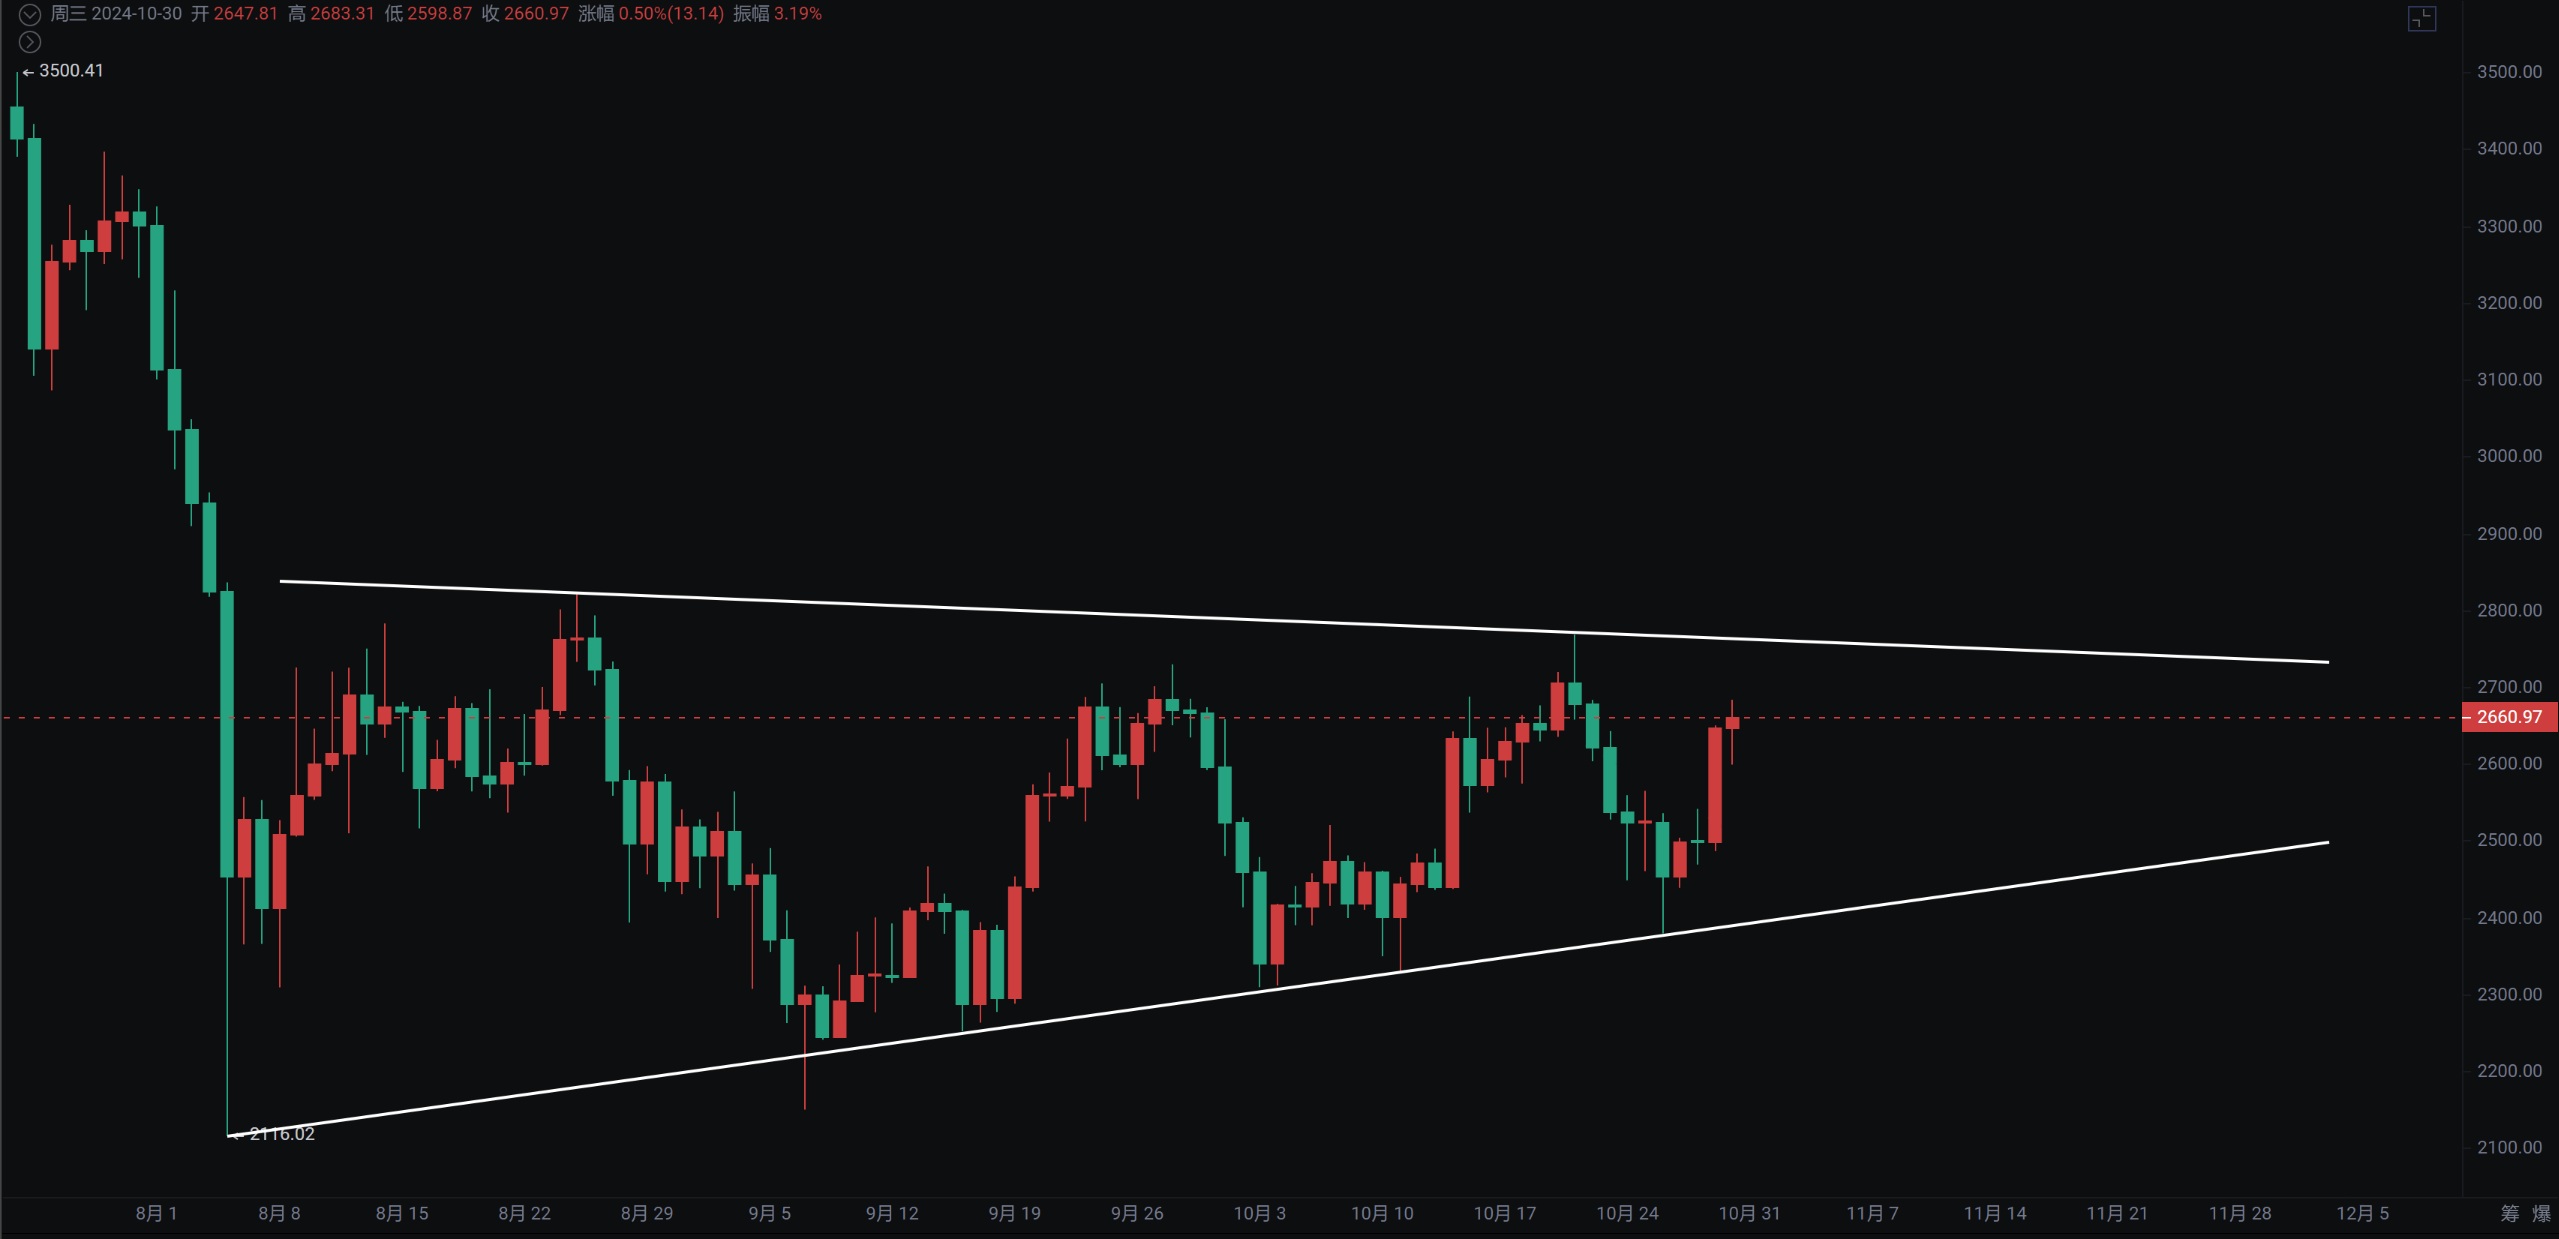
The weekly chart continues to oscillate. It is worth noting that if it can break 2769 this week, it will form a bullish signal with a double bullish candle sandwiching a bearish one, providing an opportunity to break through the 2800 line, which is the bull-bear boundary for ETH. The weekly MACD is also showing a continuously shortening histogram with the fast and slow lines crossing below.
On the daily chart, as previously mentioned, it is oscillating within a converging triangle. It broke out again yesterday and is currently in a phase of catching up. The 3-day line will be quite evident. A false breakdown followed by a continuation of the breakout would be a strong performance. The MACD is also showing a bottom divergence, and the 4-hour downtrend line has been broken, as previously noted. If Bitcoin cannot directly break through the previous high, it is not recommended to chase Ethereum directly; wait for a pullback to set up an opportunity.
Support: Pressure:

If you like my views, please like, comment, and share. Let's navigate through the bull and bear markets together!!!
This article is time-sensitive and for reference only; it is updated in real-time.
Focusing on K-line technical research, sharing global investment opportunities. Public account: Trading Prince Fusu

免责声明:本文章仅代表作者个人观点,不代表本平台的立场和观点。本文章仅供信息分享,不构成对任何人的任何投资建议。用户与作者之间的任何争议,与本平台无关。如网页中刊载的文章或图片涉及侵权,请提供相关的权利证明和身份证明发送邮件到support@aicoin.com,本平台相关工作人员将会进行核查。


