Technical Key Points Explanation:
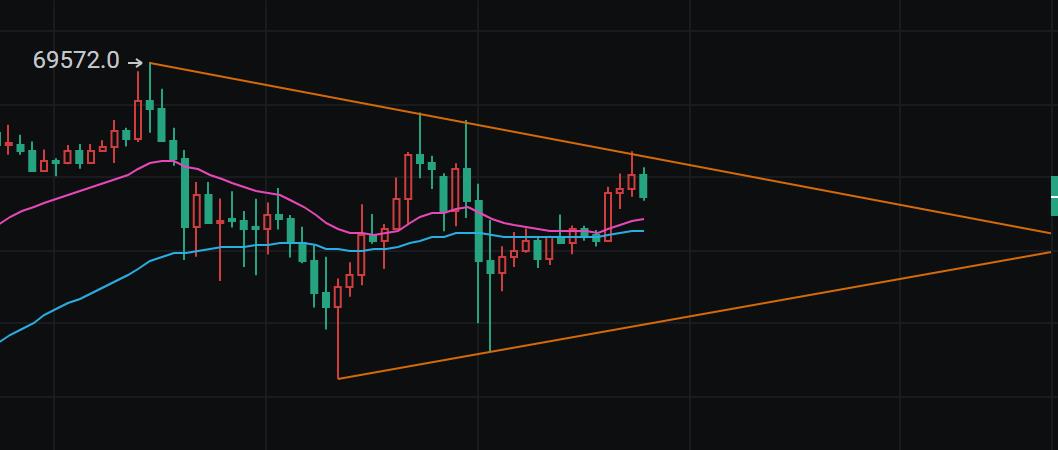
The recent trend has been relatively simple, with clear support and resistance levels. The support and resistance levels for Bitcoin provided in previous analyses have been reached, with a bearish outlook around 68500 and a bullish outlook around 67000, both offering good potential. You can refer to historical analysis for more insights. Overall, it is moving within a range for consolidation. From a daily perspective, it is building momentum within a triangular area to find the next breakout point.
The upper resistance levels are at 68500 and 68800, while the lower support levels are at 67000 and 66500. After multiple tests and consolidation this week, we are waiting for a breakout trend.
On the 4-hour chart, the highs are moving down while the lows are moving up, indicating a clear range-bound oscillation pattern. We will continue to respond with oscillating movements throughout the day.
For Bitcoin, it is recommended to short around 68300-68500, with a stop loss at 68900 and a target of 67300-67000;
For the lower range around 67200-67000, it is recommended to go long, with a stop loss at 66600 and a target of 68200-68500;
A follow-up video explanation will be updated, covering trend analysis and response positions, as well as sharing key technical patterns. Remember to stay tuned!
免责声明:本文章仅代表作者个人观点,不代表本平台的立场和观点。本文章仅供信息分享,不构成对任何人的任何投资建议。用户与作者之间的任何争议,与本平台无关。如网页中刊载的文章或图片涉及侵权,请提供相关的权利证明和身份证明发送邮件到support@aicoin.com,本平台相关工作人员将会进行核查。


