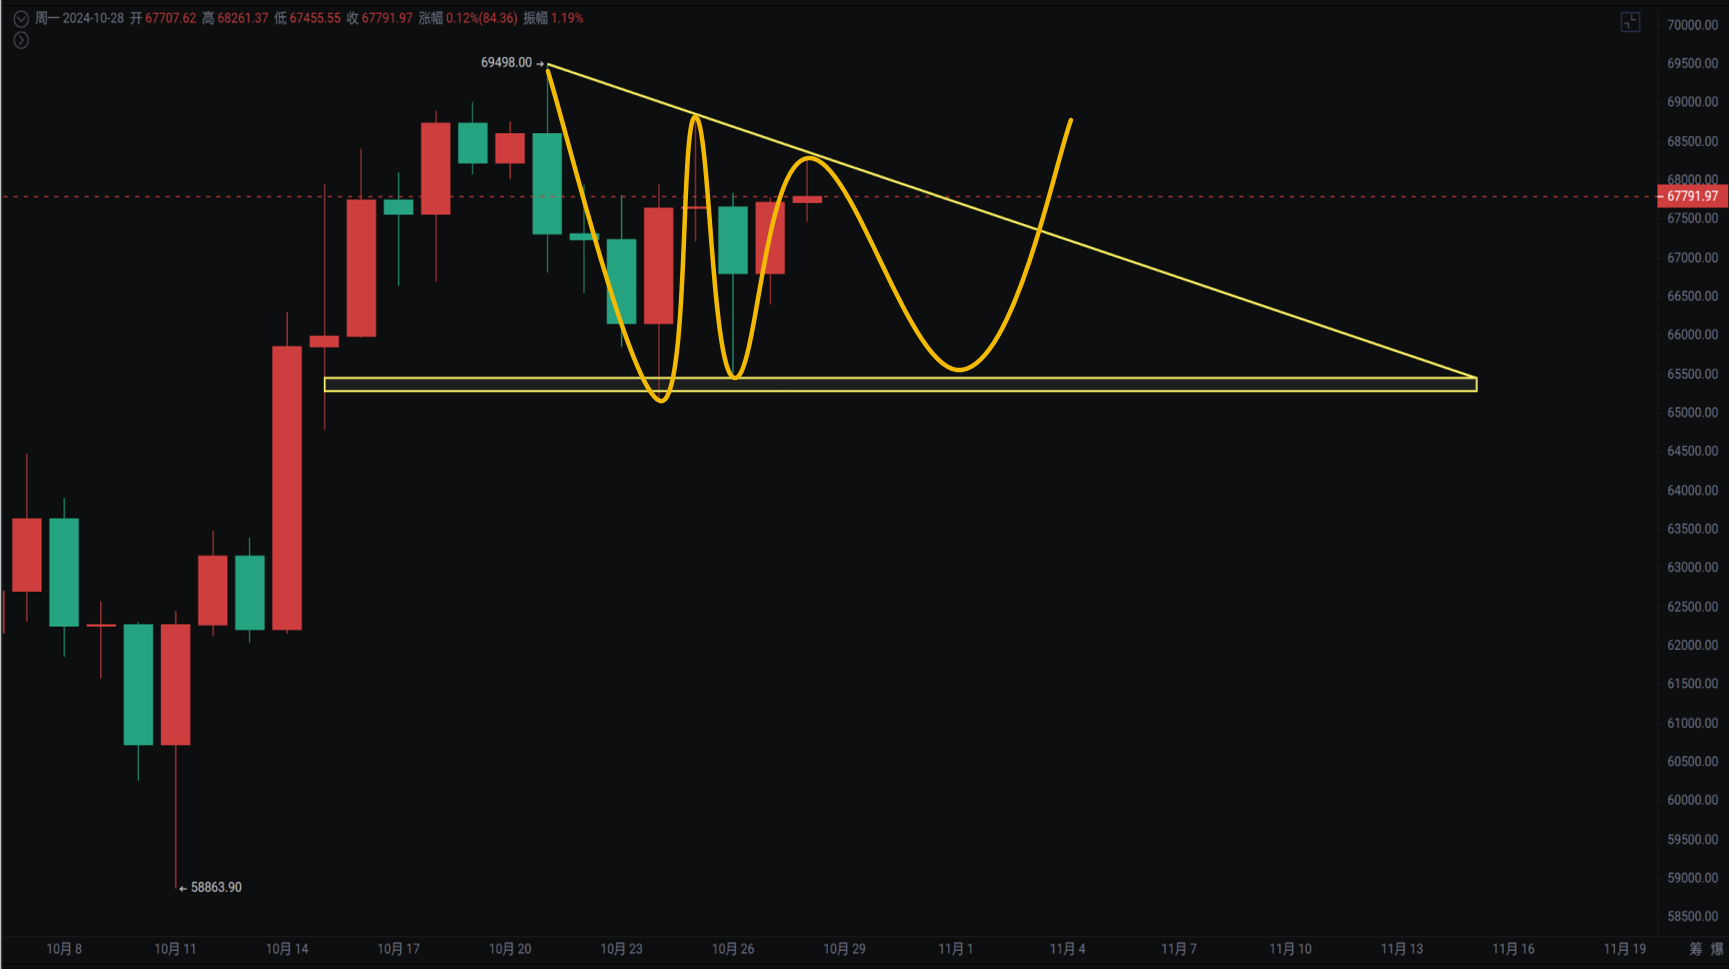
The weekly closing shows a bullish engulfing pattern. After a downward spike to 65260 last week, it rebounded and is currently fluctuating around 68000 at the time of writing. The monthly closing is approaching, and it has been the only two consecutive months of gains in a high position over the past six months. The key point is whether this can continue into next month. At the end of this month and the beginning of next month, the market will experience significant fluctuations around the monthly closing, so everyone should pay attention.
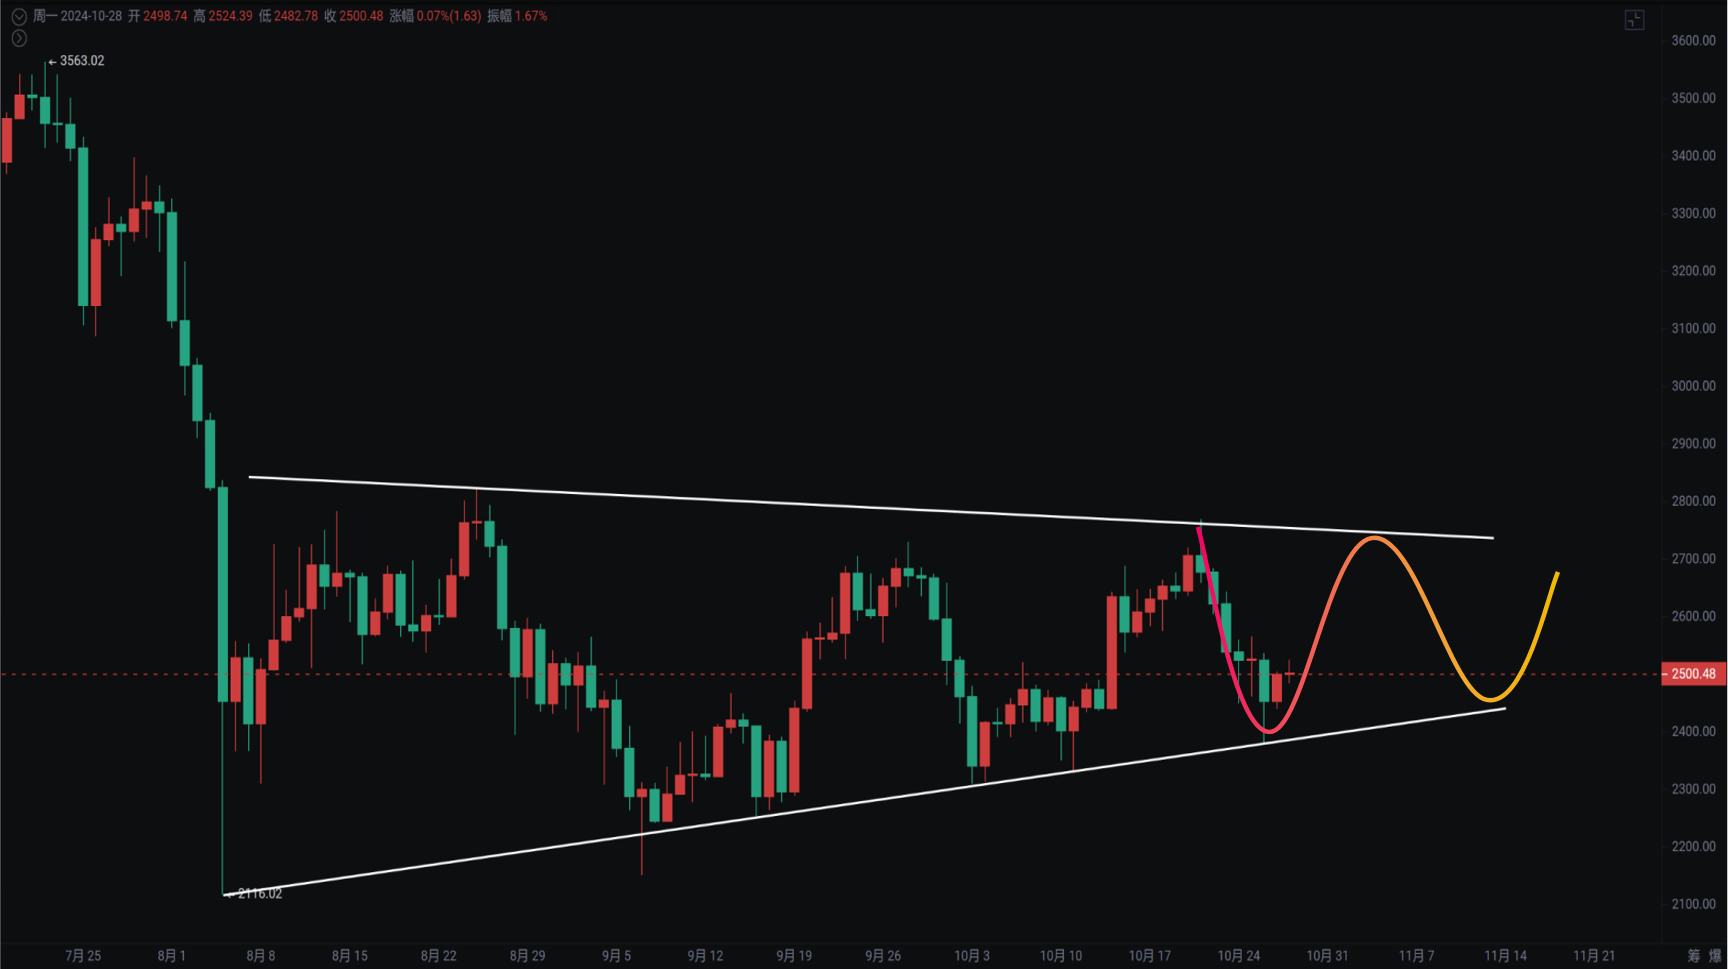
From the naked candlestick perspective, Ethereum looks quite poor. Firstly, the monthly line has broken the key support at 2800 with a large bearish candle, followed by two doji candles, indicating weak rebound strength. The weekly line is also performing poorly as the exchange rate continues to hit new lows, and the daily line is still observing a converging triangle for a potential reversal. The impact of the U.S. elections in early November may also cause notable fluctuations in the market, so we should just wait for the results.
Bitcoin
The daily pressure remains quite significant, mainly constrained by the 69500—70400 range. The daily line has also formed a triangular structure with support at 65260, and we will continue to observe for fluctuations.
The 4-hour chart shows a clear downward trend line pressure from 69500. In the short term, we are waiting for a pullback to add positions, and the market still needs to experience short-term fluctuations before choosing a direction.
Support: Resistance:
Ethereum
After a second downward spike to 2382, Ethereum has shown a bullish divergence and rebounded, currently around 2500. The 4-hour downward trend line has been broken, but it still needs to adjust repeatedly in the short term to see if it can continue the converging triangle fluctuations.
From the weekly perspective, the ETH/BTC exchange rate has not yet reached the bottom. The time frame for a significant bottoming rebound may be at least by the end of this year or early next year, and altcoins may also experience a general upward trend.
Support: Resistance:
If you like my views, please like, comment, and share. Let's navigate through the bull and bear markets together!!!
This article is time-sensitive and for reference only, with real-time updates.
Focusing on candlestick technical research, sharing global investment opportunities. Official account: Trading Prince Fusu

免责声明:本文章仅代表作者个人观点,不代表本平台的立场和观点。本文章仅供信息分享,不构成对任何人的任何投资建议。用户与作者之间的任何争议,与本平台无关。如网页中刊载的文章或图片涉及侵权,请提供相关的权利证明和身份证明发送邮件到support@aicoin.com,本平台相关工作人员将会进行核查。