Bitcoin surged to $68,771 on the 25th, successfully hitting near the profit-taking zone of the big player, but then suddenly plummeted, dropping to a low of $65,596.29 early on the 26th. However, it quickly rebounded above $66,000, and over the weekend, it continued to oscillate between $66,600 and $67,400. As of the time of writing, the price is quoted at $68,207, up 1.66% in the last 24 hours.
Bitcoin 4-Hour Chart
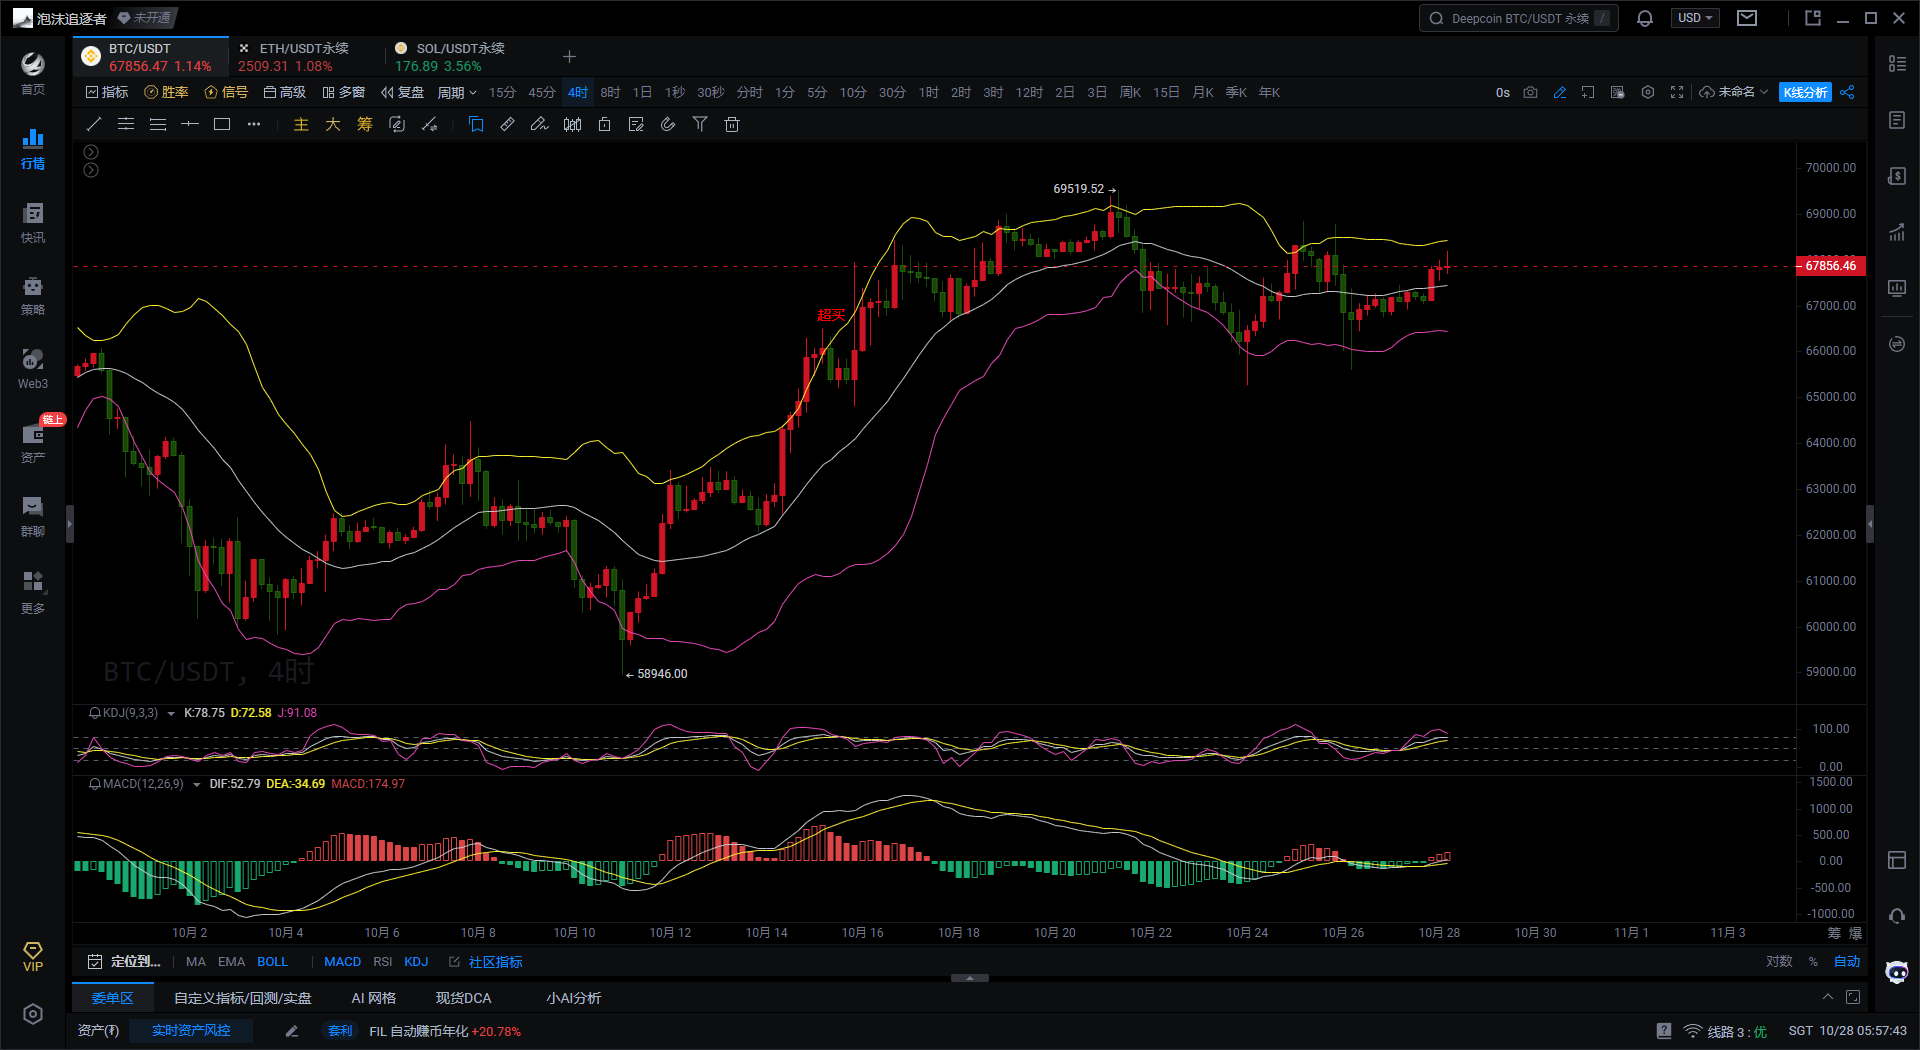
First, according to the Bollinger Bands indicator on the 4H chart, Bitcoin's price is approaching the upper band but has not broken through, indicating that the price is in an overbought state. If the price continues to break upwards along the upper band, there may be a further upward trend. However, if the price fails to effectively break through the upper band, it may pull back towards the middle band.
Second, based on the KDJ indicator on the 4H chart, both the K and D values are in the overbought area, with the J value in a severely overbought zone, suggesting a potential pullback in the short term. If the KDJ forms a death cross signal in the high overbought area, it indicates a short-term peak, increasing the likelihood of a downward pullback.
Finally, according to the MACD indicator on the 4H chart, both the DIF and DEA lines are currently running near the 0 axis, and the DIF line has slightly crossed above the DEA line, forming a golden cross state, indicating a potential upward trend in the short term. The MACD histogram has turned from green to red, showing a weakening of bearish momentum and a further strengthening of bullish momentum.
Bitcoin 1-Hour Chart
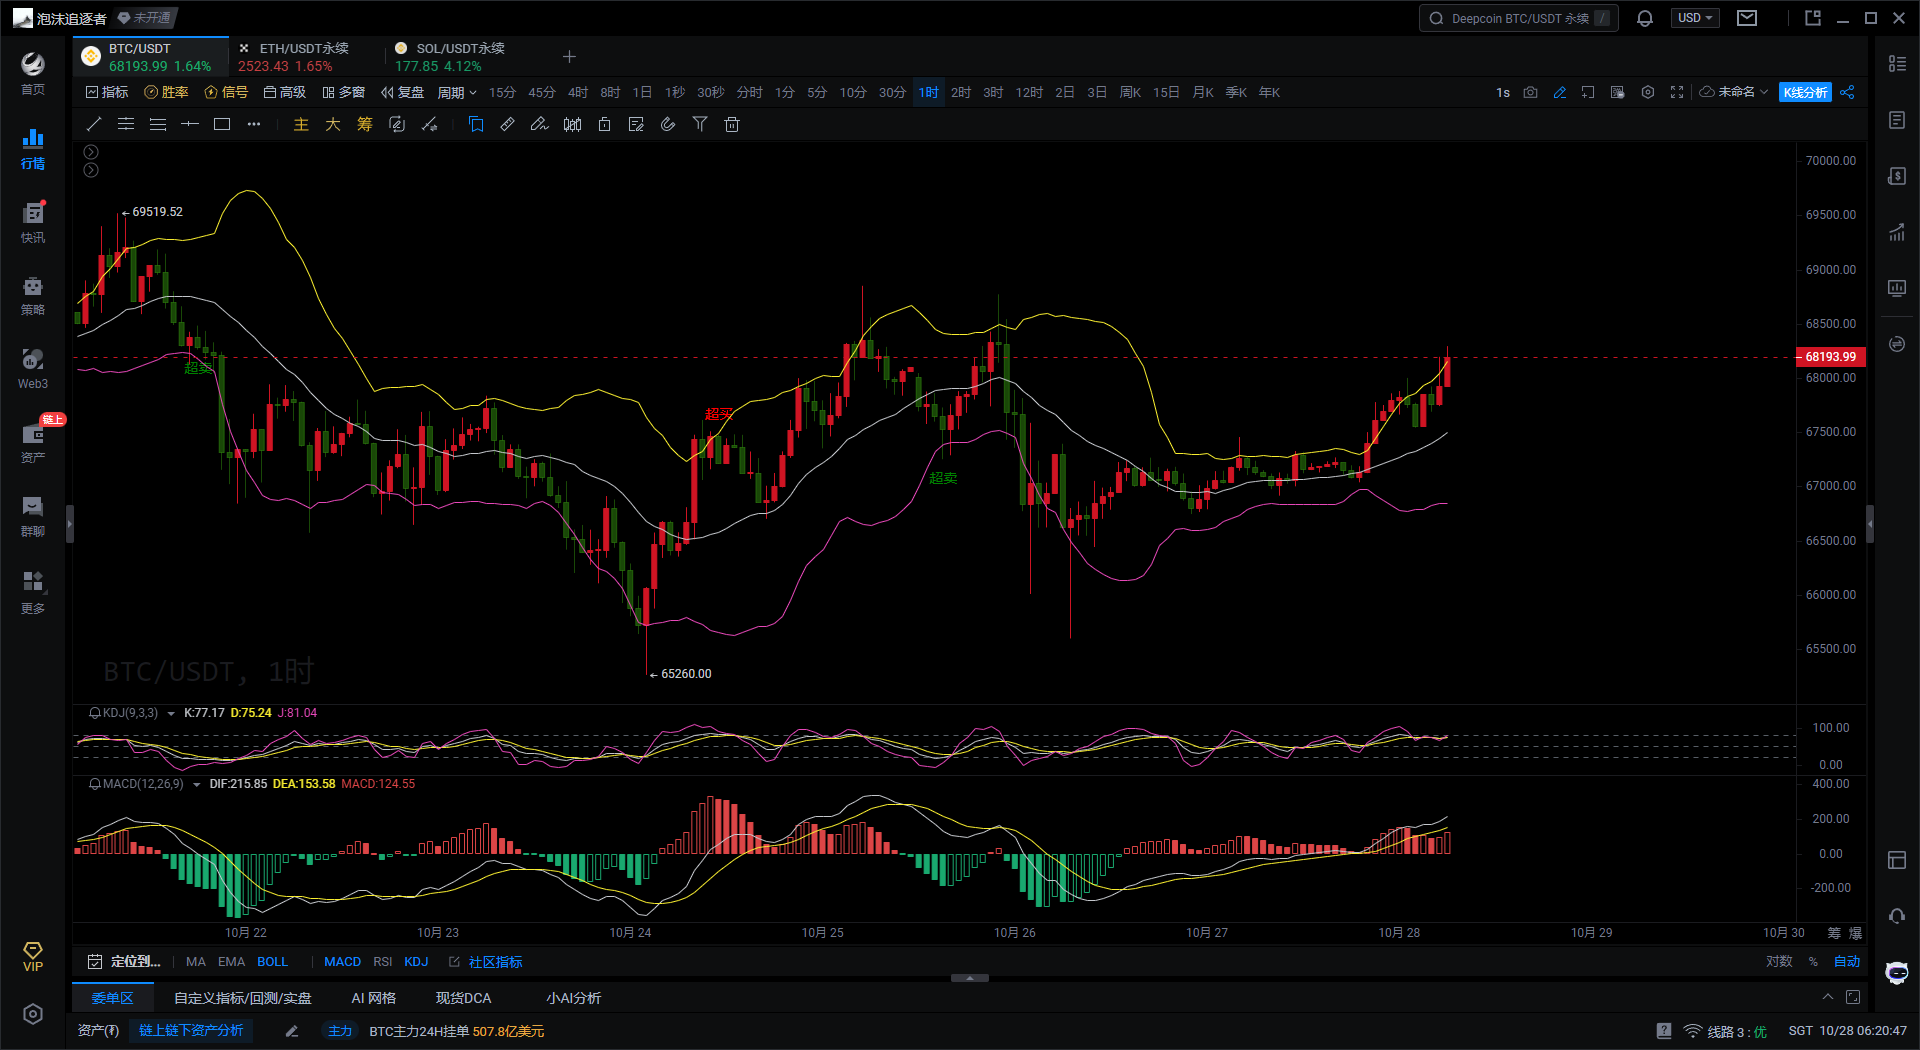
First, according to the Bollinger Bands indicator on the 1H chart, Bitcoin's price has broken through the upper band and is oscillating near it. The price running above the upper band indicates strong bullish strength, but it also comes with the risk of being overbought. If the price continues to oscillate near the upper Bollinger Band, there may be a continuation of the upward trend in the short term.
Second, based on the KDJ indicator on the 1H chart, both the K and D values are above 80, in a severely overbought area. If the KDJ forms a death cross signal while at a high level, a pullback may occur in the short term. If the KDJ indicator continues to oscillate at a high level, the upward trend may be maintained in the short term.
Finally, according to the MACD indicator on the 1H chart, the DIF and DEA lines are running above the 0 axis, and the DIF line has crossed above the DEA line, forming a golden cross signal. The MACD red histogram is also gradually increasing, indicating strong bullish momentum at present. If the MACD red histogram continues to grow, the market may continue to push prices higher.
In summary, the 4-hour chart shows that Bitcoin displays a certain upward trend, but due to the presence of overbought signals in various indicators, a pullback may occur in the short term. If the price can stabilize at the middle Bollinger Band and rebound, while the MACD forms a golden cross for further confirmation, bullish momentum will strengthen; otherwise, if the KDJ forms a death cross at a high level or the price breaks below the middle Bollinger Band, a downward pullback may occur. The 1-hour chart also shows strong bullish strength for Bitcoin, and it may continue to oscillate upwards in the short term. However, because the KDJ is in the overbought area and the price is close to the upper Bollinger Band, a pullback may occur in the short term. If the MACD red histogram shortens and the KDJ forms a death cross at a high level, the risk of a pullback will increase. If the price maintains near the upper Bollinger Band and receives support, Bitcoin's price may continue its upward trend.
In conclusion, the big player offers the following suggestions for reference:
Buy Bitcoin near $67,450, targeting $68,500-$68,800, with a breakout target of $69,100 and a stop-loss at $67,000.
Instead of giving you a 100% accurate suggestion, I prefer to provide you with the right mindset and trend. After all, teaching someone to fish is better than giving them a fish; the goal is to learn how to earn for a lifetime! The focus is on the mindset, grasping the trend, and planning the market layout and position. What I can do is use my practical experience to help you make investment decisions and manage your operations in the right direction.
Time of writing: (2024-10-28, 06:00)

(Written by - Big Player Talks Coins) Disclaimer: Online publication may have delays; the above suggestions are for reference only. The author is dedicated to research and analysis in the investment fields of Bitcoin, Ethereum, altcoins, forex, stocks, etc., with years of experience in the financial market and rich practical operation experience. Investment carries risks; please proceed with caution. For more real-time market analysis, please follow the official account Big Player Talks Coins for discussion and exchange.
免责声明:本文章仅代表作者个人观点,不代表本平台的立场和观点。本文章仅供信息分享,不构成对任何人的任何投资建议。用户与作者之间的任何争议,与本平台无关。如网页中刊载的文章或图片涉及侵权,请提供相关的权利证明和身份证明发送邮件到support@aicoin.com,本平台相关工作人员将会进行核查。