In this episode, the trader invited the founder of CoinKarma, @BensonTWN. Thanks again to @sky_gpt for introducing us. Benson shared in detail how his trading strategies have evolved over different cycles, and how CoinKarma's indicators guide trading in various market conditions. From our conversation, I realized that Benson has always thought about how to build his trading structure in a non-consensus way to outperform others, because essentially, contract trading is a game of how to win over the majority.
All text is for sharing purposes only and does not constitute any investment advice.
TL;DR
1. About Trader Benson
1) What is the trading strategy?
In a volatile market, Benson finds positions with a high safety margin based on indicators to participate in the market; at the same time, he pays attention to BTC's inflow and exchange CVD indicators to judge market trends.
Benson allocates most of his positions (over half) to quantitative strategies for coin-based appreciation, primarily holding coins; about 40% of his positions are in stablecoins, used for guerrilla trading, participating in on-chain transactions or initial contract trades.
Benson's trading strategy does not pursue explosive growth but focuses on stability. His goal is to outperform the market index, with performance this year so far around 2 to 3 times.
Different assets have different operational methods. For assets that may become market hotspots, Benson holds them until market attention or the bull market ends; for larger market cap tokens, he uses technical analysis or fundamental analysis to judge possible price trends.
2) Why has this trading strategy formed?
Initially, like many novice traders, Benson frequently stopped losses and suffered significant losses from chasing highs and selling lows. This experience made him realize that market fluctuations are often manipulated by major funds, especially in the contract market, where the main players create volatility to harvest liquidity from weaker retail investors. Contract trading is a game of how to win over the majority, and to beat most people, Benson began to think about how to use data to follow the main players' operations.
From 2019 to 2022, Benson discovered that funding rates have a significant impact on trading. When contract open interest is high and funding rates reach extreme values, market trends may reverse. Benson profited in the bull market by operating against market sentiment.
However, when the Federal Reserve began raising interest rates in 2022, Benson believed that the Fed's rates acted like a stabilizing force, affecting the entire financial market and determining how to price risk assets. Bitcoin had never encountered such rapid interest rate hikes in its growth cycle, which affected the sensitivity of funding rates in the crypto space, leading to the failure of Benson's original trading system. Subsequently, Benson began studying order book data and developed the CoinKarma indicator to find safer trading positions.
2. Benson's Trading Indicators
1) About the Market
What data should guide trading in a trending market versus a volatile market?
A cycle can be simply divided into trending and volatile markets:
Trending Market: A rapidly rising or falling trending market usually lasts a short time. For example, this year, from the end of January to mid-March, there was a trending market that lasted over a month, during which the buying intensity in major exchanges with high spot trading volume was very strong, and the net inflow of BTC ETF funds was also quite exaggerated.
Volatile Market: After a trending market ends, it usually enters a range where the price fluctuates widely. Volatile markets occupy most of the time in the overall market. For instance, in the past six months, Bitcoin has been in a wide-ranging volatile zone, with a bottom around 50-60k and a top possibly at 70k.
Trending markets are relatively rare, while volatile markets are more common. When judging the market, one can observe indicators such as exchange CVD (Cumulative Trading Volume) and BTC ETF net inflow to determine whether it is a trending or volatile market.
- CoinKarma is a data website developed by Benson, which connects to the real-time APIs of major exchanges with high spot trading volumes to obtain order book data and transforms this data into indicators through algorithms to help traders judge market conditions.
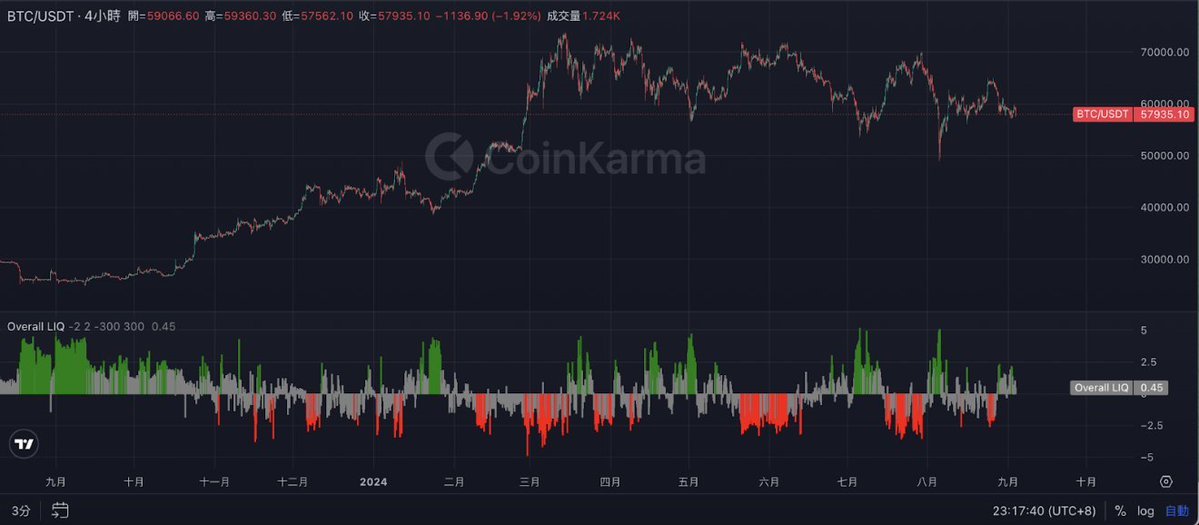
- Overall LIQ (Overall Liquidity Status) is an important indicator in CoinKarma. Its principle is to depict the market's liquidity status to judge possible price reversal points. Specifically, CoinKarma connects to exchanges' real-time APIs to obtain order book data, then compiles this data into a database to depict the current liquidity status of the market. When the price approaches the upper or lower limits determined by Overall LIQ, a reversal is likely to occur. In volatile markets, it helps traders find positions with a high safety margin. For example, in the past six months of Bitcoin's wide-ranging volatility, the Overall LIQ indicator has accurately reflected local tops and bottoms.
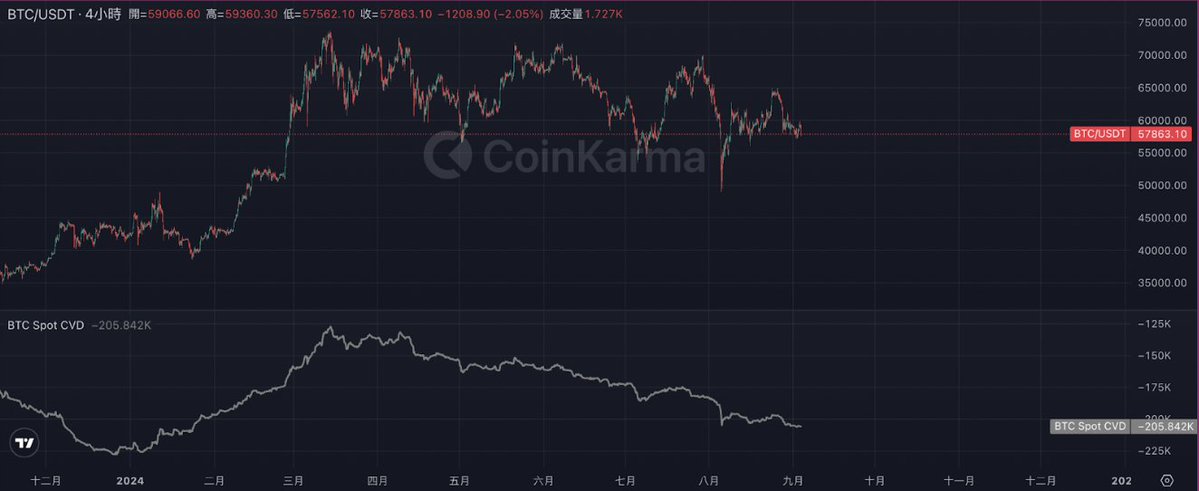
CVD (Cumulative Trading Volume) is another indicator in CoinKarma used to judge market conditions. It assesses the strength of market orders to determine whether the market is in a volatile or trending state. When there is heavy selling pressure in the order book, and CVD strength is low, the likelihood of a decline is higher, indicating a volatile market; conversely, when CVD strength is high and market order strength is strong, a trending market may be on the horizon. For a more detailed description of these two indicators, refer to Benson's tweet: https://x.com/BensonTWN/status/1829126733330821181
How to judge cycles through data?
Market peaks typically feature many outsiders beginning to pay attention to the field. For example, the peak of NFTs was in the first quarter of 2023 when many Web2 and Web3 projects were linked to NFTs. The download ranking of the Coinbase app during the last bull market was consistently in the top three among financial apps in North America, but its current ranking has not reached that level. The page views of Bitcoin on Wikipedia can indicate whether retail investors are showing signs of large-scale entry.
If Bitcoin is to break through historical highs, some external capital must intervene; it is difficult to achieve this solely with internal funds. For instance, this year, Bitcoin's rise from the end of January to mid-March formed a trending market because the buying intensity in major exchanges with high spot trading volumes (such as Coinbase, Binance, and Bitfinex) was very strong, and the net inflow of BTC ETF funds was also quite exaggerated.
2) About Altcoins
Why is there optimism about SOL?
From a technical perspective: In the crypto market, most large-cap and widely used public chains are EVM-compatible, while Solana is different as it is written in Rust. This means that developing applications on Solana requires developers to learn a new language from scratch, which indicates a higher purity of applications and developer skill levels compared to other chains.
Community value and support from core developers: Solana has experienced turmoil, including the collapse of FTX and the FTX creditor committee's intention to sell coins, but during the toughest times, it received vocal support from Ethereum's Vitalik and MakerDAO founder Christensen, as well as external ecosystem support, demonstrating strong community cohesion and resilience.
From the perspective of rebirth after adversity and BTC pair price: After facing numerous challenges, Solana's price movement has still been able to keep pace with the market, making it one of the few altcoins that have not entered a long-term downtrend against BTC since the last bull market. From the perspectives of price trends, fundamentals, and cyclical rebirth capabilities, Benson believes that if one were to choose an asset likely to break through the previous bull market high, Solana has a relatively high chance. Solana is a potential candidate to break through the previous cycle's high.
3. Benson's Trading Experience
1) What mindset is needed for high win-rate trading?
Benson believes that major players create price fluctuations for liquidation, seeking to obtain maximum returns at minimal costs. Investors must understand the sources of market fluctuations, the main players creating the fluctuations, and the costs and potential returns of these fluctuations to better comprehend market operations and formulate appropriate trading strategies. After gaining a basic understanding of the market, one can then develop their trading strategies to succeed in the market.
Establishing the correct mindset involves recognizing that most people in the market use technical analysis for trading, so one needs to have a different perspective or focus on different aspects. For example, when using technical analysis tools, consider the reflexivity of trading and think about what many people would do when they see the same patterns, then make different decisions.
The effectiveness of indicators can change. Sometimes they are useful, and sometimes they are not, indicating that the effectiveness of the indicator is decreasing, necessitating the search for new certainties to adapt to market changes.
2) What is the daily trading routine?
In the morning, I first check the overview of market liquidity through the mainstream cryptocurrency liquidity and overall market liquidity published hourly in the Telegram channel to determine whether to take action, only intervening in the market when a reversal is likely. The decision on whether to operate as net long, net short, or simply hedge the spot position with leverage long or leverage short is based on the certainty of the opportunity.
I check whether the existing positions in altcoins meet expectations and whether the reasons for holding still exist. If the expectations have been met or the reasons for holding no longer exist, I choose to sell.
3) How to avoid significant losses in trading?
Avoid buying tokens like buying stocks: Investing in some PE ratio seemingly reasonable tool-type projects can lead to collapse when the crypto market changes rapidly and the hype fades. Benson believes that investment should focus more on projects with a certain allure and imaginative potential that have not yet fully materialized, rather than purely tool-type projects, while also considering whether the project's demand is long-lasting and not subject to significant fluctuations with market cycles.
Sell promptly: When a project has reached expectations or the reasons for holding no longer exist, it should be sold in a timely manner.
Control leverage: Leverage is generally high in the crypto market, but due to the large fluctuations, using high leverage can easily lead to being harvested by major players.
Conversation Record
FC
In today's "Trader Dialogue" program, we have Benson as our guest. Previously, when discussing good traders to recommend, someone mentioned you. I later reviewed your trading history and process. My understanding now is that you primarily operate through a data-driven trading system and have productized this data, such as the COINKARMA indicator you created. Today, we will discuss your trading strategies and these data points to share your story and experiences.
We will divide our discussion into several parts. First, let's talk about your trading background and personal background, as well as the reasons behind your strategy formation. Then, we will delve into your trading strategies to help everyone better understand your methods. Finally, we will discuss your personal growth experiences and self-iteration process. Could you start by briefly introducing yourself?
Benson
Sure, thank you for the introduction, FC. Welcome everyone to our Twitter Space today, I am Benson.
I started full-time trading in the crypto space in 2019, so it has been over five years now. Initially, like many others, I didn't have much of my own ideas during trading, often chasing highs and lows, and frequently stopping losses. After about three months of trading, I gradually realized some truths. I vividly remember that in the first month and a half, I lost $8,000, with my losses peaking at $50,000. So, my initial trading experience was not good. Later, I realized that the market trends in the crypto space are actually manipulated by major players. They control the price increases through the spot market and then harvest retail investors in the contract market. I only realized this after losing about $50,000.
Then I began to think, if in the long run, the major players in the market are always the ones making money, creating volatility and attacking areas with weaker liquidity that are prone to stop losses, is there a way for me to follow the major players in my operations? Between 2019 and 2022, there was a period when funding rates were very favorable. For those who started trading contracts early, like me, who pay attention to data, this should be quite noticeable. As long as the open interest on Binance, BitMEX, and other major exchanges reaches a certain level, if the funding rates show extreme values, such as particularly high or particularly low, it is very likely to trigger a market reversal.
I then discovered that when open interest is high and funding rates are also high, it indicates that more people are aggressively going long, which pushes up contract prices and creates a premium over the spot market. At that time, I felt that this strategy was really simple and effective. So I began to observe the funding rates of major exchanges, essentially operating against market sentiment. Using this method, I indeed made a lot of money during the bull market from 2020 to 2021.
At that time, I participated in the FTX trading competition and connected my real trading on FTX with Coin. I started with $400,000 and grew it to over $6 million, reaching the 18th position on the contract PNL leaderboard. If I remember correctly, that was my trading process. I first lost a significant amount of money, then began to contemplate the essence of this market, ultimately discovering that those who create volatility are actually the ones harvesting liquidity. To understand how these players operate, one must look at the data from contracts.
However, this strategy began to fail after 2022. The reason for the failure was that the Federal Reserve started raising interest rates. The concept of funding rates is essentially the cost of capital you need to pay when going long or short on contracts, so it is also a concept of interest rates.
If the Federal Reserve's interest rates affect the entire financial market, then it determines how to price risk assets. The Federal Reserve's interest rates act like a stabilizing force. Before Bitcoin's inception until 2022, this stabilizing force was at a very low level.
But after 2022, it experienced an unprecedented significant rate hike. Since Bitcoin is a relatively young asset, it has never encountered such rapid interest rate hikes from the Federal Reserve during its growth cycle. The rate hikes in 2022 were the fastest in the past 30 years, and such a rapid increase also affected the sensitivity of funding rates in the crypto space. So during that time, I kept trying to go long in the first half of 2022. Although I knew we might have entered a bear market, I still wanted to gamble on a rebound. The result was that the previously effective trading system had failed, and coupled with various events like the Luna collapse, I decided around March to April 2022 to temporarily step back because my strategy was not working, so I chose to take a break for a while. That was the previous story. Later, I began to study some new things and found new clues from order book data. I recorded the order book data from major exchanges and used this data and price trends to identify some clues.
Then I turned this order flow system into a data website called CoinKarma. Regarding CoinKarma, I think we can elaborate on it later because there is quite a bit of content. This is the evolution of my trading style, initially like other retail investors, and later realizing that I should focus on contract data because market volatility is primarily created by major players who extract liquidity by causing liquidations on the opposing side. I then discovered that market makers have a price range when creating momentum. If you can find the relative upper or lower limits of this price range, it becomes easier to find reversal opportunities in volatile markets.
I found this insight during the process of developing the CoinKarma order book, and this research was officially productized starting in May, and now there are about two to three thousand users of this product. Currently, those who pay for the service find it quite good, as it helps them maintain faith during market panic and reminds them not to get too carried away when the market is overly enthusiastic and everyone feels it’s going to the moon. Our system can indeed help everyone achieve this. Alright, I’ll stop here and see if FC has any questions.
FC
Okay, I would like to ask, if you were to summarize your current trading style in one sentence, how would you describe it? Including your views on each cycle, such as how long your trading cycles are, what your expected returns are for each, and how you manage risk. Could you give a rough overview?
Benson
Sure, no problem. Actually, I currently allocate more than half of my positions to quantitative strategies. Since last year, I started to engage with the API interfaces of exchanges and began quantitative trading based on order books. Now that I’m a bit older, in my thirties, it’s not feasible for me to stay up all night watching the market every day. So, I have about half of my positions in the quantitative part, mainly for coin-based appreciation. As long as I judge that the current cycle is still on the rise, I try to primarily hold coins. The remaining approximately 40% of my positions are mainly in stablecoins, used for guerrilla trading, participating in some on-chain trading opportunities, or making initial contract trades. So my position allocation is roughly 60% for quantitative coin-based appreciation and 40% for guerrilla trading, as my strengths lie more in centralized trading, while on-chain trading is mostly done with friends, and I’m not particularly skilled in that area. Therefore, my operations are mainly focused on the overall market, and I rarely play with smaller market cap altcoins. My return curve is not one of those explosive growth types; for example, in the last bull market, I grew $400,000 to $6 million over about a year and a half, achieving a 15x return. But during that time, the market was very bullish, and I didn’t feel my returns were particularly explosive; I was just able to beat the market index. So I’m not the type of trader who achieves thousandfold or hundredfold returns, but rather someone who can outperform the market index, with performance this year so far around 2 to 3 times, as my operations are still primarily focused on the overall market.
FC
In the last cycle, your starting point was around $400,000, right? This time, the cycle might be larger. What are your expected returns for this cycle? For example, is it enough to outperform BTC, or do you have a profit-taking line?
Benson
Actually, my starting point this round is quite low because my funds are stuck in FTX, so the starting point may not be as high as everyone thinks. However, I have a goal to recover to the previous high point, and I think that would be sufficient. The starting point is low, but I can only say that it might require a return of 15 to 20 times or more. To be honest, the market conditions this year are not as favorable as before. Everyone says that from October last year to March this year was the smoothest period, and then it entered "hell mode," where the market has basically been in sideways consolidation without many explosive or certain opportunities to participate. You can only try to find better entry points for long and short trades in this wide-ranging consolidation. But this kind of market really doesn’t make it easy to earn big money. During this time, I have been trying to hedge and cash out at high points, and then buy back spot at low points to reduce my spot holding costs. Currently, my cost for Bitcoin is controlled around $30,000 to $34,000 because I have been trying to lower costs as much as possible through hedging, selling calls, and selling puts.
FC
Okay, I understand. So I take it that you are primarily focused on BTC, right?
Benson
Yes.
FC
Alright. Next, I would like to understand your trading strategy. Because you just mentioned that you have productized your data, could you specify which two data points you look at most often? How do they guide your trading? For example, when do you start buying in this cycle, why do you buy, and how do they provide you with guidance?
Benson
Sure, actually, the indicator I look at most often is called LiQ, which stands for LIQUIDITY INDICATION. This indicator is created by connecting to the real-time APIs of major exchanges with high spot trading volumes to compile a database, from which I depict the current liquidity status of the market. For example, when market makers are making markets, they will influence their price action based on the order book's status.
For a simple example, let's say you have $500,000, and you are trading a small coin with a market cap of about $10 million, whether in contracts or spot. You could try opening a position with 2x or 3x leverage, roughly around $1 to $2 million, and place your order at the bid or ask price to see what happens. If you place your order at the bid, you will notice that the spot price will jump up a little bit immediately. This phenomenon is quite interesting; market makers adjust their market-making direction based on the order book's status. Do you understand what I mean? Especially, the orders that are closer in the order book will have a greater impact on the price.
Once you understand this, you need to know how to learn from the order book. Although the data from the order book is public, piecing together this public information into a complete picture is not easy. I have used some technical means and encountered many pitfalls to capture this data, especially from Binance, which is really hard to obtain. I collected this data and transformed it into an indicator using some algorithms. This indicator can be seen as a price range that dynamically adjusts. When the price approaches the upper or lower limit of this range, a reversal is likely to occur. I created an indicator from the order book data that can issue alerts when a reversal in the market is possible.
You can find the relevant charts and information in my latest tweet. I just posted it, specially prepared for today's Twitter Space. I rarely tweet, so you can check it out. Basically, over the past six months, Bitcoin has been in a wide-ranging consolidation, with the bottom around $50,000 to $60,000 and the top possibly at $70,000. The indicator we look at most often is the Overall LIQUIDITY Status. Over the past six months, this indicator has accurately reflected local tops and local bottoms. Although sometimes it may show bottom signals while the price still drops further, overall, it has provided buying opportunities at relatively good positions, which is much better than FOMOing at the highs.
You can take a look because when I posted some tweets before, many people said I was just a backseat driver. So later, I thought, why not post some predictions in advance? I told the editor that I felt there was a high chance of a drop on August 26, so why not publish an article to remind everyone? And it turned out to be accurate. On August 26, Bitcoin's price was around $64,000, and just two days after we published the article, Bitcoin dropped from $64,000 to $57,000, a correction of over 10%. Recently, I have been less active in the community because I have been busy working on my products and trading. But I particularly wanted everyone to know that this indicator has predictive power for market trends. Many people say I only speak after the fact, so I thought, why not remind everyone in advance when we feel the probability of success is high, whether it might go up or down? In the chart I just posted, you can see that at around $57,000 to $58,000, the Overall LIQ indicator showed a state with a pillar, which is usually a signal of a local bottom.
But this is also a matter of probability. We have backtested and found that when the Overall LIQ indicator shows a green pillar, the chances of Bitcoin rising 5% first versus falling 5% first are 7:3 and 2:7, respectively. If we backtest using data from the past two years, when the Overall LIQ shows a red pillar, the chance of rising 5% first is 33%, while the chance of falling 5% first is 67%. This has significant statistical meaning. You have to consider that Bitcoin has risen a lot in the past year or two, from over $20,000 to a peak of $73,000, and is now around $60,000. So if there is an indicator that shows a 5% chance of falling in this situation, and the win rate is as high as 2/3, then it is statistically very significant. We are not making random predictions because many of our users have felt this at local tops and local bottoms over the past three months.
Many times, when the market is saying Bitcoin is going "to the moon," and everyone is expecting a skyrocket, our user base is very conservative. Most people are either shorting at that time or at least considering cashing out or trying not to FOMO into leverage long. Conversely, when everyone is panicking, like in early August or early July, that’s when we would enter the market. Some people might enter earlier and stop out, but our entry positions are usually after the market has corrected significantly. Our trading system helps us find entry points with a sufficiently high margin of safety. If you look at the latest post on my Twitter, you can see it just by looking at the chart; there’s no need for too much explanation; it’s basically like that.
FC
OK, first, I want to thank Sky because Sky introduced us; he is our matchmaker, right? That’s how we have today’s conversation. I see Sky is here. Returning to the question you mentioned earlier, I understand that your data indicators essentially help to assess from the perspective of the major players whether the potential upside or downside is greater at this moment, is that correct?
Benson
Yes, I can add to that. The factors influencing the crypto market can be divided into long-term and short-term factors. Long-term factors look at whether these assets, especially Bitcoin, are gradually being recognized by a broader mainstream market, such as its adoption rate, and whether more people see it as a store of value as a financial asset, etc. These determine its long-term trend. However, during the long-term trend, there will definitely be bumps, right? So where do these short-term fluctuations come from?
Basically, we can say that short-term volatility mainly comes from liquidations of high leverage. The so-called liquidation of high leverage means that these market makers or major players in the crypto space have the ability to control prices. If they want to maximize their profits, they will pump the price when there are many shorts or dump the price when there are many longs. The most obvious example is the market on March 5, which kept rising until it suddenly dropped by 10,000 points that day. Why did it drop so much? It was because there were a lot of people in leverage long at that time, and once it started to drop, just a slight push could trigger a chain liquidation.
So from the perspective of the major players, you will find they are doing one thing: how to extract the maximum return at the lowest cost during the process of pumping or dumping. For example, if I want to liquidate longs, I only need to spend $2 million to dump the price, and in the end, I might earn $4 to $5 million, then I would do it. Conversely, if I want to liquidate shorts, I only need to spend $2 million to pump the price, potentially earning $4 to $5 million in the contract market or in the futures or options market, then I would do that too. Our system, which is this LIQ indicator, aims to identify the cost that major players need to incur when they want to pump or dump. If this cost is very high, the major players might consider whether they really want to do it. Because if they spend $20 million to dump the price, and the final return is uncertain, they might only get back $5 million or $10 million, then they might not take action. Do you understand what I mean?
Benson
So why I say the role of the Overall Liquidity indicator is to see where the market's cap might be. This upper limit will adjust over time; it is not a fixed line, but we can identify its possible position. In the wide-ranging consolidation over the past six months, as long as Bitcoin approaches $70,000, the cost of pushing up will be very high because there is heavy selling pressure at $70,000, and the number of shorts that can be liquidated is limited. At this point, the major players might choose to give up on pumping and instead dump the price because that way they can extract more liquidity. So our system starts with this mindset and then creates this indicator. Since the short-term fluctuations in the market are formed this way, we try to find that line where a large amount of chips is needed when pumping or dumping. Once we find this line, we can know that the price is likely to reverse at this position. This is the theory and logic behind it. At least in the past six months, this feature has been quite useful in identifying local tops and local bottoms.
FC
OK, I understand that there should be two application scenarios, right? The first is that I am thinking about when I would use this indicator. For example, a while ago, one of my LPs asked me whether to buy Bitcoin when it dropped from $78,000 to $60,000. I believe the current indicator can actually determine whether it is at a relatively low point or a relatively high point during a consolidation or range-bound market. That’s one scenario. The second scenario might be during the entire consolidation period when there is no one-sided trend; it can be used for box trading, right? I understand that these are the two main scenarios that can tell you whether this is a relative high or low point. Am I correct in understanding this?
Benson
Actually, if we categorize the entire cycle, we can simply divide it into one-sided trends and consolidation trends. If we roughly classify it into these two categories, the duration of one-sided trends is actually very short, usually a quick one-sided trend followed by entering a range, where it undergoes wide-ranging consolidation. This is typically the case. So we can say that one-sided trends account for a very small proportion of the overall market trends; most of the time is spent in wide-ranging consolidation.
In the crypto space, for a one-sided trend to occur, it is not determined by the internal major players; it requires a continuous influx of external funds or a constant outflow of internal funds to potentially cause a one-sided rise or fall. Such factors usually only last for a short time in each cycle, possibly one to two months, before entering a range and then consolidating for a long time until the next direction is determined. Therefore, the products we provide are designed to help you find positions with a high margin of safety to participate in the market during most market conditions, especially during consolidation.
As for how to identify one-sided trends, we also have methods. We observe the CVD of exchanges, which is the Cumulative Trading Volume. CVD is determined by observing the strength of market orders. If the order book is thick, for example, if there are many sell orders, you need a lot of market orders to knock out these sell orders. We create an indicator based on the strength of market buys. So in late July and early June this year, we observed a phenomenon where the CVD strength was not high, and the power of market orders was weak, while the selling pressure above was very heavy. In this case, the chances of a decline would be higher, indicating that we were still in a consolidation phase rather than approaching a one-sided trend. Therefore, we provide a trading system that is very useful in consolidation markets, but we also have other indicators to help you determine whether the current market is in a consolidation phase or a one-sided trend. That’s what we are doing.
FC
So, I don’t know if you’re comfortable discussing this. For example, you just mentioned $70,000, where you believe there is significant selling pressure, right? From the perspective of long-term traders, how can I determine which indicator can indicate whether this $70,000 might break through? Of course, from an external perspective, there may be some macro factors changing, such as interest rate hikes, cuts, or other positive news. In your indicators, can you see whether this time it might really break through the previous high and establish a new trend? This is also something everyone is concerned about because everyone has been in consolidation, right? A while ago, it almost reached $76,000 and then came down again, right? When will it end, and how can we look at this?
Benson
Let's put it this way: if you want to break through a strong resistance, it's impossible to rely solely on internal funds to push it up. Therefore, we look at the status of external funds. For example, this year, the most obvious one-sided trend was from the end of January all the way to mid-March, lasting for over a month. During that time, we observed the trading volumes of major spot exchanges like Coinbase, Binance, and Bitfinex, where the market buy strength was very strong. This included the inflow of BTC ETFs, which also saw an exaggerated net inflow of funds. Only under such circumstances, with external funds continuously pouring in and impacting the market, can we break through the selling pressure above and form a one-sided trend. So, simply put, if you want to determine whether this time will break through or continue to consolidate, you mainly look at BTC inflow and the CVD of the exchanges I just mentioned.
In our trading system, if the Overall LIQ is very red, it indicates that the selling pressure above is very heavy, and the major players or market makers encounter significant resistance when trying to push up. However, if there isn't enough external funding to give it a push, such as weak ETF inflows and weak market order strength in CVD, we can be more confident that the likelihood of a pullback at this position is higher, rather than a direct breakthrough. These are the indicators we focus on when looking at the market. Of course, everyone may look at different indicators, and the methods for judging one-sided trends versus consolidations may vary, but this is our approach.
FC
I understand. OK, I want to ask the next question about some altcoins. For example, I see you have some views on Solana. Why don't we start by discussing what you think the logic is behind Solana breaking through its previous high? Can you share your thoughts?
Benson
Sure, let's start with the fundamentals regarding Solana. We can see that the larger public chains in the crypto market, which are popular among users, generally share a characteristic: they are EVM compatible, right? This means that as long as you know how to write Solidity, you can quickly deploy a DApp on these EVM-compatible chains. In contrast, Solana is different; it is written in Rust. To put it simply, other chains may allow you to quickly port a DApp as long as you know Solidity.
So, if you want to truly build an ecosystem on Solana, there is a bit of a flaw. If I were to cheat, I could quickly throw something up there. But on Solana, as a smart contract engineer, you might have to learn a new language from scratch to develop applications. Therefore, in terms of the purity of applications or the level of developers, I believe Solana is clearly superior to other chains. This is one of the reasons I am optimistic about Solana. Even if both have the same TTVL, say two billion or three billion, and both have DEXs, swaps, and derivative exchanges, the question is which can be easily copied over and which needs to be developed from scratch. Especially in the last cycle, aside from the relationship with FTX, this is one of the reasons I am optimistic about Solana.
The second reason is that this logic still exists. Most chains still consider EVM compatibility an important feature. From a cyclical perspective, for a coin to become a long-term hold asset, there must be a reason for people to want to hold it long-term, which requires it to have the ability to be reborn from the ashes, demonstrating its anti-fragility. Anti-fragility means that under extremely adverse conditions, it has the ability to return to the front lines. I believe only a few coins possess this ability. Bitcoin certainly counts as one, having gone through over a decade of being looked down upon by mainstream media multiple times. Ethereum also counts, as it nearly collapsed after the ICO but eventually climbed back. Then there’s BNB, which has survived events like the 94 incident and CZ's arrest, and is still doing well.
Then there’s Solana. Solana experienced the FTX explosion and the turmoil of the FTX creditor committee planning to sell coins. At Solana's lowest point, it was not the internal supporters of Solana but rather Ethereum's big shot, Vitalik, who supported it. He said that if ETH won because of Solana's failure, he would feel very regretful; this was said by Vitalik himself. At that time, MakerDAO also considered moving to other chains, and Solana was one of their options. So at Solana's lowest point, it was actually the external ecosystem that supported this chain, giving everyone some confidence.
Therefore, from the technical perspective, the value of the community, the difficulty of development, and the ability to be reborn from the ashes, I see Solana as a relatively good investment target. Because investment targets are comparative. If we look at Solana's performance against ETH or BTC, it is basically in a state of rebirth. Most altcoins are depreciating against BTC, and many coins that were thriving in the last cycle are completely lagging behind this time, but Solana is keeping up. So from the perspective of price action, fundamentals, and cyclical rebirth ability, I believe Solana is a candidate that could break through the previous cycle's high, at least for me.
FC
Got it. Can you describe how you complete the entire trading process in a day or over a cycle? For example, what data do you look at daily, and under what data indicators do you take action? Can you walk us through this process? Because you now have your own product, right? How is the entire trading process completed?
Benson
Sure, I can give a rough overview. OK, every morning, I first check the current market liquidity situation. We have a Telegram channel that publishes the liquidity of major coins and the overall market liquidity every hour. I will look at that first; basically, I only intervene in the market when a reversal is likely to occur. There are many ways to intervene in the market; if the certainty is high, I might leverage long or leverage short. If the certainty is not that high, I might choose to hedge my spot, buy some puts, or engage in some dual-currency financial operations if I have spot holdings.
So the first thing is to look at the market liquidity situation to determine whether I need to take action. Then, because I still hold some altcoins, I will check whether they meet my expectations and whether my reasons for holding them still exist. I might look at it; if it has reached my expectations, for example, if a coin that was originally around the 200th market cap has reached my expectation of entering the top 30, I might choose to sell it at this stage. Even if it has a chance to enter the top ten later, I think the risk is too high and the probability is low, so I might choose to sell.
Basically, it goes like this: first, check liquidity to determine if there are opportunities to intervene, then decide whether to net long, net short, or hedge based on the certainty of the opportunity. Next is the existing holdings of altcoins; if they haven't reached expectations and the reasons for holding still exist, then continue to hold. If they have reached expectations or the reasons for holding no longer exist, then I might choose to sell. That's about it.
FC
Understood. When was the last time you sold a token, and what changes did you perceive? You can also talk about your reasons for buying and selling; I find that quite interesting. What variables do you pay attention to regarding an altcoin token?
Benson
Sure, I can share two examples. One is FTT. I was an early holder of FTT, with an average entry cost below $3. Later, when it was listed on Coinbase, the pre-market trading market cap exceeded $100 billion. I calculated that this market cap seemed a bit inflated because the Coinbase listing had driven a surge in platform tokens. At that time, FTT skyrocketed from under $10 at the beginning of the year to $60, and BNB rose from the $30s to the $500s. I sold about 30-40% of my FTT at $60 because I thought there would definitely be an opportunity to buy back at a lower price later. The market was already too hot at that time, and of course, later FTX had issues, but that’s another story. This is an example of a long-term spot I sold.
The other example is Solana. I bought it at a price above $3, and later it had a significant correction down to over $1. At the time I bought it, its circulating market cap was around the 100th position, and my expectation was that if it could enter the top 30 in this cycle, that would be great. So I sold all my Solana before it hit $60, even though it later rose to $260, which I consider selling too early. But even though I sold early, I believe no one could have predicted it would enter the top ten; I thought the chances of that happening were very low, so I didn’t anticipate such a strong rally afterward. These two examples illustrate my expectations and the final decision to sell.
FC
Got it. OK, regarding the data we discussed earlier, do you have any additional comments?
Benson
Not at the moment.
FC
OK, let's talk about risk control and your stop-doing list. What operations do you definitely avoid now? Are there past experiences that make you particularly cautious now? For example, when certain situations arise, you would choose to stop loss or take profit. That’s the first question. The second question is, what trading habits have you learned from past significant losses that you definitely avoid now? Can you share that with everyone?
Benson
OK, let me first talk about significant losses I’ve experienced in trading. I have quite a bit of experience in this area. In the past, I often thought that as long as the sector was decent and there were no better investment targets, I would just hold on. Some sectors might seem reasonable from a PE ratio perspective. However, I later realized that the most "sexy" aspect of the crypto space lies in its ambiguity. What is ambiguity? It’s when a project hasn’t fully materialized; when it hasn’t materialized, the story can be very grand, and the PE ratio has a lot of room for imagination. For example, we might say a certain project is a decentralized computing network for the whole world; from a market cap perspective, how much does it need to rise to match that positioning? That point is very hard to estimate, right?
But later, some of the targets I invested in were truly tool-based projects, and their PE ratios were easy to calculate, which made sense compared to stock PE ratios. For example, some stocks might have a PE of five or ten times, depending on the industry. So at that time, I would think that if a coin had a PE of 5 to 10 times, it was worth buying. My initial thinking was to buy tokens as if I were buying stocks because my main holdings were exchange tokens, which had relatively easy-to-calculate PE ratios.
But later I realized that this way of thinking does not apply in the crypto space because the pace of change is very fast. Some projects may seem to have a reasonable PE ratio for a period, but when the hype is gone, they can completely collapse. For example, take OpenSea. At one point, OpenSea's valuation exceeded $10 billion, and the logic behind that valuation was that their trading volume was very high, allowing them to earn a lot just from transaction fees. I forgot what PE they used to calculate that valuation, but at that time, a $10 billion valuation seemed like a sensible investment. However, we all know that the NFT market cooled down later, right? So what was a reasonable PE ratio at that time may now have turned into hundreds of times, which is unreasonable.
With these experiences, I understood that in the crypto space, projects with ambiguity are actually better targets. It's best to focus on projects that have imaginative potential but haven't fully materialized yet, rather than purely tool-based projects. I believe non-tool-based tokens have more imaginative space and are less likely to encounter the issues I just mentioned.
So, if I were to invest in a coin now, if it is still a tool-based one, I would look at whether its demand is a long-lasting one that won't fluctuate significantly with the cycles. In contrast, a project that might have had a 100x return could now only offer a 1% return, which is not worth investing in. I would focus more on projects with long-term demand. This is one of the significant losses I’ve experienced in trading. In the past, when investing in certain sectors, I treated them like stocks, thinking the PE ratio was reasonable, only to end up with dismal results. I might have entered with $100 and ended up with just $5, essentially losing everything.
FC
I understand. What you mean is that when a project hasn't materialized yet, its sentiment carries a lot of imaginative space. But once it does materialize, when you measure it by valuation, its downside potential might actually be greater, right? So what is your trading approach now? Is it to exit once you reach your expected returns, or do you think there are better selling points?
Benson
I think different targets require different approaches. For some targets, I might feel that it has the potential to become the next market focus. As long as I subjectively believe that the market won't completely cool down and won't enter the beginning of a bear market, I might hold until this topic is ignited. For example, I think the wave of meme coins in this cycle cannot be said to be completely over, but it will be difficult to generate another wave of hype like before. Instead, it might be some coins with good fundamentals that have been undervalued for a long time that will be picked out and gain attention again. For instance, Aave has recently been discussed because its performance is decent, and in the DeFi projects, the founder hasn't wasted money and has been focused on development. I believe that if there are still some hot topics in this cycle, they won't all be concentrated on meme coins like in the first half. In such cases, I wouldn't pay too much attention to target prices but would focus more on whether the market aligns with my views. Of course, it’s possible that my view is wrong, and the market may not pay attention to that target.
But if my initial reason for buying was that I felt the market hadn't yet focused on this sector and I believed this sector could rise, then I would hold until the market pays attention to it, or until I feel the bull market has ended and the market has completely cooled down, at which point I would also choose to exit.
FC
Got it.
Benson
For some targets, I do need to look at the price because their history might be longer, and I can roughly judge where their price might go through some technical or fundamental analysis. I would use this approach for tokens with larger market caps.
FC
Understood. I actually had another question about the relationship between data and cycles. You mentioned cycles; how do you determine which stage of the cycle we are currently in? For example, the current cycle has already progressed two-thirds, right? Are there any data indicators that can support this?
Benson
I think it's indeed hard to say about the progress; I don't have the ability to judge whether we are one-third, two-thirds, or have already completed the cycle. But I feel that, based on past cycles, there tends to be a cyclical peak, and peaks usually have a characteristic: many outsiders start to pay attention to this field. For example, the peak of NFTs was actually in the first quarter of 2023, when everything seemed to be linked to NFTs, and all web2 and web3 projects were getting into NFTs. However, at least in this cycle, I haven't seen a similar phenomenon.
Recently, many people have been paying attention to an indicator, which is the ranking of the Coinbase app, right? In past bull markets, the Coinbase app's ranking has generally remained in the top three for a long time. For instance, during the last peaks of $64,000 and $69,000, it was in the top three among financial apps in North America for quite a while. But this time, the highest ranking was only fourth, and it only maintained that position for a day. If we look at the page views of Bitcoin on Wikipedia, we also haven't observed signs of retail investors entering the market on a large scale. So if $73,000 is indeed a cyclical top, then the characteristics of this top are quite different from before. At least from my perspective, I think there are still many variables regarding whether Q4 can create new highs or even whether Q1 next year can create new highs. One of the variables is the political climate in the U.S. Originally, everyone thought Trump's chances of being elected were high, but later Biden might not run again, and Kamala Harris might take over, which introduces a significant variable. So honestly, it's really hard to judge right now, but I personally lean bullish. I think the chances of this cycle continuing to rise are still relatively high, and at least Bitcoin has the opportunity to create new highs. However, this is just my personal bullish bias. If we are to validate this recently, I think we need to first prove that $65K is not a lower high, not a daily lower high. If we are looking for right-side entry points afterward, at least the daily closing price needs to be above $65K or $66K. That line is also the 200MA, and from the current situation, it is still a pretty important line. So subjectively, I think there is a chance to break the previous high later. But in actual operations, when increasing positions, I will pay special attention to whether the $65K position can be broken. If it breaks, then the daily level won't form a lower high, and it could be a reversal signal, something like that.
FC
I think in our final segment, I’m personally quite curious. You initially judged the market direction through funding rates and had decent returns. Later, you noticed changes in the market, right? So how do you continuously sense changes in the market now to prevent your trading strategy from becoming ineffective? I want to know how you do it. Have you been learning new things, and are there any recommended traders or information sources you follow?
Benson
This question is very interesting. I think rather than focusing on what type of traders to follow or what data to observe, it's more about having a foundational understanding of the market. For example, I initially drew lines, looked at patterns, analyzed moving averages, and even used Fibonacci retracements. But later I realized one thing: 90% of people in the market trade using technical analysis. So if you also trade using technical analysis, and you want to succeed in the futures market, there’s only one way: even if you use the same tools, your perspective must be completely different from others. For instance, if everyone sees a head and shoulders pattern, you need to think about how so many people will act on that head and shoulders, and then what you should do. You have to consider the reflexivity of trading as well.
I found that if I also trade using technical analysis, I must be able to do this, but perhaps I don't have enough confidence to do it well. So at that time, I started to think, since most people in the market trade this way, can I use another method to view the market? The futures market is a zero-sum game; to make money in this market, you either have to look at the same thing but have a different idea, or look at something completely different to succeed in the futures market.
This way of thinking is universal in the market. For example, funding rates used to be very useful; I used to look at long-short ratios and open interest, but I don’t mention them as often anymore. Why? Because once people start paying attention, it creates reflexivity in trading, and what was once useful suddenly becomes useless, or sometimes it’s useful, and sometimes it’s not. When this situation arises, you need to know that when this happens frequently, that system may become ineffective, and you might need to find new sources of certainty.
I now frequently look at liquidity indicators, which were initially free in my group. I created a channel for it, and that channel later had over 500 subscribers, providing it for free for almost two years. Later, someone suggested that this tool shouldn't be free because anyone could access it. That’s when I decided to close the group to protect this alpha, trying to keep it as limited access as possible so that not everyone could use or see it.
So when you look at this market, you first need to have this way of thinking: for an alpha to remain effective, the number of people who know about it cannot be too high. If you have an alpha and find it useful in many places, and then suddenly it’s sometimes useful and sometimes not, that might indicate that it has already been widely known.
To protect the alpha, CoinKarma will also limit the number of users. For example, we recently decided to remove the free version because we provided the liquidity indicators for BTC and ETH in the free version, which were already quite useful. Some paid members were concerned it would affect the alpha, so we decided to remove it. If the number of members increases in the future, we will implement a pricing model to keep the user count below a certain level.
Another point I often mention is that leverage is generally very high in this market. For example, on exchanges like Binance, you can open 50 to 100 times leverage on many coins. Such high leverage only appears in the forex market, where the annual volatility might only be 10%, which is why they use such high leverage to amplify returns. But in the crypto space, the weekly volatility might exceed 20%, so if you open such high leverage, who will be cut if not you?
So the second way of thinking is that you need to understand that in the long run, short-term fluctuations in this market, why sometimes the lines are drawn particularly quickly, is actually to kill high-frequency trading strategies and retail investors with high leverage. Market makers sometimes create very strong movements when harvesting chips. Therefore, you need to have this foundational understanding before developing your trading strategy to have a chance to succeed in the market. Otherwise, if you don’t know where the liquidation lines for high-leverage retail investors are, many times your trading system will be incomplete.
I think rather than learning something specific, it’s more important to have a basic understanding of how this market operates. You need to know where these fluctuations come from, who is creating these fluctuations, what costs they incur when creating fluctuations, and what their potential gains are. These are all things that the major players will calculate before creating fluctuations. The chips I throw out, how much do I need to spend to throw them out, and I also need to ensure that I can recover these chips so that I can maintain control over that target.
With this way of thinking and model, your understanding of the market will be more accurate. I think this is something that is rarely mentioned in the market, but if you want to maintain an advantage in the futures market in the long term, this point is very important.
FC
OK, thank you. My last question is whether there is any trader, whether within our industry or outside of it, who has had a significant impact on you? If someone wants to become a trader like you, what knowledge systems do you think they should learn? What should the process of forming this knowledge path look like? This is the final question.
Benson
How should the knowledge path be formed?
FC
Right, first, is there any trader who has had a significant impact on you?
Benson
Actually, it seems there isn't. If you really ask me, I feel there isn't. I should say that I don't have an idol on this trading path. I don't have a specific "role model" type of idol. However, I do refer to the opinions of people from different schools of thought.
FC
Okay, that's fine.
FC
I think it's about time; we've been chatting for about 1 hour and 5 minutes. Thank you, Benson. Do you have anything else to add? Everyone can take a look at his pinned tweet; that image is actually what he just mentioned. Listening to our recording along with that image will enhance the understanding. Do you have anything else to add?
Benson
Not for now.
FC
OK, from what I've gathered, the core of your initial point is that when everyone sees an indicator, it may become ineffective. Essentially, you think about how to construct your trading structure through a unique perspective or a non-consensus approach to outperform others. Because fundamentally, contract trading is a game of how to win over the majority, right? The way you've found is to align with the interests of the major players to surpass others, thus forming your own trading system. I don't know if this summary represents your approach.
Benson
Yes, I think the summary is very good.
FC
OK, great. We will organize today's content into a written version and accompany it with some images to help everyone better understand what your trading system looks like.
I believe every trader has their unique style and ideas. Everyone can learn in a way that suits them or enrich themselves by combining others' strengths. This is also the original intention of our dialogue, to provide different spaces for everyone. I think completely copying someone else's trading strategy is very difficult. The most important thing is that everyone's personality and growth paths are different. So I hope more people can see different trading styles. Thank you again, Benson. Although we haven't known each other for long, I appreciate your open sharing. Shall we wrap it up here today?
Benson
Sure, thank you for your time, FC. Let's end it here today, goodbye.
FC
Alright, goodbye everyone.
Benson
Goodbye.
免责声明:本文章仅代表作者个人观点,不代表本平台的立场和观点。本文章仅供信息分享,不构成对任何人的任何投资建议。用户与作者之间的任何争议,与本平台无关。如网页中刊载的文章或图片涉及侵权,请提供相关的权利证明和身份证明发送邮件到support@aicoin.com,本平台相关工作人员将会进行核查。


