From October 22 to 24, 2024, the BRICS Summit will be held in Kazan, Russia. This is the first summit since the BRICS countries expanded from 5 to 9 member states in January. In addition to political issues, Russian President Putin stated that the dominant role of BRICS in the global economy will continue to strengthen, criticizing the unilateral economic sanctions imposed by Western countries against Russia, Iran, and other BRICS nations.
At the same time, he proposed the establishment of a BRICS food exchange and a BRICS investment platform, which will help BRICS countries bypass the US-led global financial system for international trade. Although he did not mention whether cryptocurrencies would be used for trade among BRICS member countries, in September, Russia officially allowed the use of cryptocurrencies for cross-border transactions and trading. A series of policies reflect the country's positive shift in attitude, viewing cryptocurrencies as a significant tool to bypass Western sanctions and even for de-dollarization.
In terms of cryptocurrency, Bitcoin hit a low of $65,251 at 2 AM on the 24th, reaching its lowest point in a week. However, it quickly rebounded, fluctuating upward, and by around 5 AM on the 25th, it reached the highest point of the week so far at $68,850. Unfortunately, the suggestion given in yesterday's article was stopped out, and at the time of writing, it has slightly retreated to $68,278, with an increase of about 2.24% in the past 24 hours.
Bitcoin 4-Hour Chart
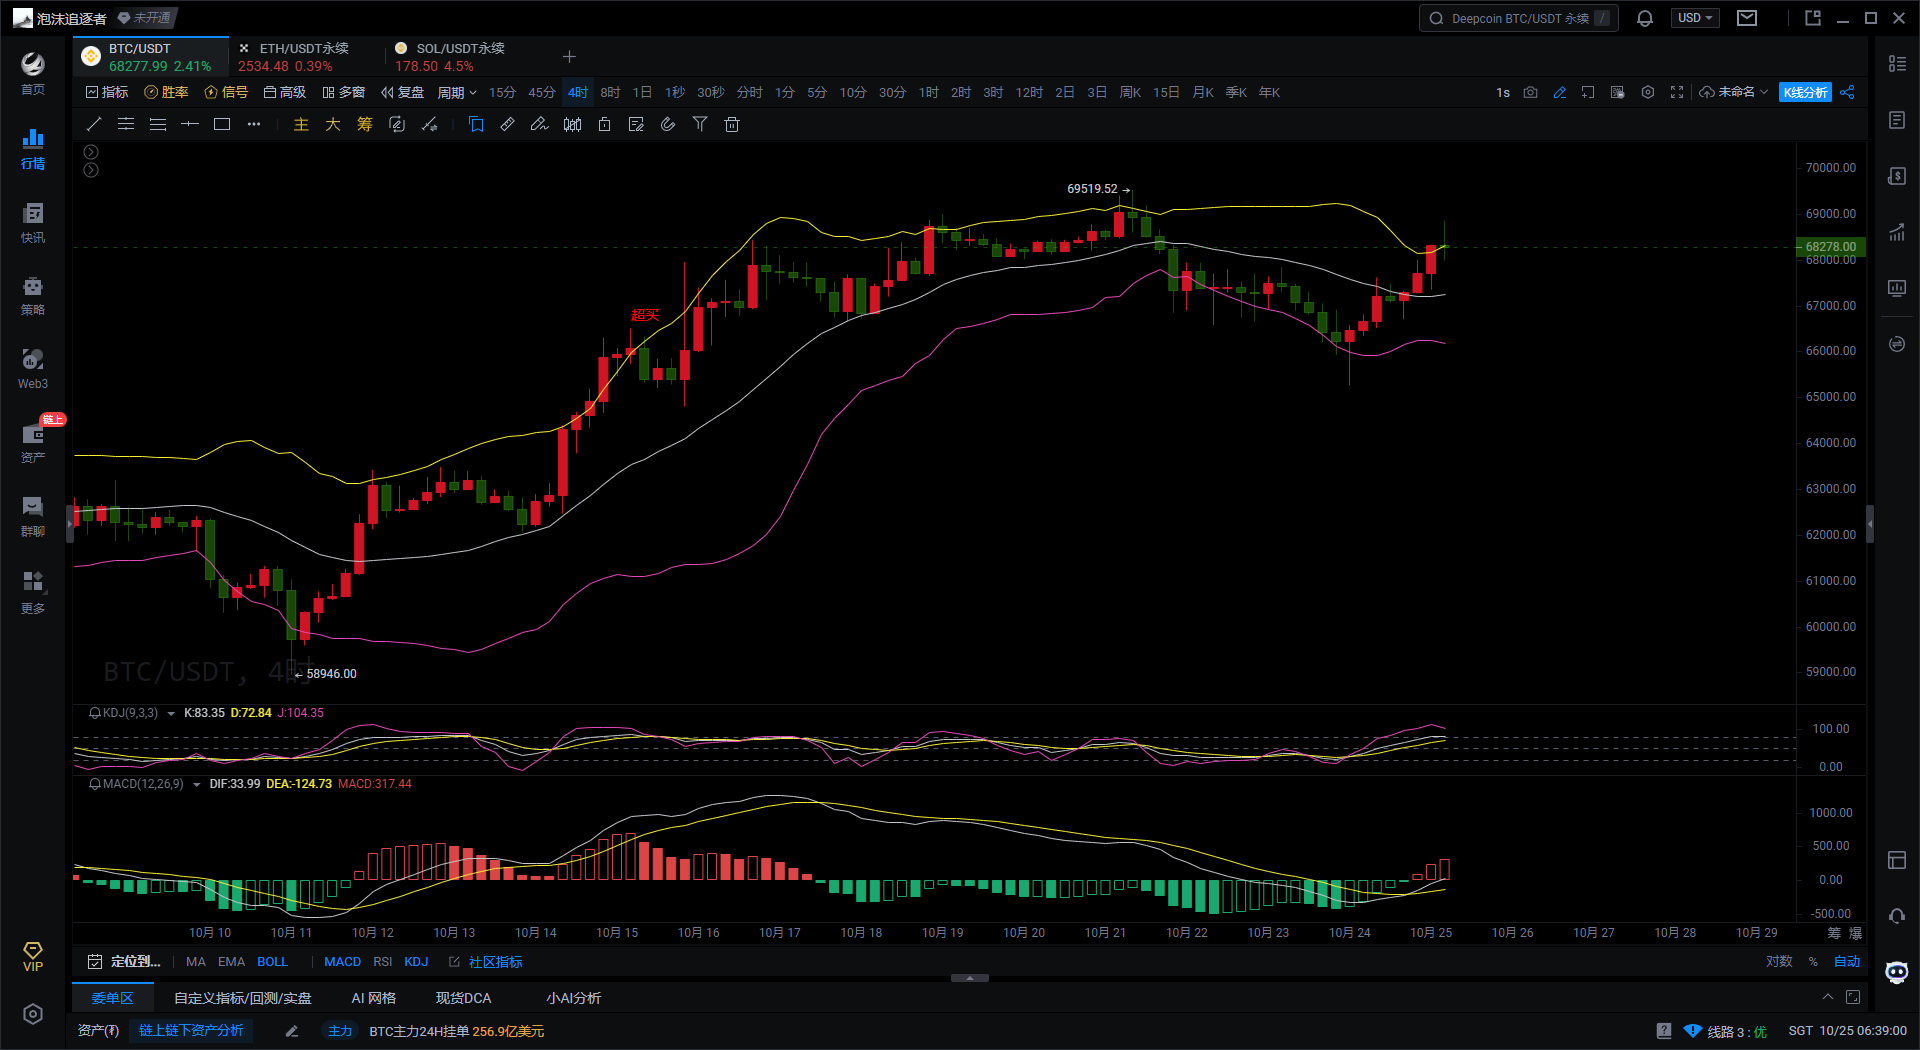
First, according to the Bollinger Bands indicator on the Bitcoin 4H chart, after the price touched the upper band, it quickly retreated, indicating that the current market is in an upward trend. However, the upper band exerts some pressure on the price. If the price continues to operate above the upper band, there will be further upward potential. Conversely, if it encounters resistance at the upper band and retreats, it may pull back to the middle or even lower band.
Second, based on the KDJ indicator on the Bitcoin 4H chart, the K and D lines are in the high region, and the J line is already in the overbought area, suggesting a potential need for a pullback in the short term. If the KDJ indicator remains stagnant at a high level, the price may continue to rise. However, if the KDJ indicator forms a death cross downward, the pullback pressure will increase.
Finally, according to the MACD indicator on the Bitcoin 4H chart, the DIF and DEA lines are operating below the zero axis and have formed a golden cross, accompanied by the MACD histogram turning from green to red and gradually expanding, indicating that bullish momentum is strengthening, suggesting further upward potential for the price.
Bitcoin 1-Hour Chart
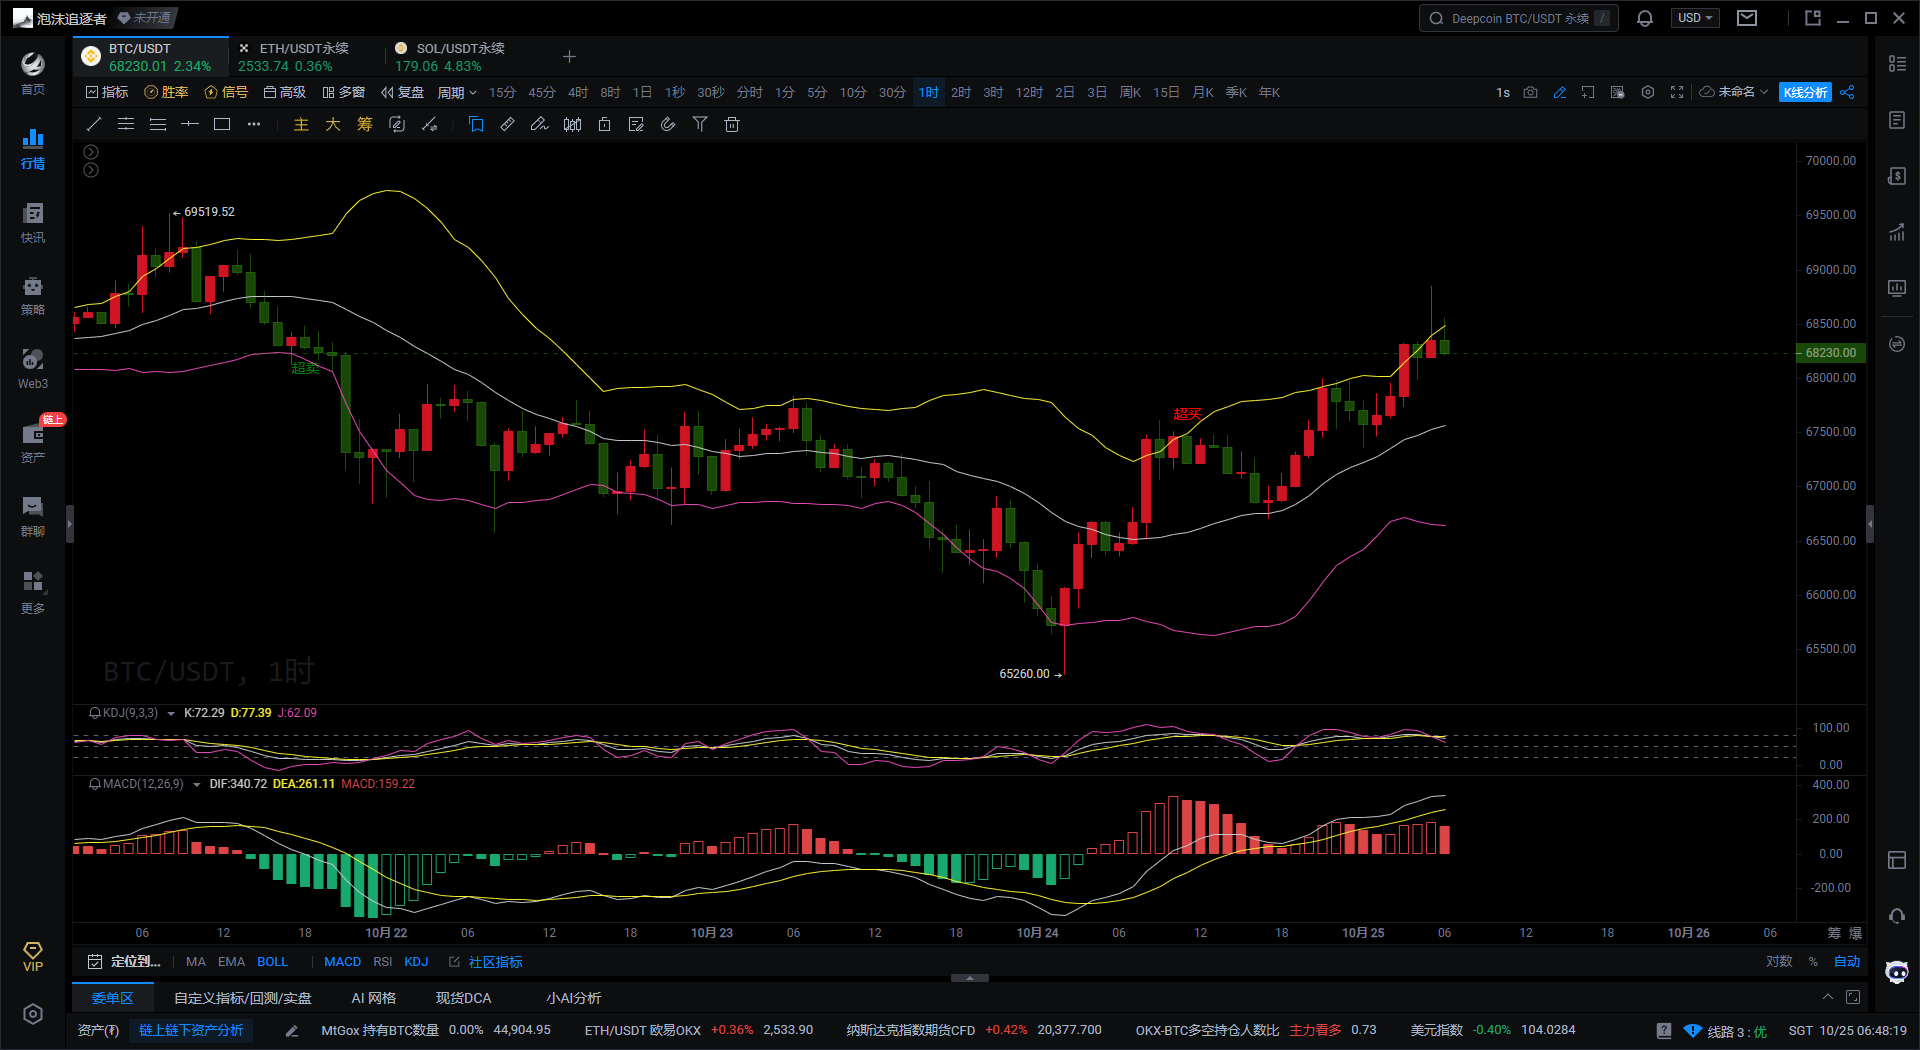
First, according to the Bollinger Bands indicator on the Bitcoin 1H chart, the current price is near the upper band, indicating that the market is in a strong upward trend, but it is approaching the upper band, suggesting potential resistance in the short term. If the price fails to stabilize effectively above the upper band, a pullback may occur, with the middle band becoming a short-term support level.
Second, based on the KDJ indicator on the Bitcoin 1H chart, the K and D lines are close to the overbought area, and the J line is already in the overbought area, indicating a risk of short-term overbought conditions and potential pullback pressure. If the KDJ indicator forms a death cross at a high level, the likelihood of a pullback will increase.
Finally, according to the MACD indicator on the Bitcoin 1H chart, the DIF and DEA lines have formed a golden cross signal, indicating that bullish sentiment in the market continues. However, the MACD red histogram is gradually shortening, suggesting that upward momentum is weakening, and caution is needed for pullback risks in the short term.
In summary, from the Bitcoin 4-hour chart, the likelihood of continued upward movement is high, especially supported by the MACD golden cross and the performance of the Bollinger Bands upper band. However, due to the KDJ being in the overbought area, a pullback may occur in the short term. From the Bitcoin 1-hour chart, the market remains in an upward trend, but faces some overbought pressure in the short term, especially as both the KDJ and MACD indicators indicate a slowdown in upward momentum, suggesting a potential slight pullback.
Based on the above analysis, the following suggestions are provided for reference:
Buy Bitcoin on a pullback to $67,250-$67,500, with a target of $68,300-$68,500 and a stop loss at $67,000.
Giving you a 100% accurate suggestion is not as valuable as providing you with the right mindset and trend. After all, teaching someone to fish is better than giving them fish. The focus is on the mindset, grasping the trend, and planning the layout and position. What I can do is use my practical experience to help you make investment decisions and manage operations in the right direction.
Writing time: (2024-10-25, 06:40)

(Written by - Master of Currency) Disclaimer: Online publication has delays, and the above suggestions are for reference only. The author is dedicated to research and analysis in the fields of Bitcoin, Ethereum, altcoins, forex, stocks, etc., with years of experience in the financial market and rich practical operation experience. Investment carries risks, and caution is needed when entering the market. For more real-time market analysis, please follow the official account of Master of Currency for discussion and exchange.
免责声明:本文章仅代表作者个人观点,不代表本平台的立场和观点。本文章仅供信息分享,不构成对任何人的任何投资建议。用户与作者之间的任何争议,与本平台无关。如网页中刊载的文章或图片涉及侵权,请提供相关的权利证明和身份证明发送邮件到support@aicoin.com,本平台相关工作人员将会进行核查。


