Conveying the way of trading, enjoying a wise life.

If we cannot clearly see the weekly price chart of Bitcoin and only look at the daily chart or even smaller time frames, it will inevitably cause inner panic during the downward process. Throughout this week and for a long time, we have emphasized that Bitcoin needs to form a weekly double golden cross resonance. After the establishment of the double golden cross resonance pattern, Bitcoin has also reached a strong resistance level of $69,000, which indicates a serious divergence at $69,000. Regardless of whether we look at the weekly or daily chart, there is a need for further pullback at this position. The support we mentioned is $56,500. Yesterday, it was just slightly below the five-week moving average, close to $65,200. Therefore, at the position of $65,600, my view is that it is very likely to stop and then halt the decline.
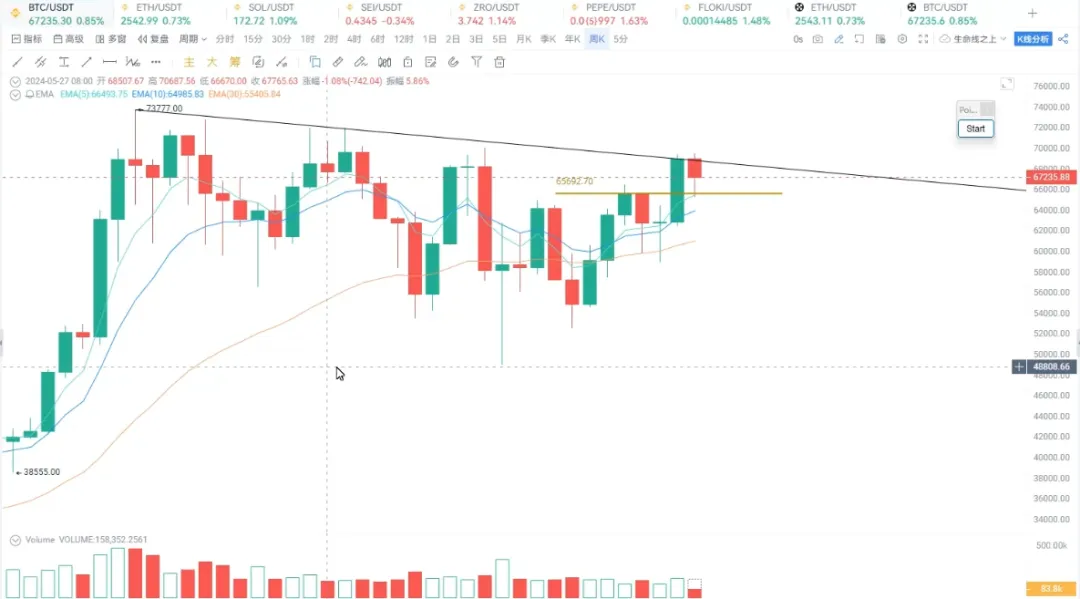
If it continues to decline, it is very likely to form a bearish divergence at the daily level. We find that the price of Bitcoin has reached a new high, but the corresponding indicator energy bars have not created a new high. Therefore, excessive decline will trigger a bearish divergence at the daily level for Bitcoin. Once a divergence occurs, it will lead to a technical sell-off. So, Bitcoin formed a hammer candlestick yesterday on the daily chart, which corresponds to the 30-day moving average and appears to be a bearish candle, but is actually leaning towards a bullish candle.
In this regard, the corresponding volume has not shown a significant increase, which can be considered as a measure of volume expansion. However, at this point, we still need to pay attention to the daily chart, specifically today's K-line movement, and whether it can stand above the 5-day moving average. If it stands above the 5-day moving average, it will aim to attack $69,000, thus welcoming a corresponding turning point, and it will not produce a daily divergence pattern again. This would be an evolution in a positive direction. What if it forms a divergence? We must pay attention to controlling our positions. This is the price trend and analysis of Bitcoin. The current decline encountering a strong rebound is also within expectations.

In the last video, we mentioned ETH and SOL. It is clear that the price trend of SOL is very similar to that of Bitcoin, both forming a double golden cross pattern.
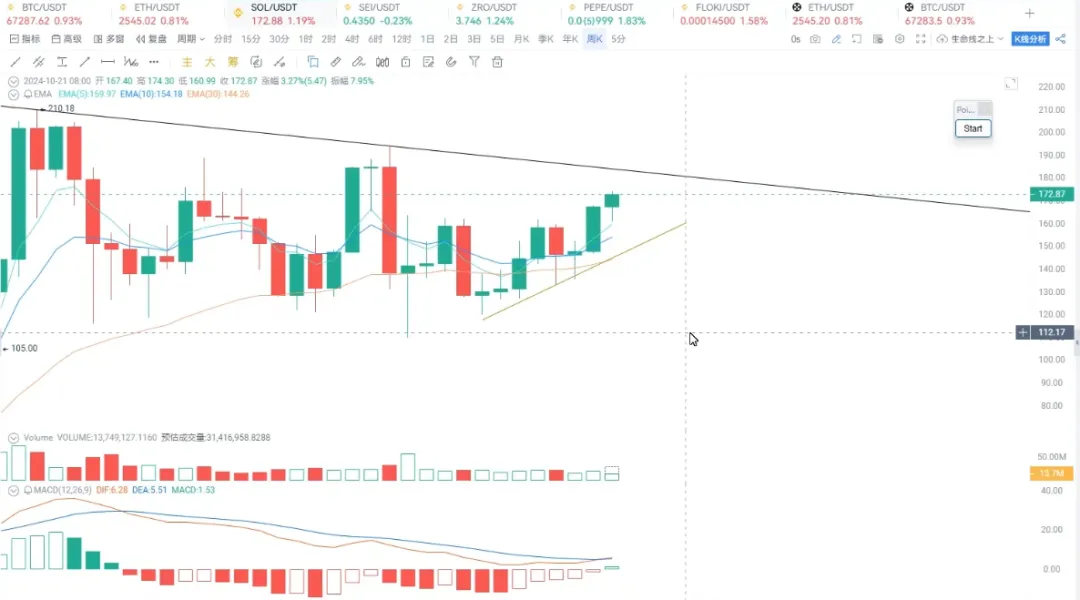
During this adjustment process at the daily level, SOL's trend has formed a multi-day spiral, also forming a multi-day spiral at a high position. Although there is a divergence between bulls and bears, the bulls still dominate, mainly because it has not broken below the five-day moving average. Looking at the corresponding daily indicators, the energy bars are continuously expanding. Therefore, SOL's trend is obviously stronger than that of ETH.

ETH's price has dropped from a high of $2,760, not only breaking below the potential upper boundary of a converging triangle but also falling below $2,680. Yesterday's spike basically touched the upward trend line. Therefore, ETH's price is indeed concerning and very disappointing.
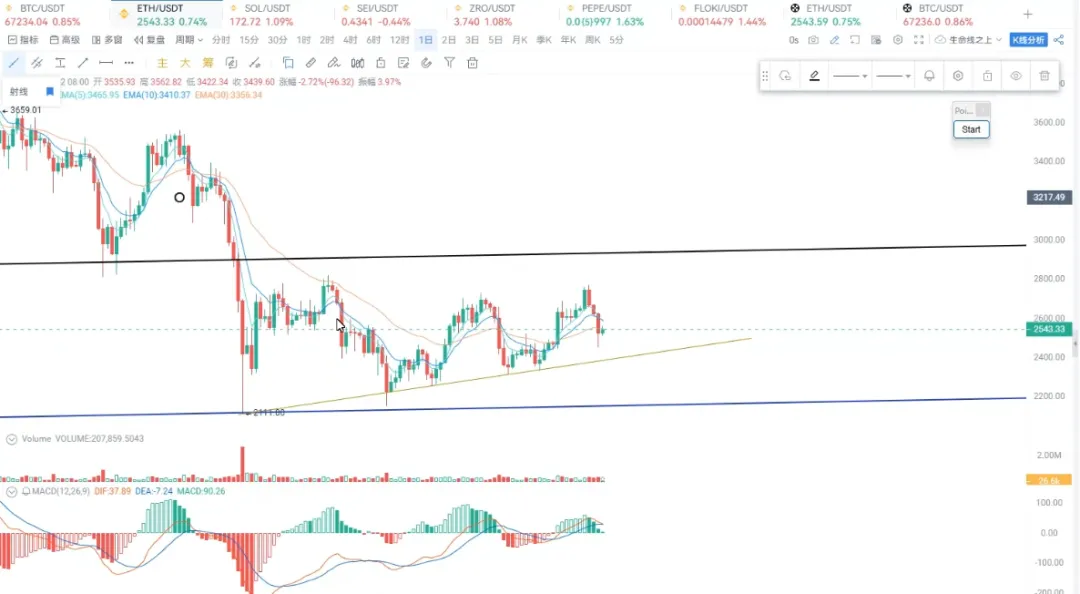
Mainly from the perspective of the larger cycle, ETH has not really broken out. The direction of the 30-week moving average has been downward, so this place has become an important resistance, which is understandable and reflects the characteristics shown in technical analysis. Compared to SOL, at the weekly level, it has already stood above the 30-week moving average. So from this perspective, if we have to choose between ETH and SOL, SOL is definitely the preferred direction. Of course, whether ETH will show a catch-up later, my view is that it will, provided that the overall market must stabilize below for a potential explosive upward movement.
For more information, you can contact our assistant and join the VIP group.
免责声明:本文章仅代表作者个人观点,不代表本平台的立场和观点。本文章仅供信息分享,不构成对任何人的任何投资建议。用户与作者之间的任何争议,与本平台无关。如网页中刊载的文章或图片涉及侵权,请提供相关的权利证明和身份证明发送邮件到support@aicoin.com,本平台相关工作人员将会进行核查。


