Evening market trends: How might it go? Little A analyzes for you!
Welcome to the group chat to ask Little A for more analysis: jv.mp/JaQ0CE
APE
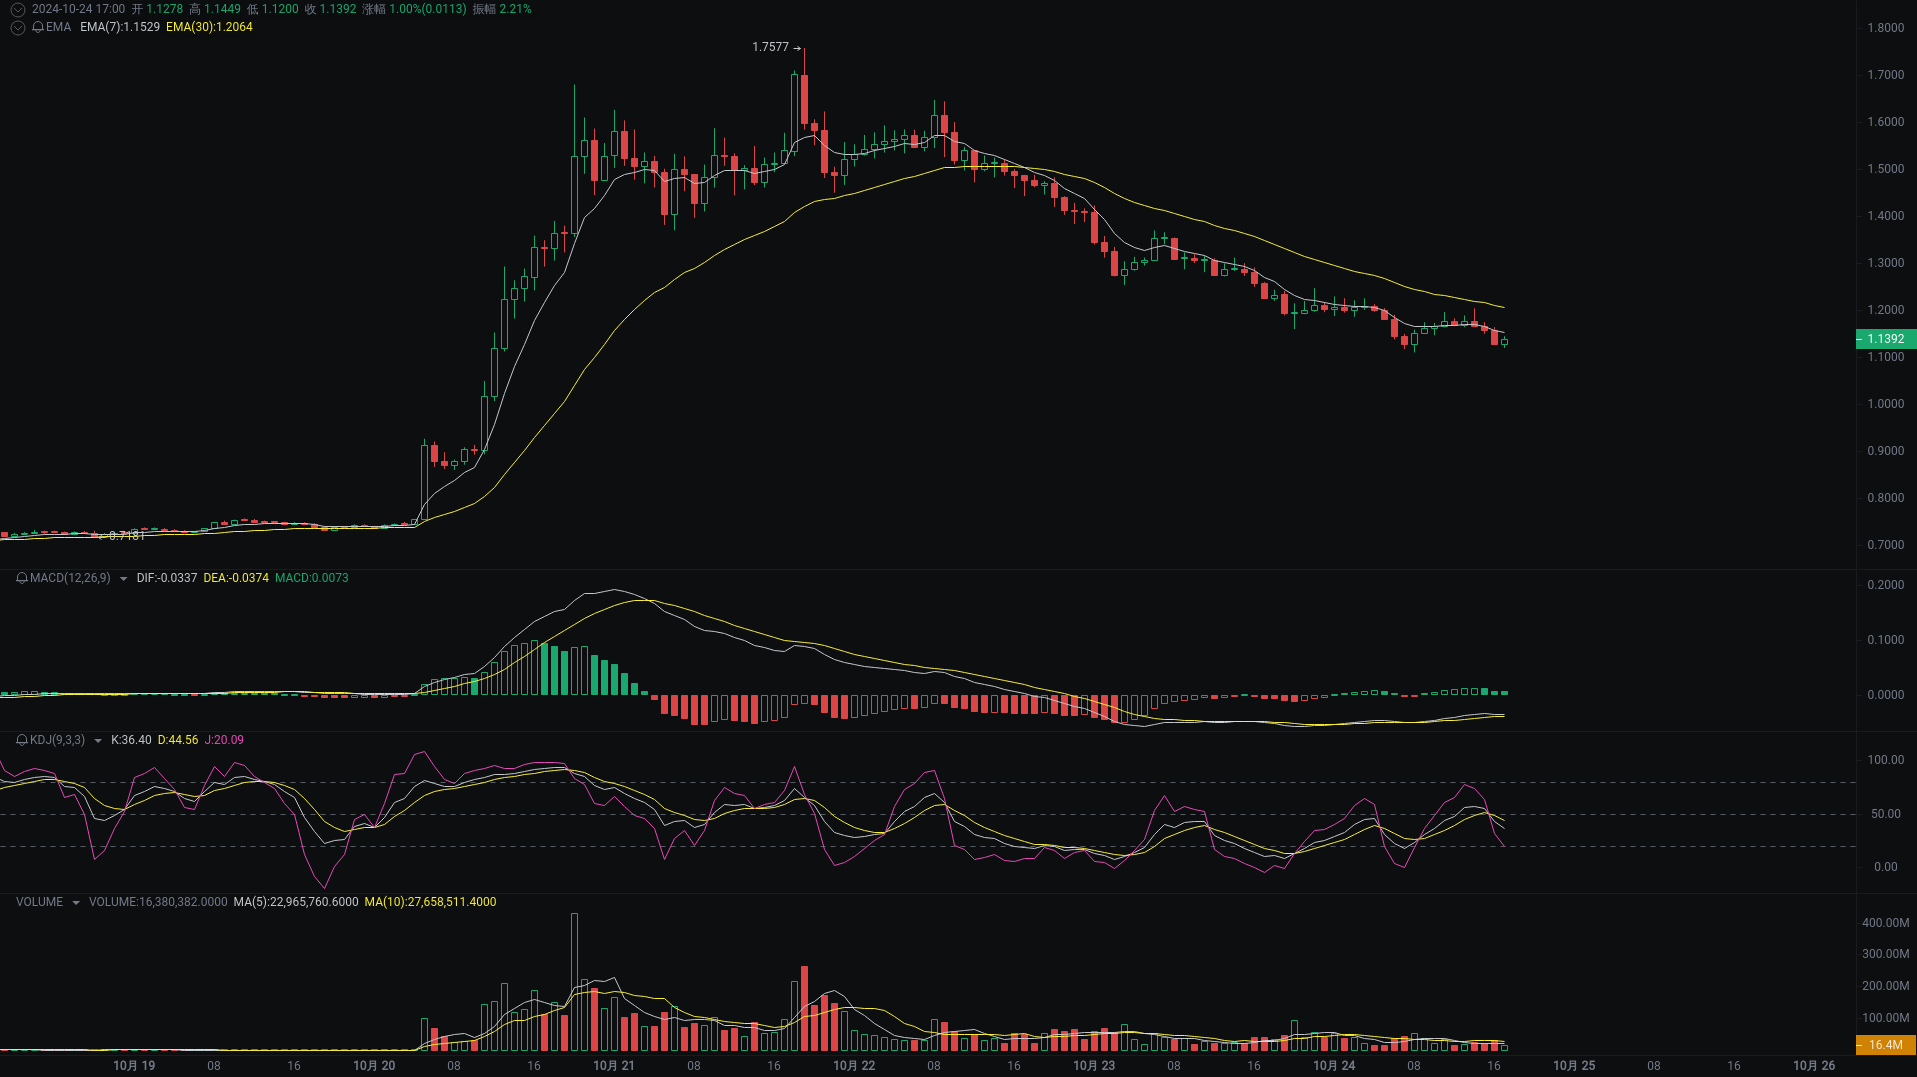
APE's 1-hour price trend: Sideways.

This is a 1-hour Binance APE/USDT candlestick chart, with the latest price at: 1.1392 USDT, including EMA, MACD, KDJ, and volume indicators.
【Buy and Sell Points】
Buy Point One: 1.1500 USDT (recent candlesticks have shown long lower shadows near this price level, indicating support)
Buy Point Two: 1.1300 USDT (the lowest price around 1.1105 is a strong support area, leaving enough space to absorb potential downward movements)
Long Stop Loss Point: 1.1200 USDT (below Buy Point Two and considering the lowest price below 1.1105, providing a buffer for price fluctuations)
Sell Point One: 1.1700 USDT (the short-term EMA(7) is in a downtrend and the current price has already broken below, which can be seen as initial resistance)
Sell Point Two: 1.1900 USDT (close to the 30-period EMA, longer-term moving averages often serve as stronger resistance)
Short Stop Loss Point: 1.2100 USDT (above Sell Point Two, leaving appropriate space to avoid triggering the stop loss due to minor rebounds)
【Price Trend Analysis】
Candlestick Patterns:
- Recent candlesticks show increased price volatility, especially between 22:00 on October 23 and 08:00 on October 24, where there was a significant price drop. In the latest few hours, the candlestick bodies have gradually shortened, indicating a balance of power between buyers and sellers.
- Between 20:00 on October 23 and 07:00 on October 24, there were multiple long lower shadows, suggesting a certain level of support in this range.
Technical Indicators:
- In the MACD indicator, both DIF and DEA are negative, and the MACD histogram shows an upward trend (turning from negative to positive), which may indicate a potential rebound or trend change.
- The KDJ indicator's J value was in the oversold area (20.09) at 17:00 on October 24, while the K and D lines are also relatively low, which is often seen as a potential buy signal.
- The EMA indicator shows that the 7-period EMA (1.1529) has fallen below the 30-period EMA (1.2064), indicating a bearish market trend in the short term.
Volume:
- Volume increased significantly during the price drop, such as at 20:00 on October 23, while the price experienced a sharp decline, which may indicate heavy selling pressure.
- In the last few hours, volume has decreased, accompanied by price stability, which may suggest the market is searching for direction.
goat
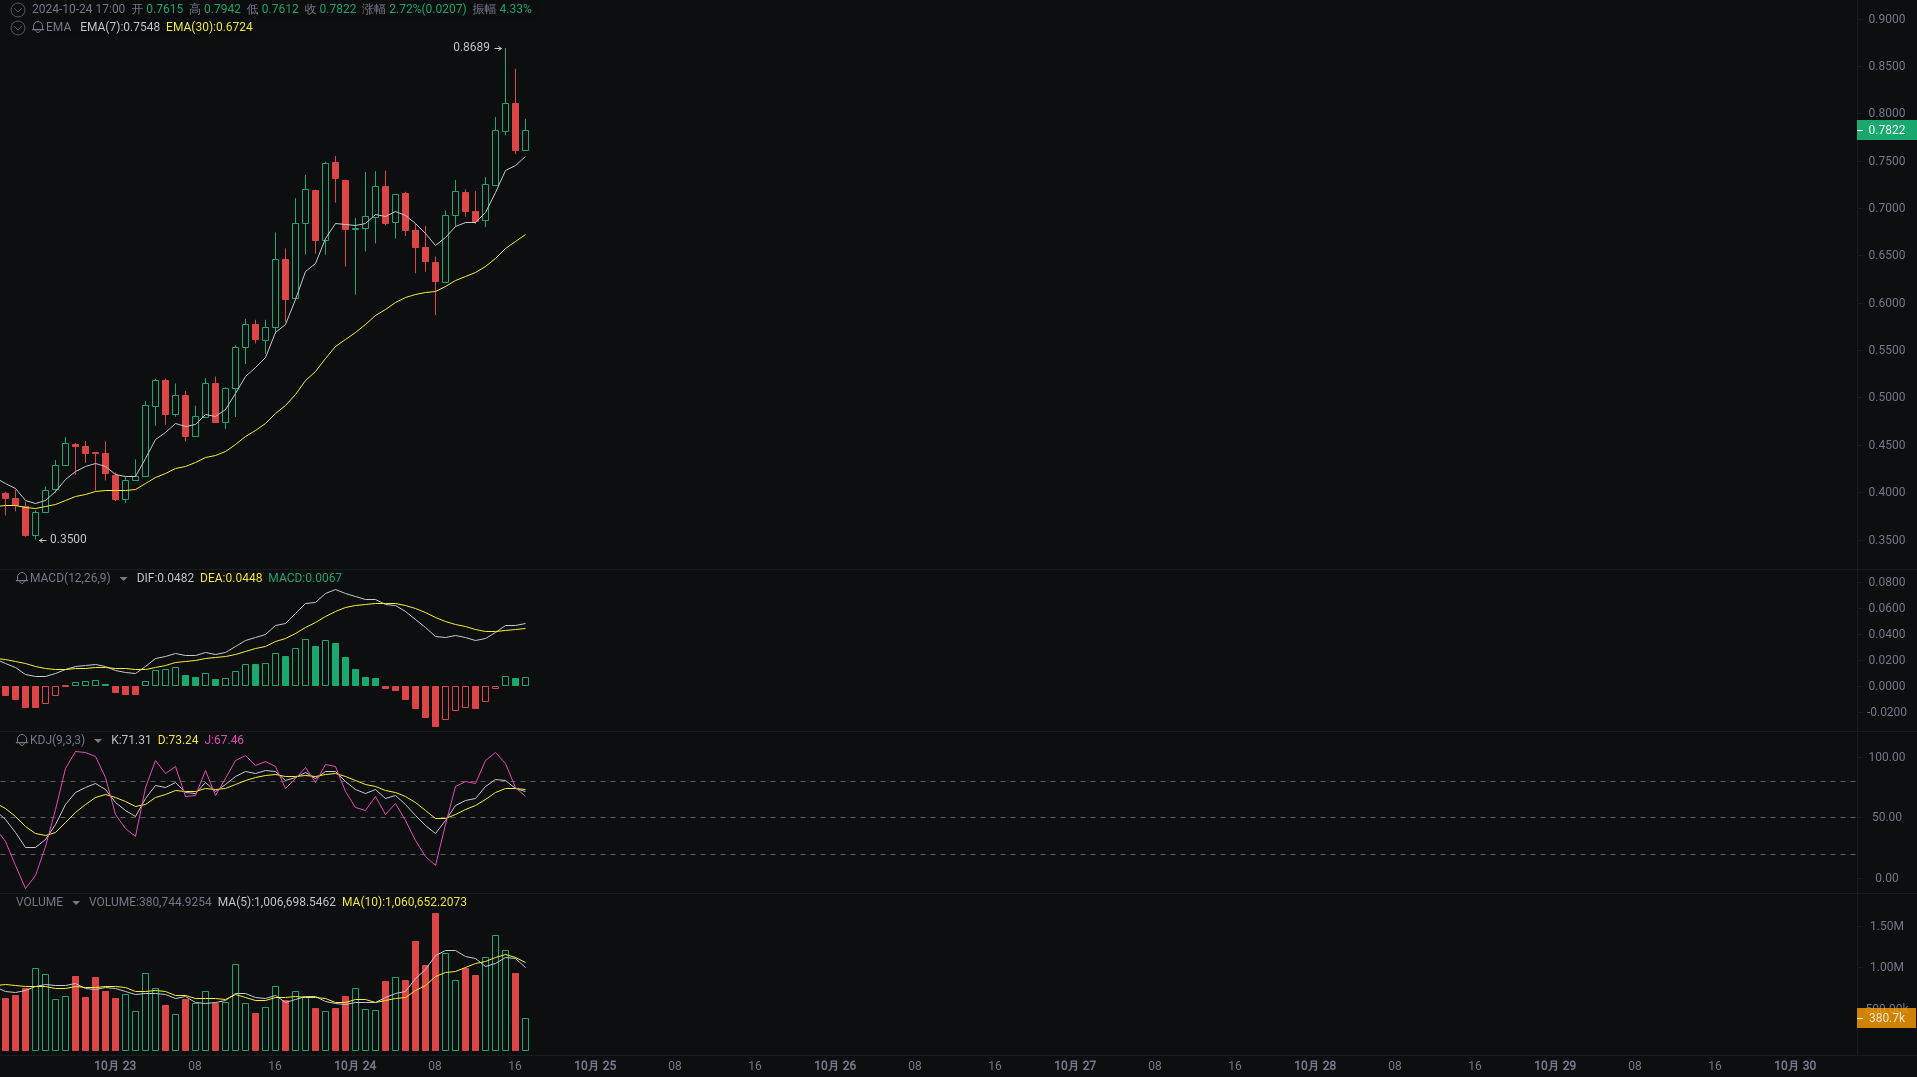
goat's 1-hour price trend: Up.

This is a 1-hour HTX goat/USDT candlestick chart, with the latest price at: 0.7822 USDT, including EMA, MACD, KDJ, and volume indicators.
【Buy and Sell Points】
Buy Point One: 0.76 USDT (considering that EMA(7) is above EMA(30), and MACD shows slight upward momentum, one can consider entering when the price retraces to recent support levels)
Buy Point Two: 0.72 USDT (if the price continues to drop, look for buying opportunities near lower support levels, while this position is close to the opening price at 14:00 on October 24, which may have buying support)
Long Stop Loss Point: 0.70 USDT (set below Buy Point Two, leaving enough space to avoid triggering the stop loss due to minor fluctuations, also a psychological key level and recent low area)
Sell Point One: 0.80 USDT (the current price is in a rebound phase, one can reduce positions or take profits before approaching the recent high of 0.8104 USDT)
Sell Point Two: 0.82 USDT (if market sentiment continues to improve and breaks the previous high, one can reduce positions or exit completely at this level)
Short Stop Loss Point: 0.84 USDT (above Sell Point Two, and higher than the highest price of 0.8689 USDT at 15:00 on October 24, set at a relatively safe distance for caution)
【Price Trend Analysis】
Candlestick Patterns:
- Recent candlesticks show significant price volatility, with a long upper shadow candlestick appearing at 15:00 on October 24, indicating heavy selling pressure at high levels. In the following hours, the price retreated slightly, but the latest closing price is slightly higher than the opening price, forming a short bullish candlestick, suggesting buyers are trying to take control of the market.
- Overall, the price has gradually risen from the low of 0.35 on October 23 to the current level, showing a certain degree of rebound.
Technical Indicators:
- In the MACD indicator, DIF remains above DEA, and the MACD histogram is positive, although the value is not large, it still indicates recent upward momentum.
- In the KDJ indicator, both K and D values are above 70, while the J value has slightly retreated to 67.46, which may indicate an overbought state, requiring caution for potential short-term pullback risks.
- The EMA indicator shows that the 7-period EMA (0.7548) is above the 30-period EMA (0.6724), indicating that the short-term moving average has crossed above the long-term moving average, supporting the recent upward trend.
Volume:
- The latest period's volume of 380744.9254 has decreased compared to the previous period's 933227.8195, which may indicate weakening upward momentum.
- However, considering that the overall volume has not significantly decreased compared to the past few days, the current price level may still have some support.
SOL
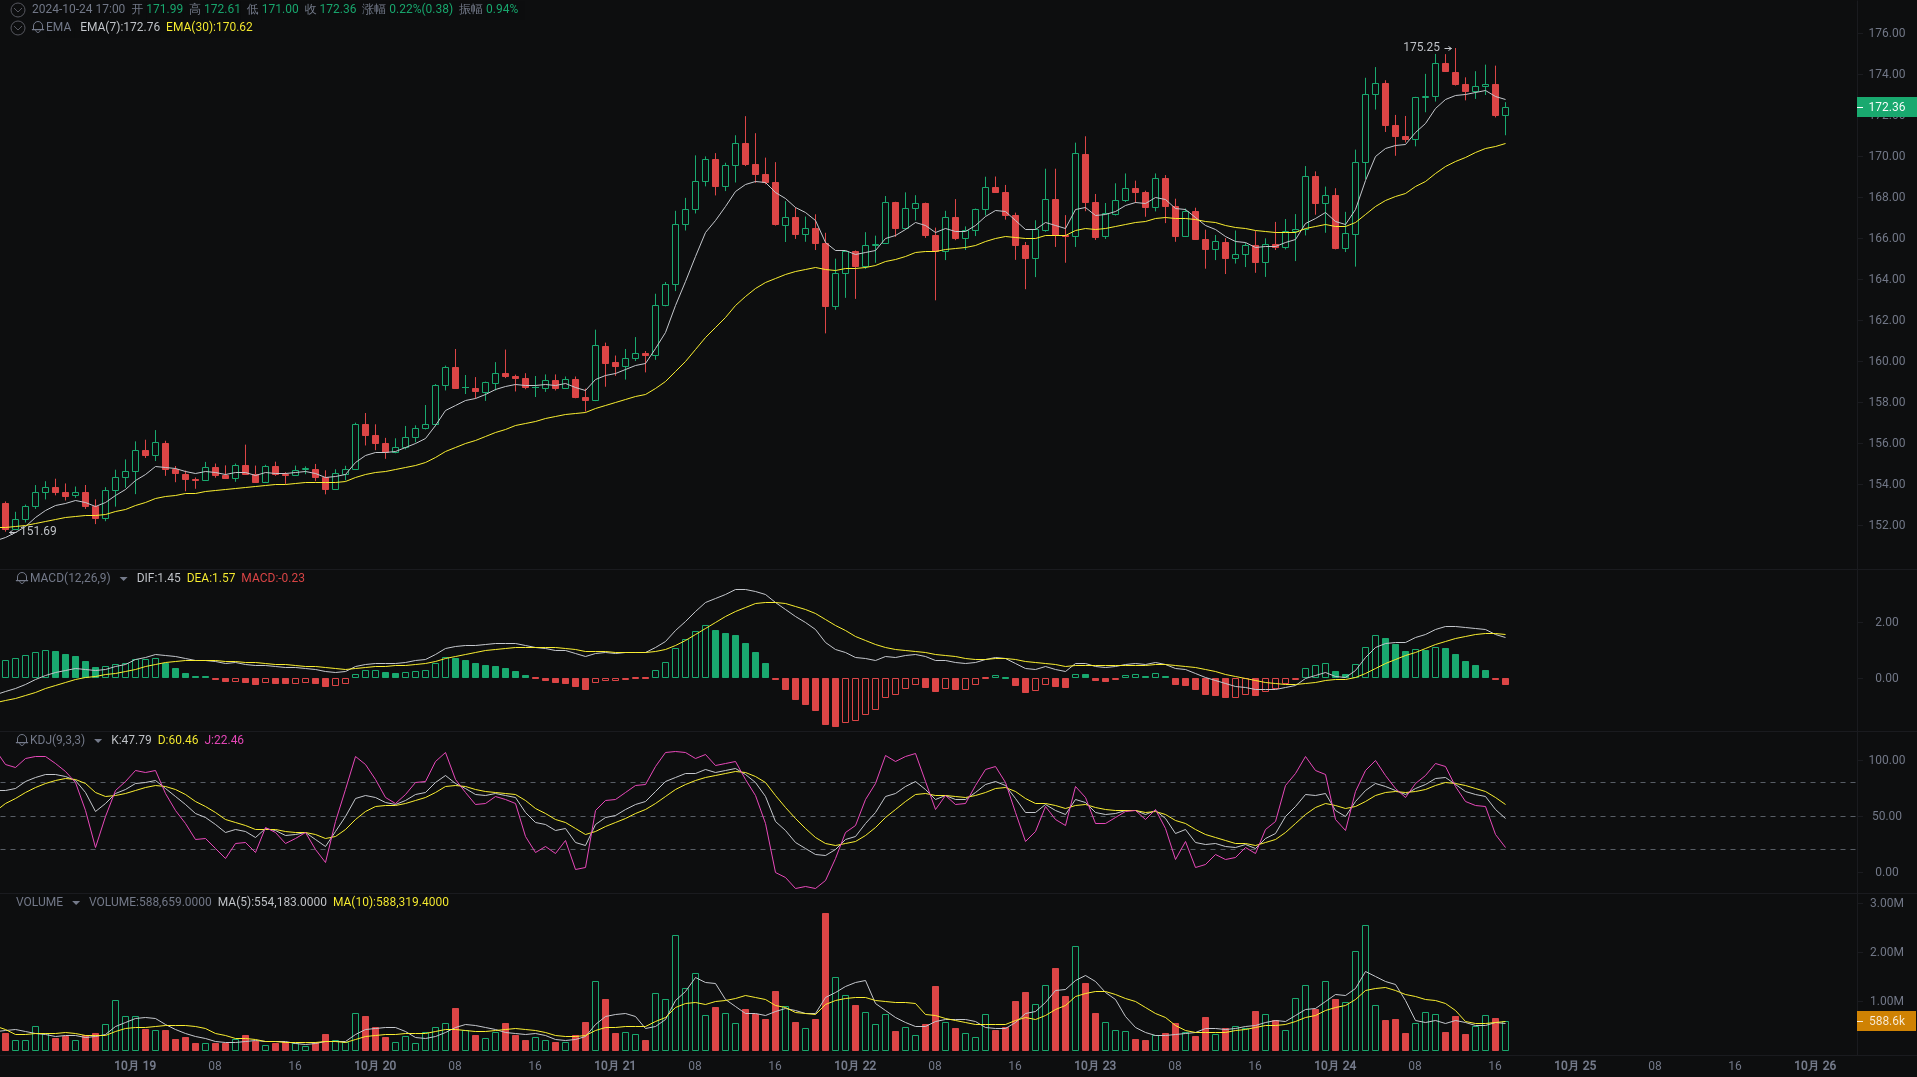
SOL's 1-hour price trend: Sideways.

This is a 1-hour Binance SOL/USDT candlestick chart, with the latest price at: 172.36 USDT, including EMA, MACD, KDJ, and volume indicators.
【Buy and Sell Points】
Buy Point One: 170.00 USDT (near EMA(30), previously a support level, showing signs of price rebound)
Buy Point Two: 168.00 USDT (below the recent multiple hour candlestick lows, providing a larger safety margin)
Long Stop Loss Point: 166.50 USDT (below Buy Point Two, leaving enough space to avoid triggering due to minor fluctuations)
Sell Point One: 175.00 USDT (close to the highest price, may face selling pressure leading to a pullback)
Sell Point Two: 178.00 USDT (exceeding the highest point in the current period, expecting further increases after a breakout)
Short Stop Loss Point: 180.00 USDT (above Sell Point Two, setting a higher stop loss for caution to prevent continuous upward movement)
【Price Trend Analysis】
Candlestick Patterns:
- Recent candlesticks show significant price volatility, with a series of long upper shadows appearing between 06:00 and 11:00 on October 24, indicating that the market is facing selling pressure at high levels.
- Between 17:00 and 22:00 on October 23, the price gradually rose from the low point, forming a brief upward trend.
Technical Indicators:
- MACD Indicator: The latest MACD value is negative (-0.23), and DIF is below DEA, indicating potential downward pressure in the short term.
- KDJ Indicator: The J value (22.46) is far below the K value (47.79) and D value (60.46), which may indicate future rebound potential.
- EMA Indicator: The closing price (172.36) is slightly below EMA(7) (172.76) but above EMA(30) (170.62), indicating a relatively bullish trend in the medium-short term, but caution is needed for pullback risks.
Volume:
- Volume began to gradually decrease after peaking at 03:00 on October 24, which may indicate weakening upward momentum.
- In the last few hours, volume has stabilized, with no significant increase or decrease, maintaining consistent activity among market participants.
※ All content provided by the intelligent analysis assistant Little A, for reference only and does not constitute any investment advice!
Little A Intelligent Analysis is AICoin's industry-leading intelligent analysis tool, easily helping you interpret cryptocurrency trends, analyze indicator signals, and identify entry and exit points. Experience it on the APP or PC.
PC & APP Download: https://www.aicoin.com/download
免责声明:本文章仅代表作者个人观点,不代表本平台的立场和观点。本文章仅供信息分享,不构成对任何人的任何投资建议。用户与作者之间的任何争议,与本平台无关。如网页中刊载的文章或图片涉及侵权,请提供相关的权利证明和身份证明发送邮件到support@aicoin.com,本平台相关工作人员将会进行核查。


