On Wednesday Eastern Time, the U.S. stock market opened lower and continued to decline, with all three major indices recording their largest drop in weeks, with the Nasdaq down 1.6%. By the close, the Dow Jones Industrial Average fell 0.96% to 42,514.95 points; the S&P 500 dropped 0.92% to 5,797.42 points; and the Nasdaq decreased 1.60% to 18,276.65 points.
In the cryptocurrency market, possibly affected by the downturn in U.S. stocks, the price of Bitcoin fell from a high of $67,833 around 6 AM on the 23rd to a low of $65,260 around 2 AM on the 24th, marking the lowest point since mid-month. Meanwhile, the short position near $67,800 suggested in the article on the 22nd successfully took profit at $65,600, achieving a profit of 2,200 points. As of the time of writing, Bitcoin's price has rebounded slightly, quoted at $66,641, down 1.15% in the last 24 hours.
Bitcoin 4-Hour Chart
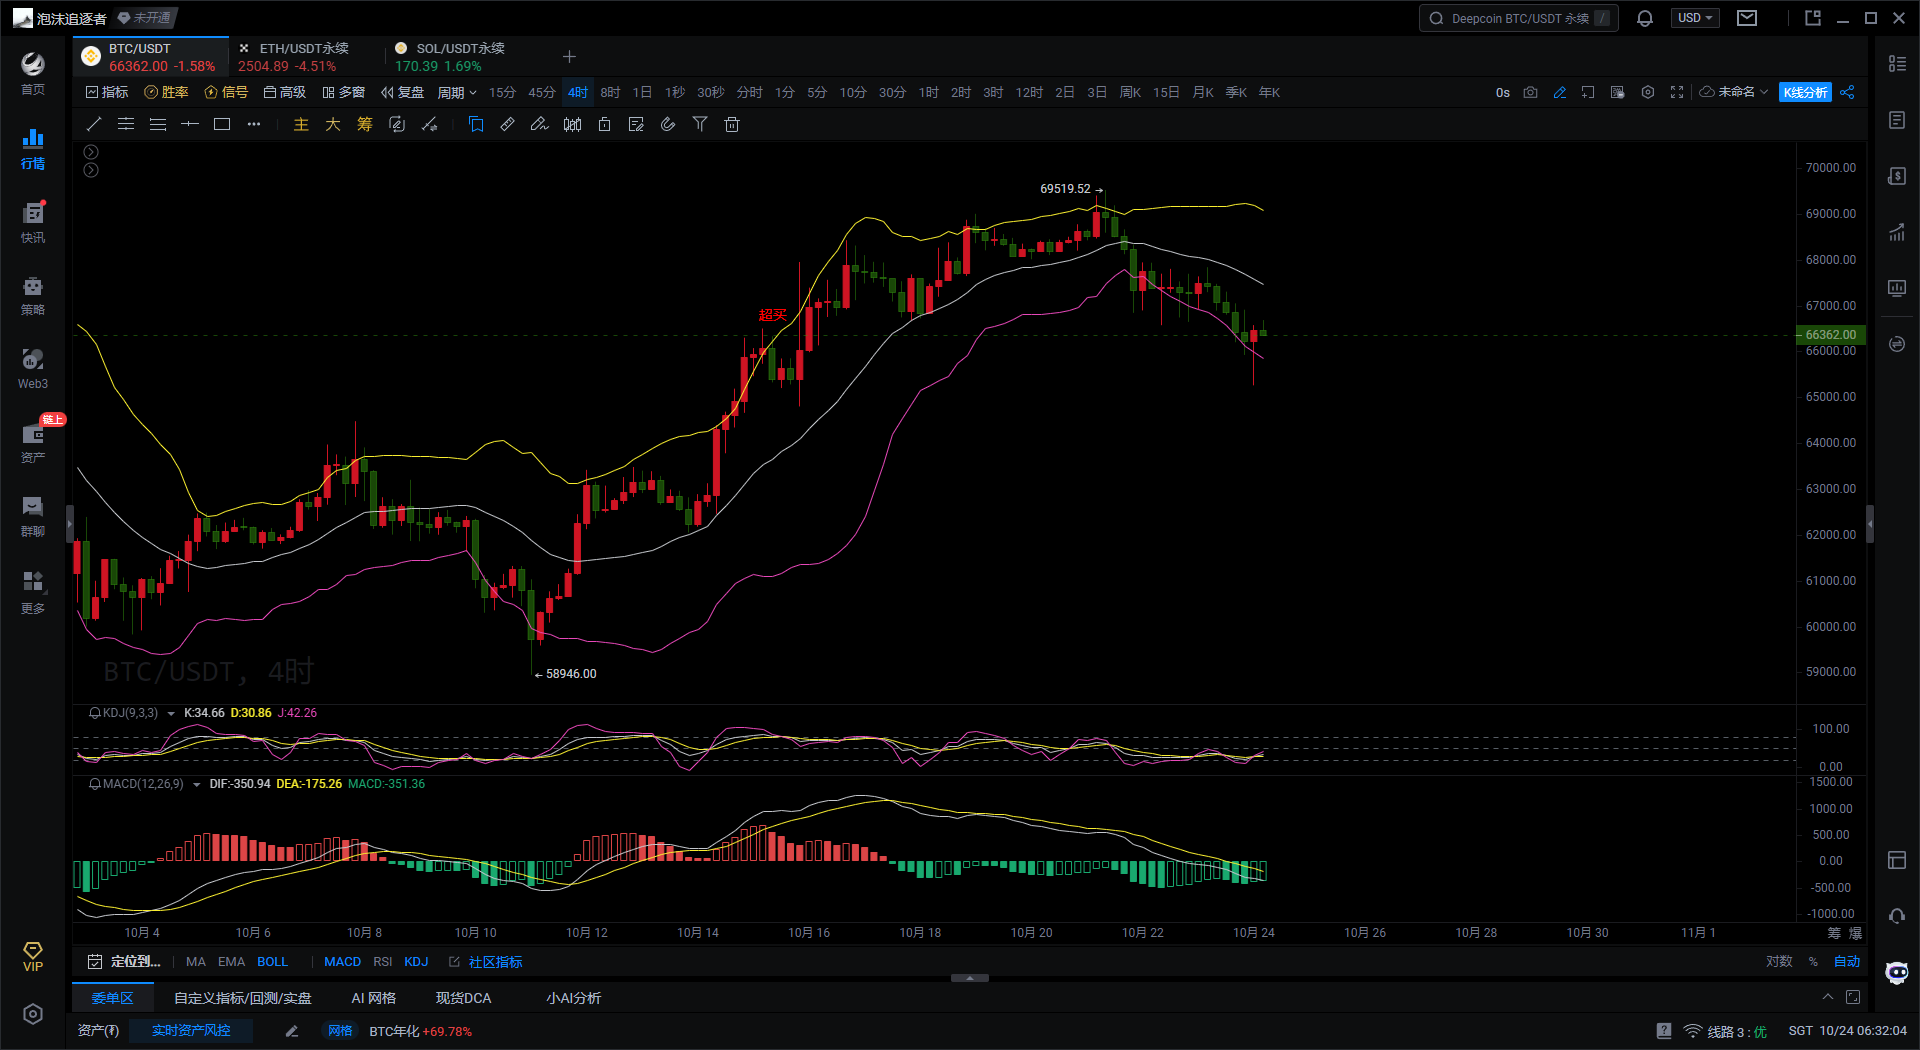
First, according to the Bollinger Bands indicator on the 4H Bitcoin chart, the current price is operating between the middle and lower bands, but is closer to the lower band, indicating that the market is currently in a bearish trend. If the price continues to move towards the lower band and breaks below it, there is a possibility of further declines. The Bollinger Bands show slight signs of expansion, suggesting that market volatility may be more intense in the future.
Second, based on the KDJ indicator on the 4H Bitcoin chart, the K-line and D-line values are in a low area, and the J-line has shown signs of rebound, indicating that the market is currently in an oversold state with a short-term need for a rebound. However, the strength of the J-line's rebound from the oversold area is still insufficient; if the K-line and D-line do not form an effective upward trend, the price may continue to oscillate or decline.
Finally, according to the MACD indicator on the 4H Bitcoin chart, the DIF line and DEA line are operating below the zero axis and have formed a death cross, indicating that the market may continue to decline in the short term. The continuation of the MACD green histogram also confirms the view of sustained short-term market decline.
Bitcoin 1-Hour Chart
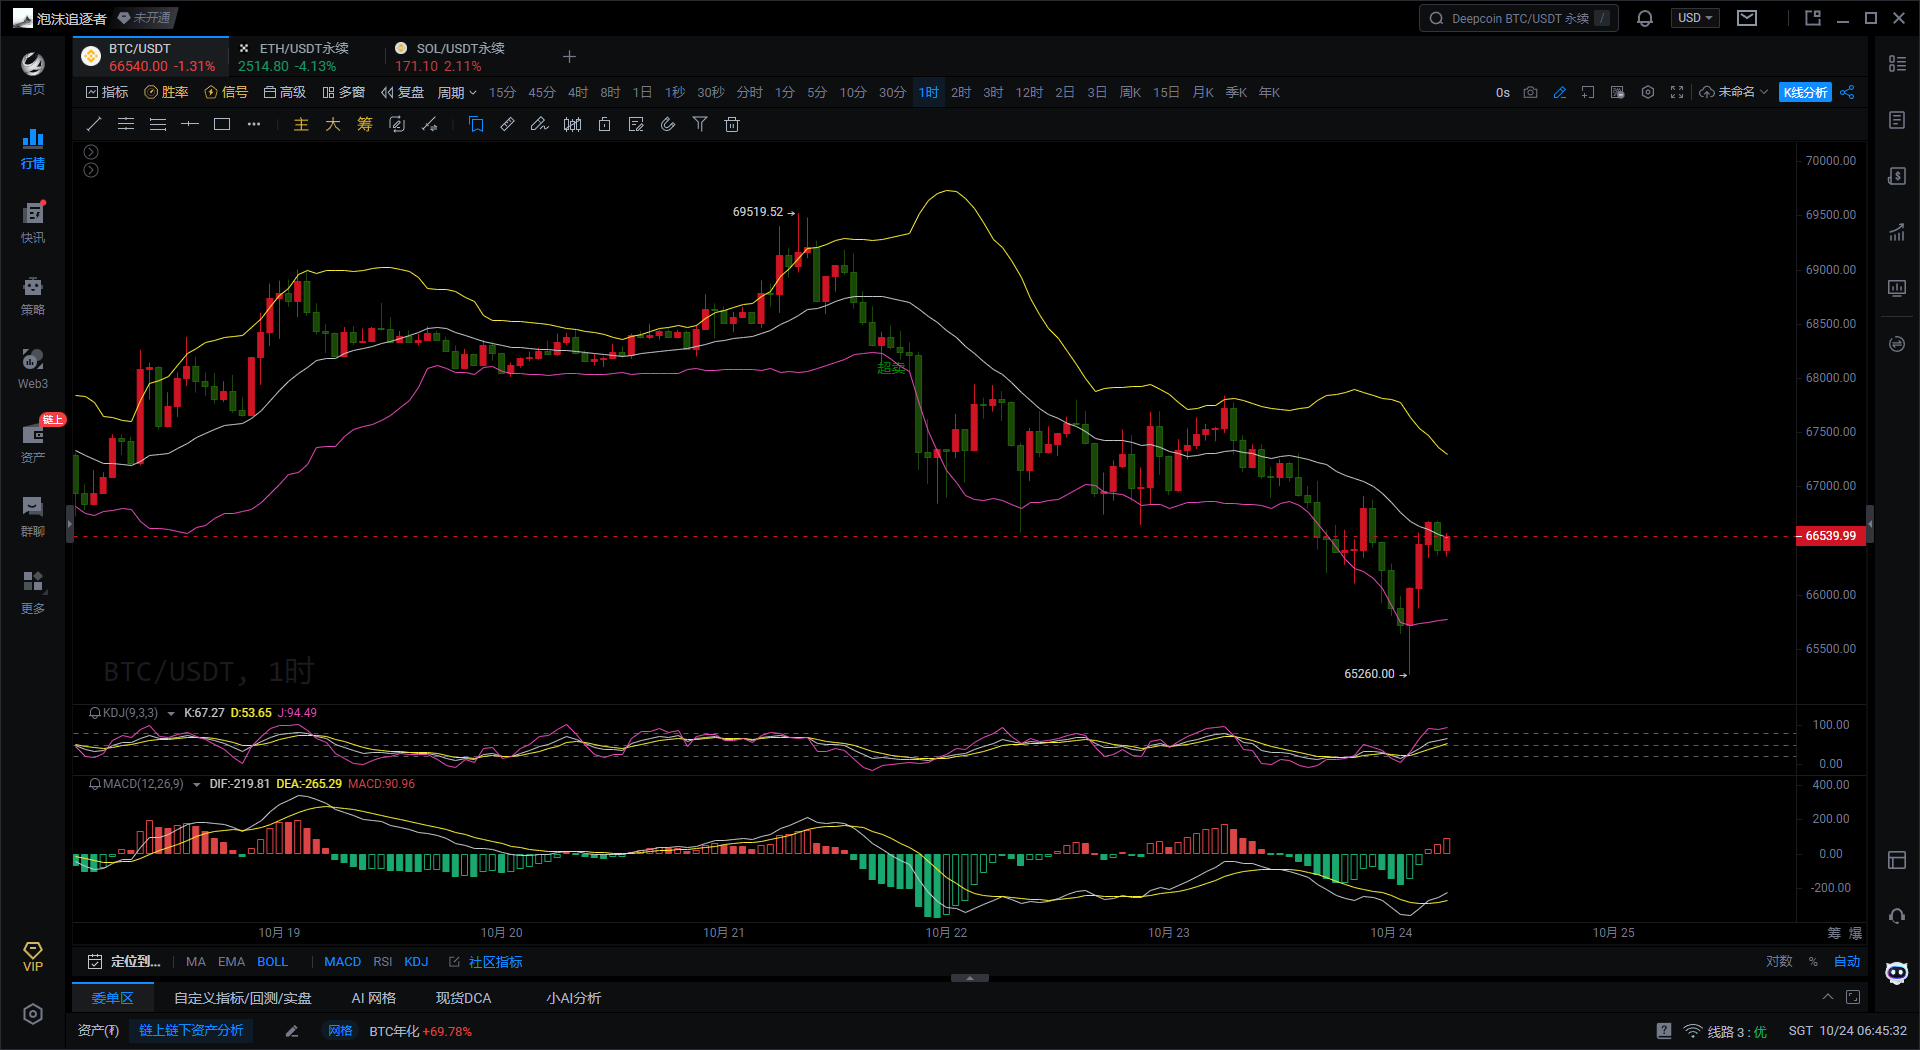
First, according to the Bollinger Bands indicator on the 1H Bitcoin chart, the price of Bitcoin began to rebound after touching the lower band and is currently close to the middle band. If the price can effectively stabilize at the middle band, it may move towards the upper band; however, if it encounters resistance at the middle band, the price will fall again.
Second, based on the KDJ indicator on the 1H Bitcoin chart, the K-line value has crossed above the D-line value, and the J-line value is also at a high level, indicating that there is a rebound force in the market in the short term. However, since the J-line value is close to the overbought area, caution is needed for short-term pullback risks, especially if the price does not break through the Bollinger Bands middle band.
Finally, according to the MACD indicator on the 1H Bitcoin chart, the MACD green histogram has started to shorten, indicating that the bearish strength is weakening. The DIF line is gradually approaching the DEA line from below and shows signs of forming a golden cross, suggesting that there may be upward momentum in the short term. If the golden cross forms, the price will have further rebound potential; however, if the golden cross does not form and the MACD green histogram grows again, the price will continue to decline.
Comprehensive Analysis: Based on the 4H Bitcoin chart, the MACD shows a death cross state, with a clear bearish trend, and there is a downward trend below the middle band of the Bollinger Bands, indicating that the market may continue to search for support levels. The KDJ is at a low level and has shown initial signs of rebound; if the price rebounds and stabilizes above the middle band of the Bollinger Bands, a short-term rebound may begin. According to the 1H Bitcoin chart, the potential golden cross of the MACD and the rebound from the lower band of the Bollinger Bands indicate that the price may rebound in the short term, but the resistance at the middle band of the Bollinger Bands may limit the height of the rebound. The KDJ is already at a high position, in an overbought state. If the price cannot effectively break through near the middle band of the Bollinger Bands, it may fall again.
In summary, the following suggestions are provided for reference:
Short Bitcoin at 66,800-67,000, targeting 65,600-65,260, with a stop loss at 67,360.
Giving you a 100% accurate suggestion is not as good as providing you with the right mindset and trend. After all, teaching someone to fish is better than giving them fish; the focus is on the mindset, grasping the trend, and planning the market layout and position. What I can do is use my practical experience to help everyone, guiding your investment decisions and management in the right direction.
Time of writing: (2024-10-24, 07:00)

(Written by - Daxian Talks Coins) Disclaimer: Online publication has delays; the above suggestions are for reference only. The author is dedicated to research and analysis in the fields of Bitcoin, Ethereum, altcoins, forex, stocks, etc., and has been involved in the financial market for many years, possessing rich practical experience. Investment carries risks; proceed with caution. For more real-time market analysis, please follow the official account Daxian Talks Coins for discussion and exchange.
免责声明:本文章仅代表作者个人观点,不代表本平台的立场和观点。本文章仅供信息分享,不构成对任何人的任何投资建议。用户与作者之间的任何争议,与本平台无关。如网页中刊载的文章或图片涉及侵权,请提供相关的权利证明和身份证明发送邮件到support@aicoin.com,本平台相关工作人员将会进行核查。


