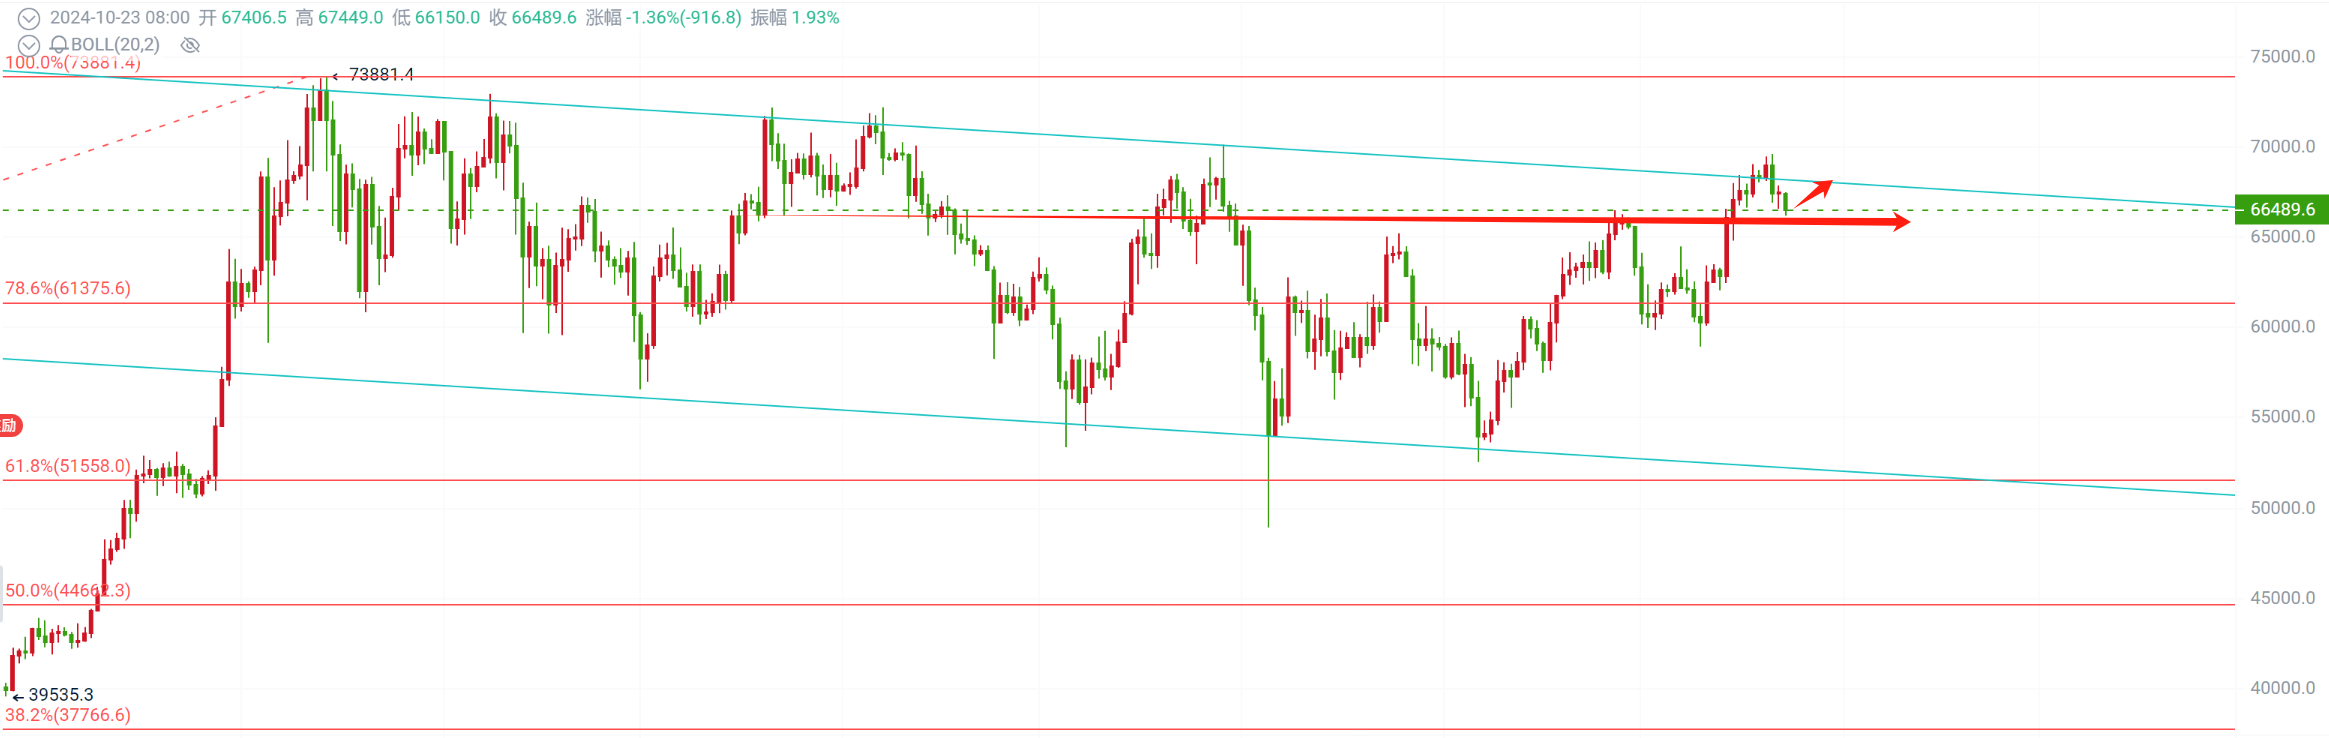
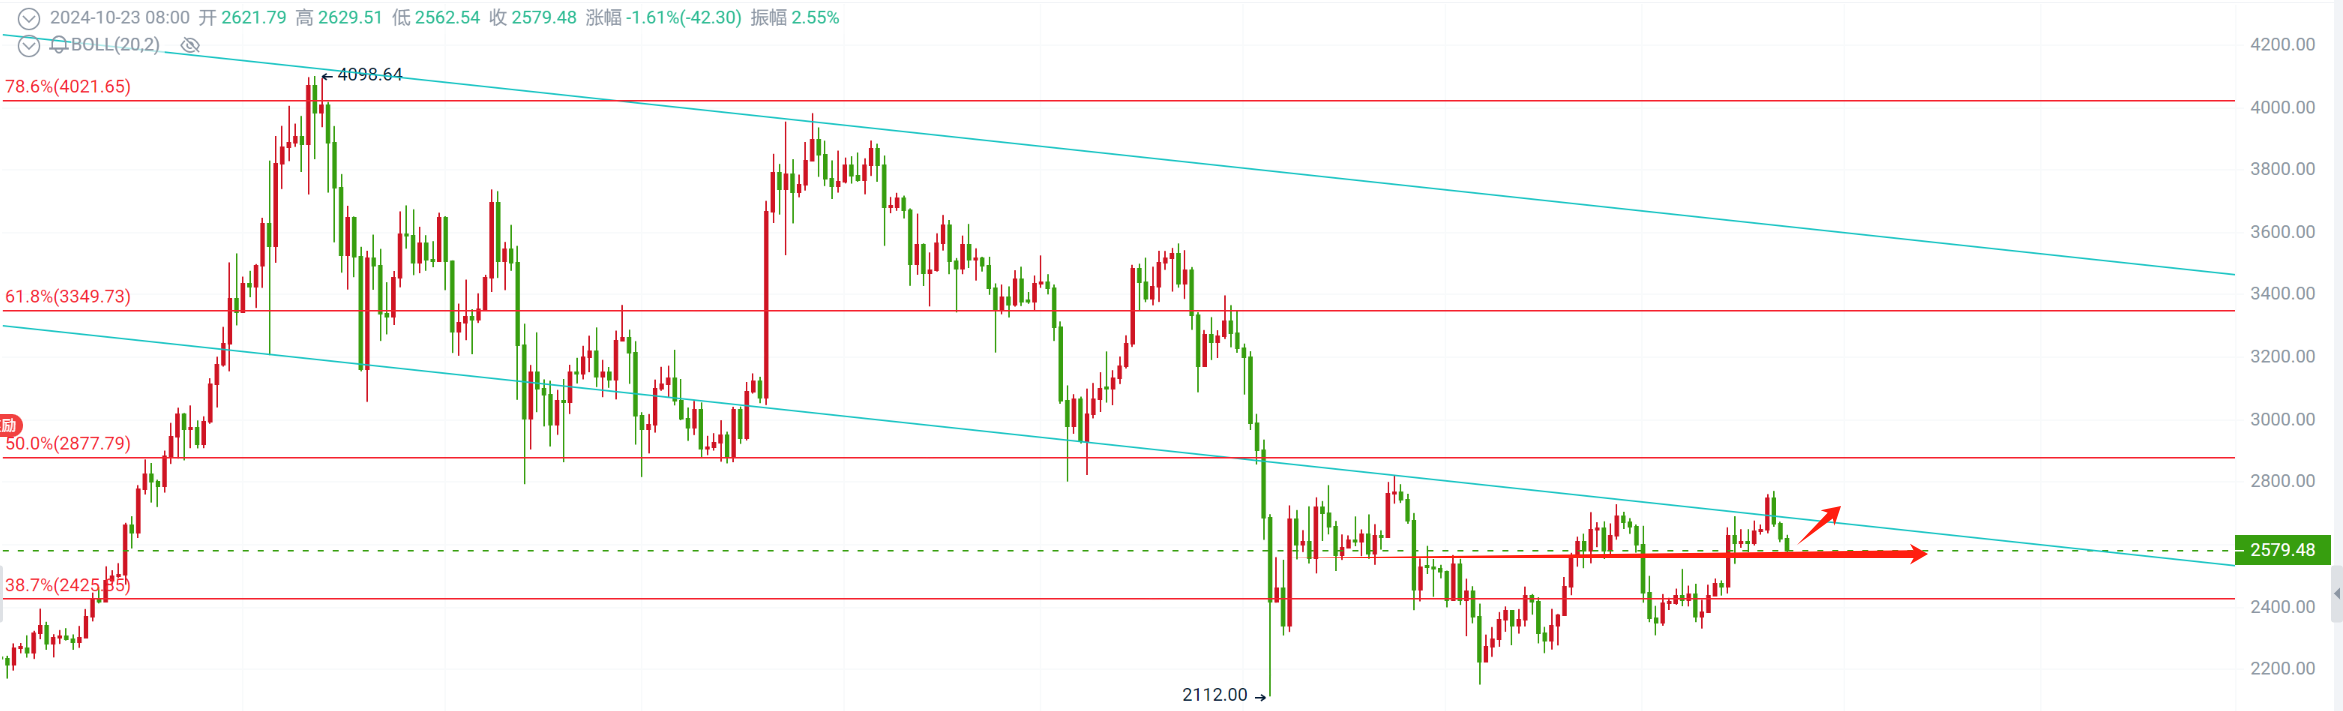
On the daily chart, Bitcoin has been oscillating downwards after hitting resistance around 69,000. It has currently broken the short-term support level of 67,000, with the next support level looking at 66,000-65,500. If this support is broken, a new round of decline can be declared, which can also be understood as a watershed for bullish and bearish trends. It is expected that after testing the support, there will be a buildup of strength to push upwards, with short-term resistance seen at 68,000. As for Ethereum, as mentioned earlier, it reached around 2,760 before starting to pull back. It has also broken below the short-term support level of 2,600-2,630, with the next key support looking at 2,550-2,500, which can also be understood as a watershed for bullish and bearish trends. Otherwise, following Bitcoin's bullish trend, after testing the support, it can continue to look upwards towards 2,760-2,870.
On the 4-hour chart, both Bitcoin and Ethereum are showing a gradual downward trend, a typical pullback after a high. Currently, they are near key support levels, and subsequent operations are still recommended to go long near the support levels!
Trading strategy: Go long near the support levels!
Long Bitcoin at 66,000-66,400, target 67,300-68,000, with a stop loss below 65,500;
Long Ethereum at 2,550-2,570, target 2,630-2,680, with a stop loss below 2,510;
The strategy is time-sensitive, and specific guidance will be provided in real-time privately!
Professional team gold medal analyst Ruo Yu focuses on contract trading guidance. Follow the WeChat public account "Coin Circle Ruo Yu" to understand real-time market analysis and trading strategies!

免责声明:本文章仅代表作者个人观点,不代表本平台的立场和观点。本文章仅供信息分享,不构成对任何人的任何投资建议。用户与作者之间的任何争议,与本平台无关。如网页中刊载的文章或图片涉及侵权,请提供相关的权利证明和身份证明发送邮件到support@aicoin.com,本平台相关工作人员将会进行核查。


