Evening market trends: How might they unfold? Little A analyzes for you!
Welcome to the group chat to ask Little A for more analysis: jv.mp/JaQ0CE
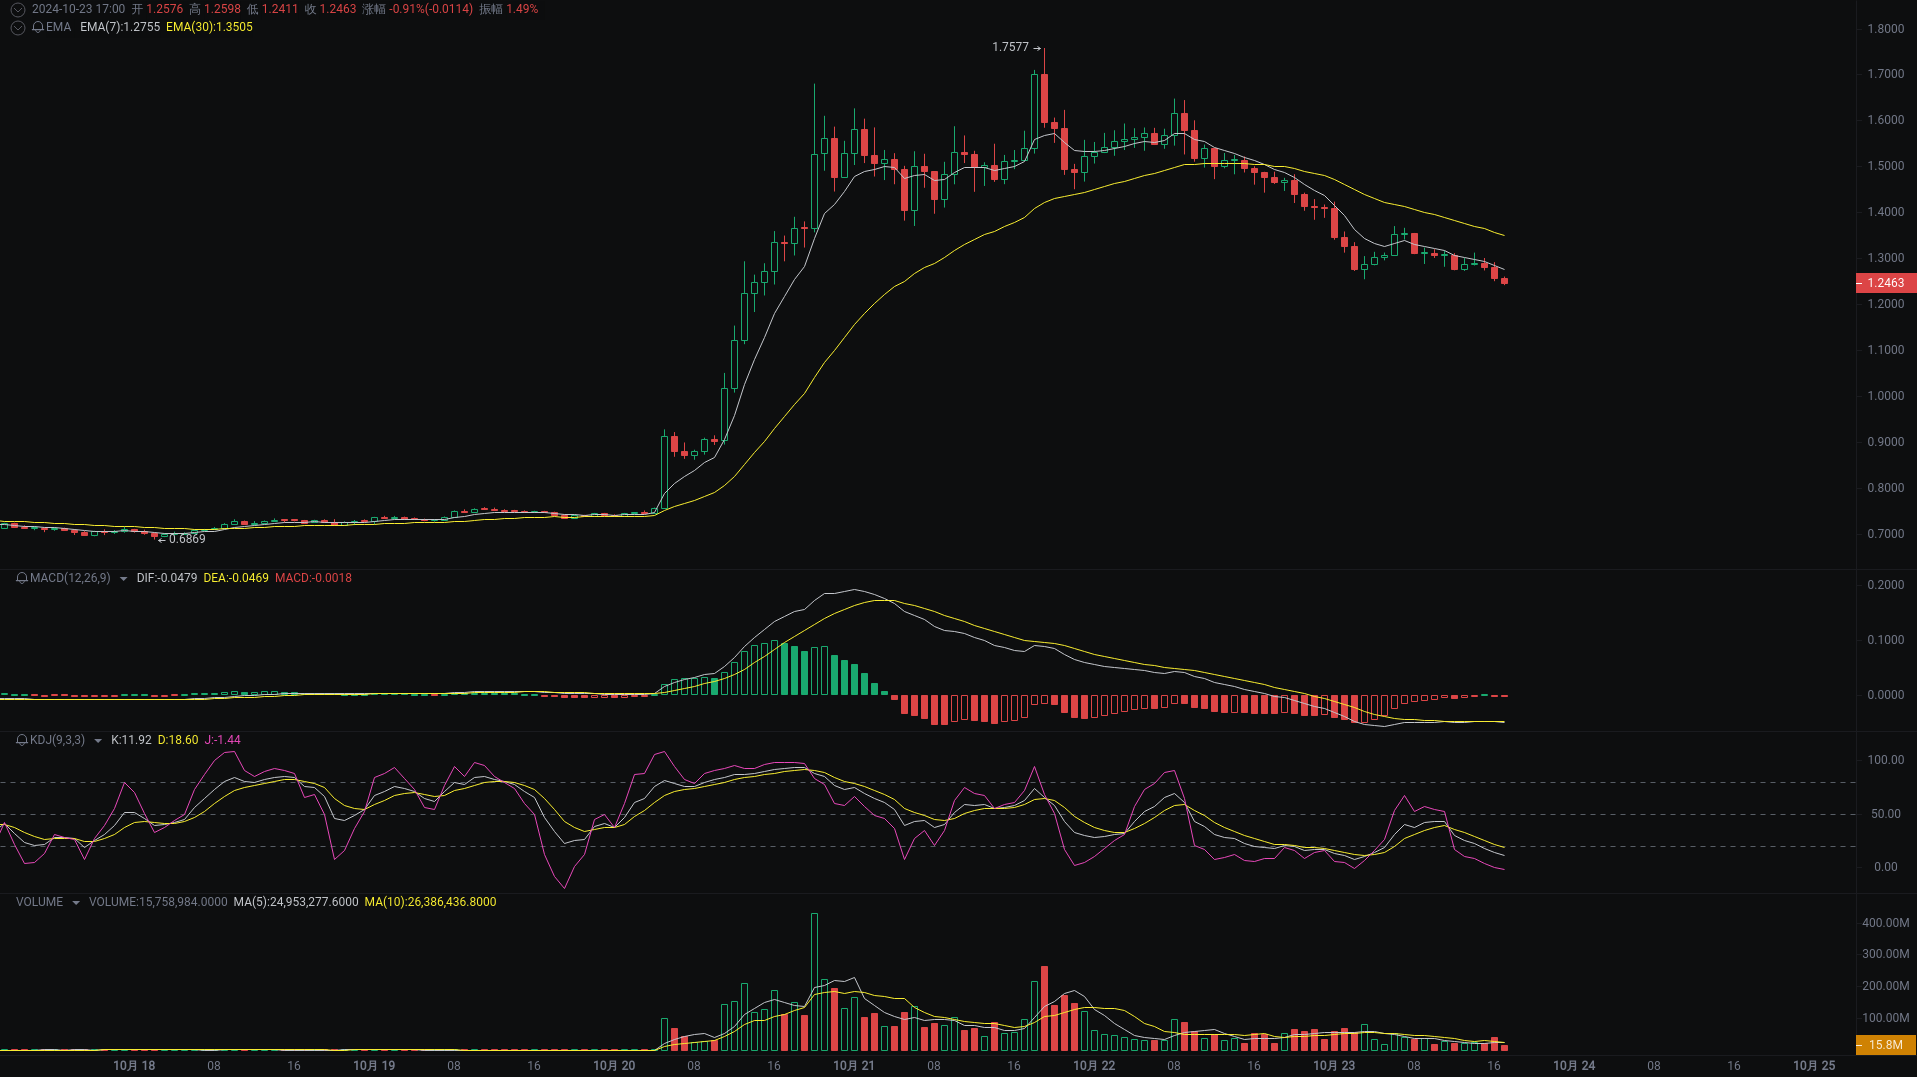
APE
APE's 1-hour price trend: Down.

This is a 1-hour Binance APE/USDT candlestick chart, with the latest price at: 1.2463 USDT, including EMA, MACD, KDJ, and volume indicators.
【Buy and Sell Points】
Buy Point One: 1.2750 USDT (considering the crossover point of EMA(7) and EMA(30), the price may find support near this level)
Buy Point Two: 1.2500 USDT (close to the lowest price of 1.2411 USDT, providing psychological and technical support)
Long Stop Loss Point: 1.2400 USDT (slightly below the recent cycle's lowest price, providing protection for long positions)
Sell Point One: 1.3100 USDT (recent rebound high, can be used as an initial reduction or short-term sell point)
Sell Point Two: 1.3500 USDT (below the long-term EMA(30), if there is upward momentum, this level may encounter resistance)
Short Stop Loss Point: 1.3600 USDT (exceeding Sell Point Two with a buffer to prevent stop loss from being triggered by minor fluctuations)
【Price Trend Analysis】
Candlestick Patterns:
- Recent candlesticks show increased price volatility, especially between 19:00 and 22:00 on October 21, with a significant price range, including a high of 1.7577. This may indicate intense and unstable market sentiment.
- Starting from October 22, the price has shown a downward trend, with multiple closing prices below opening prices, forming a series of bearish candles with long upper shadows, suggesting sellers control the market.
Technical Indicators:
- In the MACD indicator, both DIF and DEA are negative, and the MACD histogram continues to stay below the zero axis, indicating the current market is in a bearish trend.
- In the KDJ indicator, the J value has exceeded 80 for most time periods, indicating the market may be overbought; in recent cycles, both K and D values are below 20, possibly signaling an upcoming rebound or further decline.
- The EMA indicator shows that the short-term EMA(7) has crossed below the long-term EMA(30) and is diverging downwards, which is typically seen as a bearish signal.
Volume:
- During sharp price fluctuations, such as from 18:00 to 19:00 on October 21, the trading volume significantly increased, which may indicate substantial selling activity in the high price area.
- Following the price decline, the trading volume gradually decreased, suggesting that the downward trend may not yet be over, lacking buyer support for price recovery.
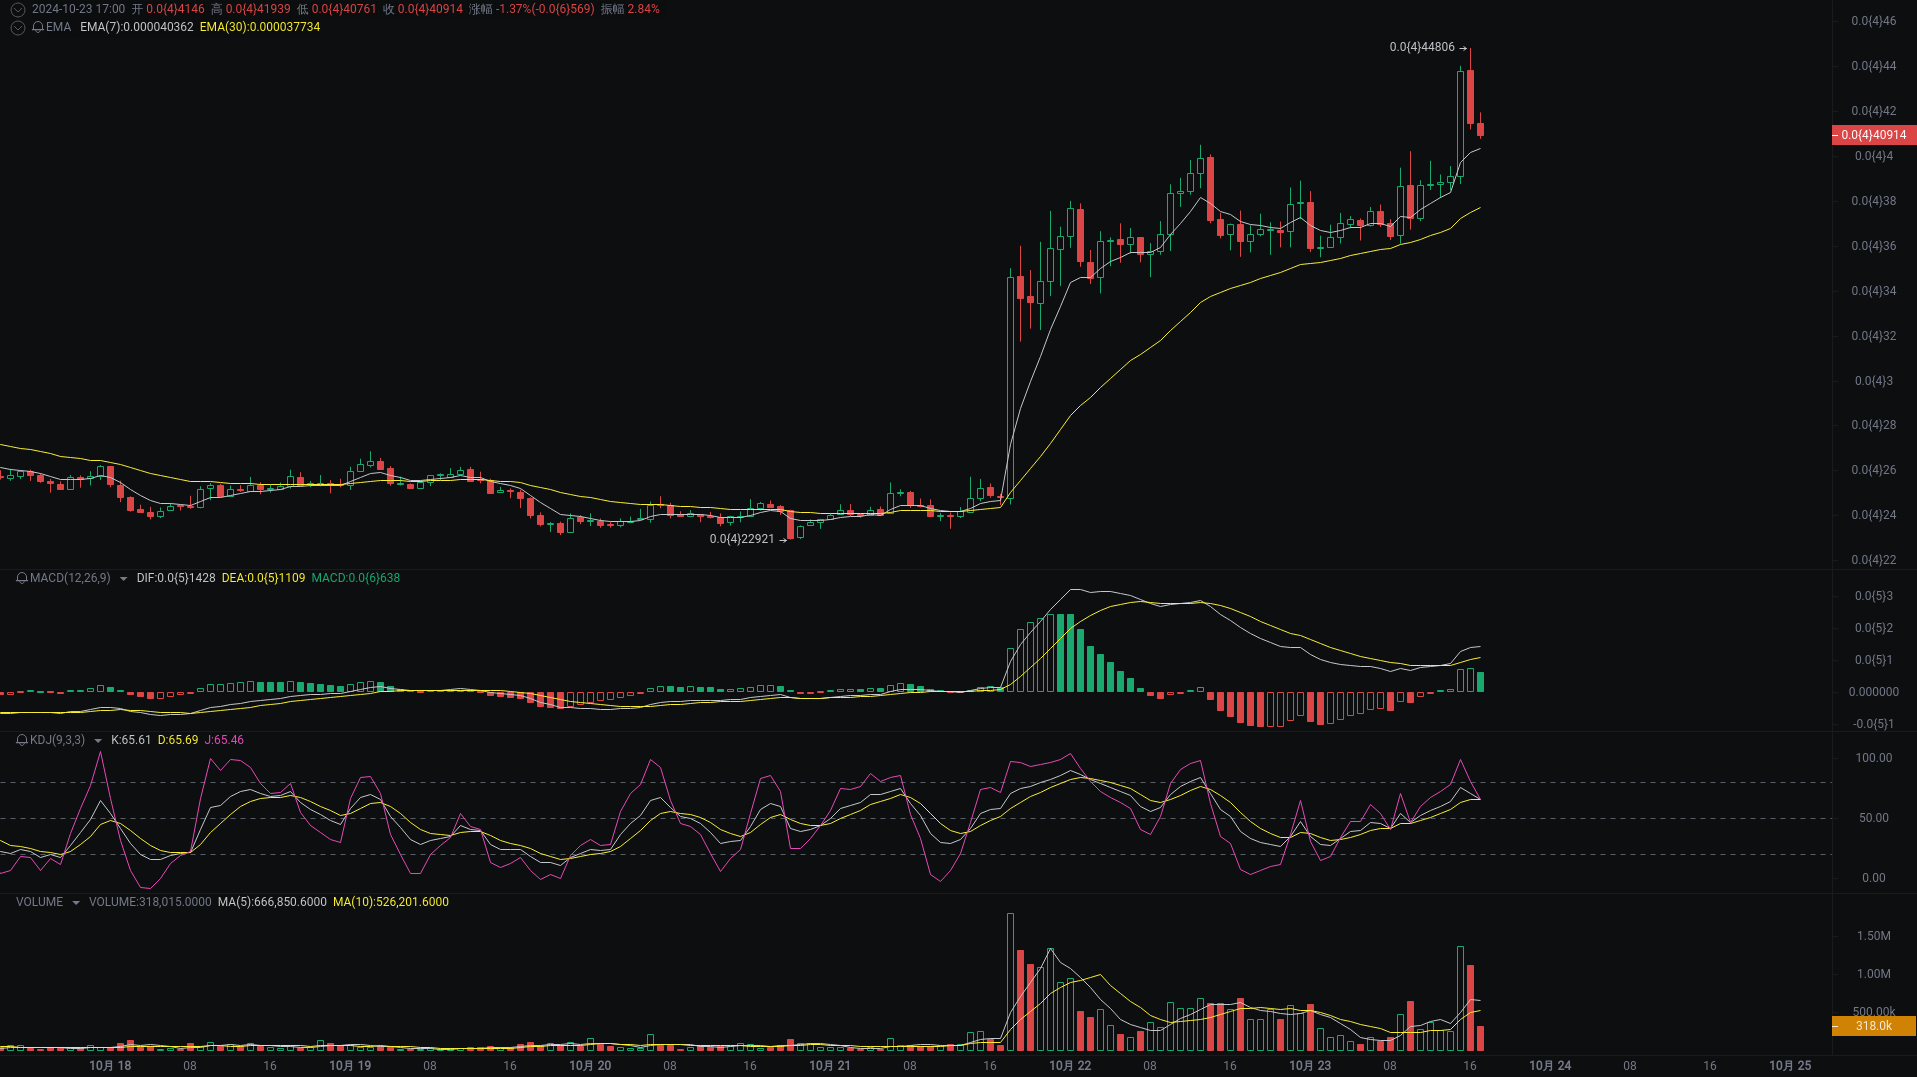
CAT
CAT's 1-hour price trend: Down.

This is a 1-hour Gate CAT/USDT candlestick chart, with the latest price at: 0.000040914 USDT, including EMA, MACD, KDJ, and volume indicators.
【Buy and Sell Points】
Buy Point One: 0.000038750 USDT (recent support level, low point at 11:00 on October 23, showing signs of rebound at this position)
Buy Point Two: 0.000036934 USDT (stronger historical support level, low point at 05:00 on October 23, if it breaks the first buy point, it may test this level)
Long Stop Loss Point: 0.000035600 USDT (slightly below Buy Point Two, providing enough space to avoid triggering stop loss due to minor fluctuations, while considering the low point at 20:00 on October 22 as a reference)
Sell Point One: 0.000041460 USDT (recent resistance level, near the opening price at 17:00 on October 23, the price may encounter selling pressure at this position)
Sell Point Two: 0.000043810 USDT (higher resistance level, the opening price at 16:00 on October 23, if broken, it may rise further)
Short Stop Loss Point: 0.000044806 USDT (exceeding Sell Point Two, the highest price in the recent cycle, suitable as a stop loss point for short positions)
【Price Trend Analysis】
Candlestick Patterns:
- Recent candlesticks show increased price volatility, especially between 18:00 and 22:00 on October 21, with a significant rise, where the long bullish candle at 18:00 on October 21 broke through the previous stable range, indicating buyers control the market.
- The candlestick at 16:00 on October 23 is a small bearish candle with a long upper shadow, suggesting increased selling pressure at high levels.
Technical Indicators:
- MACD indicator: The latest MACD histogram value (0.000000638) is positive, but has decreased compared to the previous hours; both DIF and DEA are on the rise, and DIF remains above DEA, which may indicate that bullish momentum is weakening.
- KDJ indicator: The J value (65.46) is below the K value (65.61) and D value (65.69), with the KDJ three lines close and crossing downwards, possibly indicating an upcoming downward trend.
- EMA indicator: The current price (0.000040914) is above EMA(7) (0.000040362) and EMA(30) (0.000037734), indicating that the upward trend is still maintained in the short term.
Volume:
- The trading volume gradually decreased after peaking at 18:00 on October 21, consistent with the price pullback after the rise, indicating weakening upward momentum.
- In recent hours, the trading volume has remained at a moderate level, with no significant increase or decrease, indicating relatively stable market participant activity.
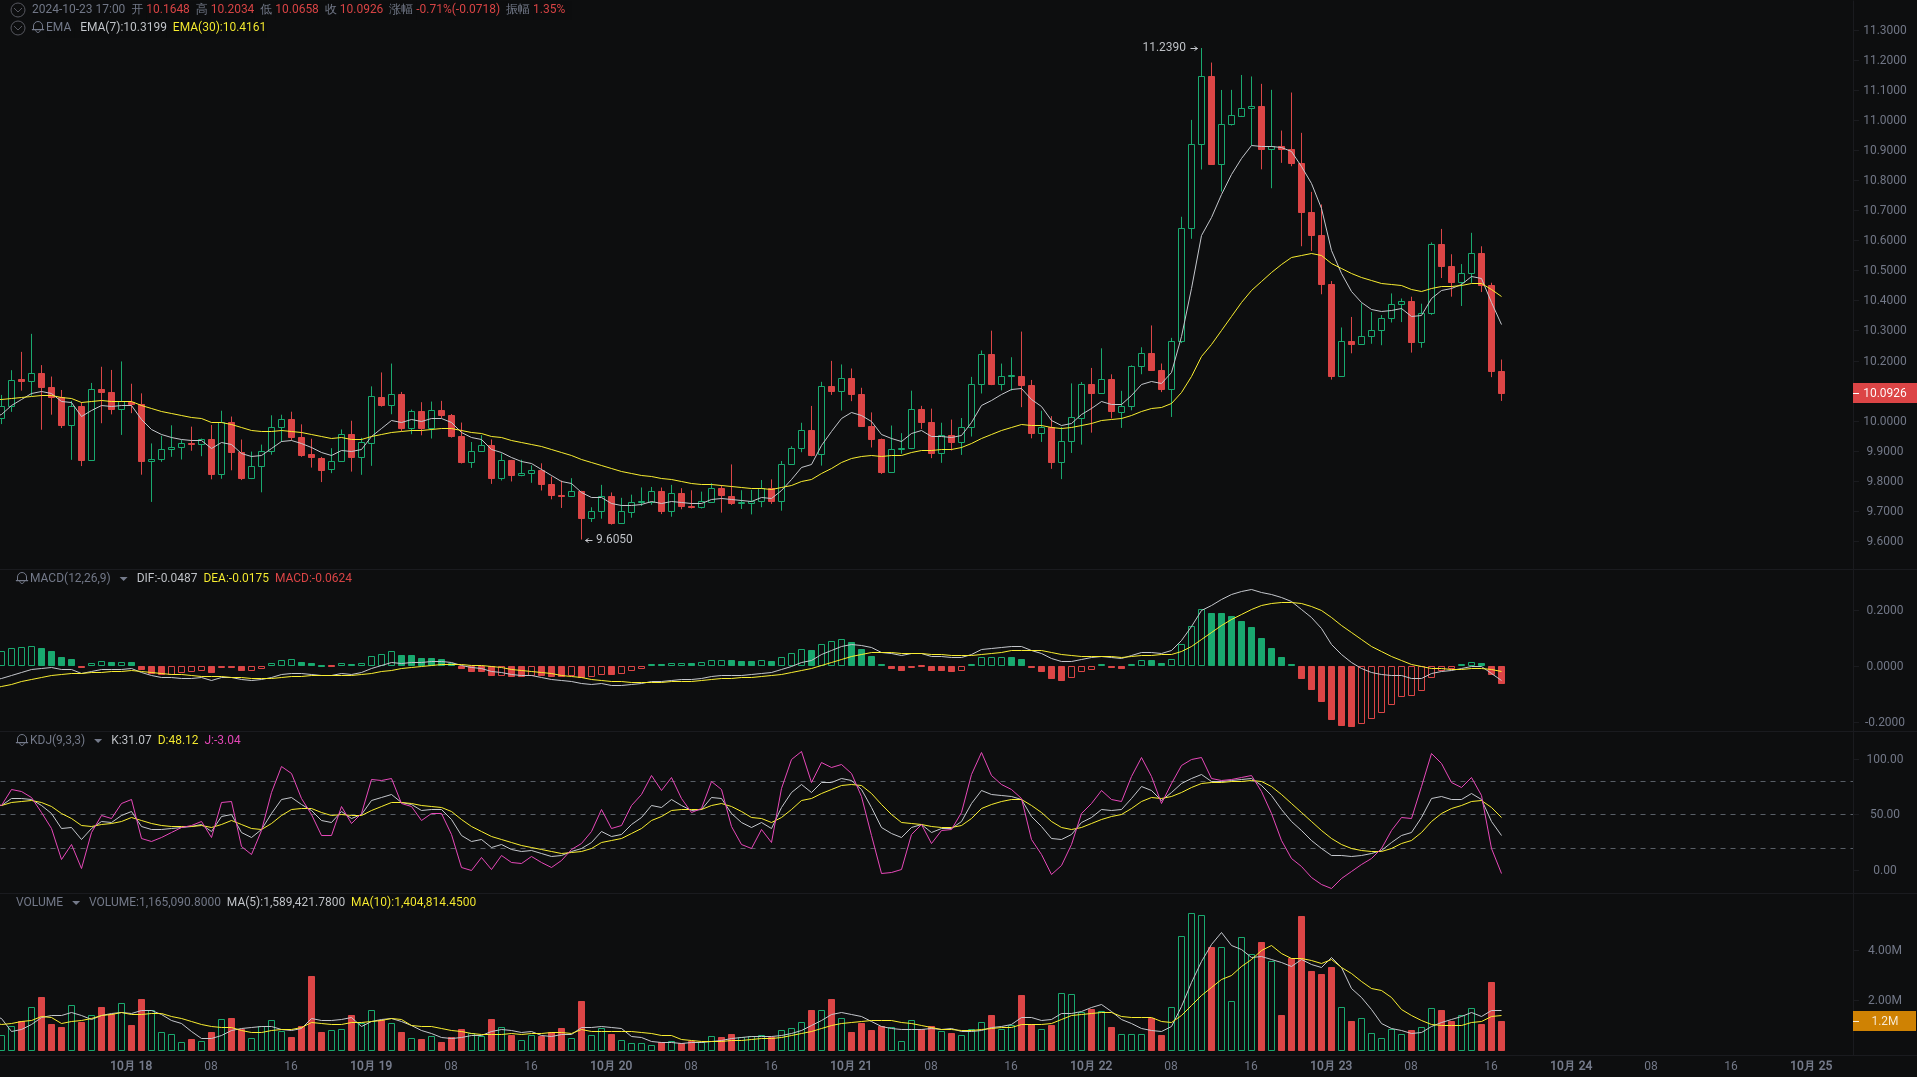
APT
APT's 1-hour price trend: Down.

This is a 1-hour Binance APT/USDT candlestick chart, with the latest price at: 10.0926 USDT, including EMA, MACD, KDJ, and volume indicators.
【Buy and Sell Points】
Buy Point One: 10.05 USDT (considering the EMA indicator where the 7-period EMA is close to the 30-period EMA, there may be short-term support. This price is slightly above the lowest price of 9.8058 USDT to prevent missing the opportunity after a rebound)
Buy Point Two: 9.90 USDT (combining the KDJ indicator where the J value is close to the oversold area and the MACD negative value is decreasing, this position is close to the previous low point and can be seen as a strong support level)
Long Stop Loss Point: 9.80 USDT (set below Buy Point Two, providing space for market fluctuations while avoiding triggering stop loss due to minor fluctuations)
Sell Point One: 10.40 USDT (the current price has already fallen below this level; if there is a pullback to this point, it may encounter pressure from previous support turning into resistance)
Sell Point Two: 10.60 USDT (recently a relatively stable trading range upper limit; breaking this price may require stronger buying pressure)
Short Stop Loss Point: 10.70 USDT (above Sell Point Two, providing enough space to avoid triggering stop loss due to minor fluctuations, and higher than recent local highs)
【Price Trend Analysis】
Candlestick Patterns:
- Recent candlesticks show increased price volatility, with a significant rise from 11:00 to 17:00 on October 22, followed by a pullback. In the latest few hours, the price has shown a downward trend.
- The continuous small bearish candles and short lower shadows from 01:00 to 05:00 on October 23 indicate that sellers are trying to push prices lower, but the downward space is limited.
Technical Indicators:
- In the MACD indicator, DIF continues to stay below DEA, and the MACD value is negative, indicating that the current market is in a bearish state, with the risk of further declines.
- In the KDJ indicator, the J value has recently touched the overbought area (>80) and then quickly declined; currently, both K and D lines are below 50, with the J line close to 0, suggesting that the market may be overly pessimistic, with the possibility of a rebound.
- The EMA indicator shows that the 7-period EMA has crossed below the 30-period EMA, which is typically seen as a signal of weakening trends in the short term.
Volume:
- During the price rise period, the trading volume increased, especially from 11:00 to 17:00 on October 22, with significant growth in volume as prices climbed, indicating sufficient upward momentum.
- In recent hours, trading volume has relatively decreased, combined with the price decline, which may indicate insufficient downward momentum or increased uncertainty among market participants.
※ All content provided by the intelligent analysis assistant Little A, for reference only and does not constitute any investment advice!
Little A's Intelligent Analysis is AICoin's industry-leading intelligent analysis tool, easily helping you interpret cryptocurrency trends, analyze indicator signals, and identify entry and exit points. Experience it on the APP or PC.
PC & APP Download: https://www.aicoin.com/download
免责声明:本文章仅代表作者个人观点,不代表本平台的立场和观点。本文章仅供信息分享,不构成对任何人的任何投资建议。用户与作者之间的任何争议,与本平台无关。如网页中刊载的文章或图片涉及侵权,请提供相关的权利证明和身份证明发送邮件到support@aicoin.com,本平台相关工作人员将会进行核查。


