Cryptocurrency Circle Liying: On October 23, Bitcoin fell below 67,000. Can the rebound at 66,500 initiate a new round of upward movement? Latest market analysis
Article published on 2024.10.23—01:00
The current price of Bitcoin has dropped below 67,000, with a recent low just reaching around 66,500 for a rebound, and a high of 67,700, only 300 points away from 68,000. There is a space of over a thousand points that can be captured. The market has shown signs of high-level consolidation again, and the decline of the upward channel is considered bearish. High-level sideways movement is seen as distribution, and the main force is consolidating with a purpose at this time, so caution is advised. For specific details, refer to Liying's statements.
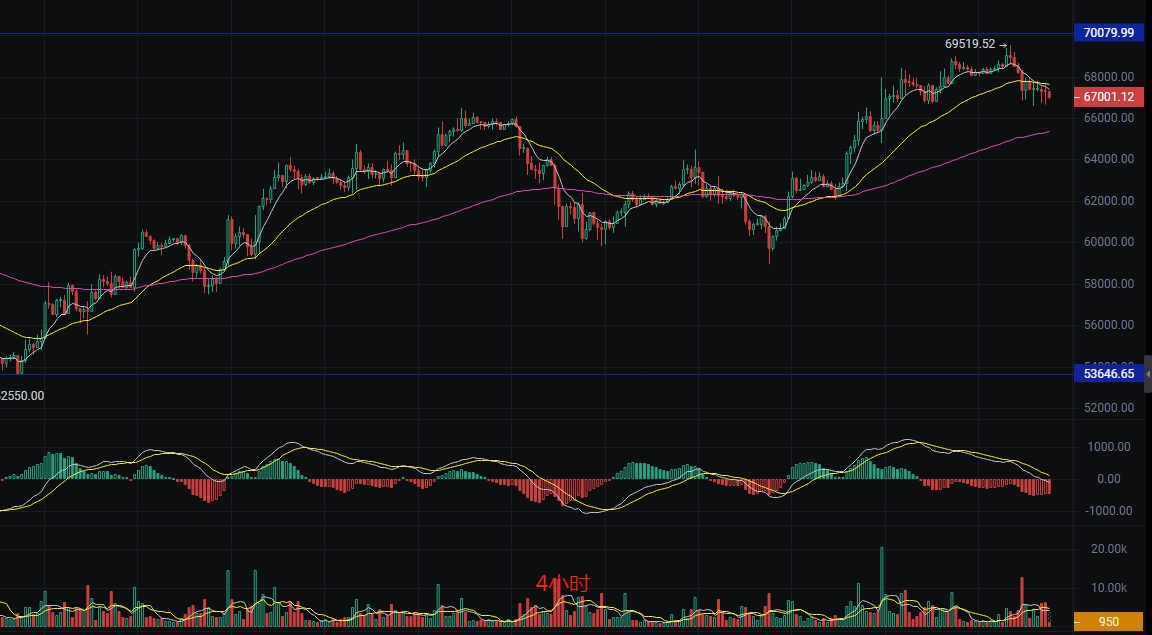
First, from the price trend analysis, the current K-line pattern on the market shows a clear downward trend with fluctuations. The price has retreated from a high position, and the daily chart shows consecutive bearish candles, indicating significant selling pressure in the market. In the technical indicator MACD on the 4-hour cycle, both DIF and DEA are below the zero axis, and the MACD histogram is negative, showing that bearish forces are dominant.
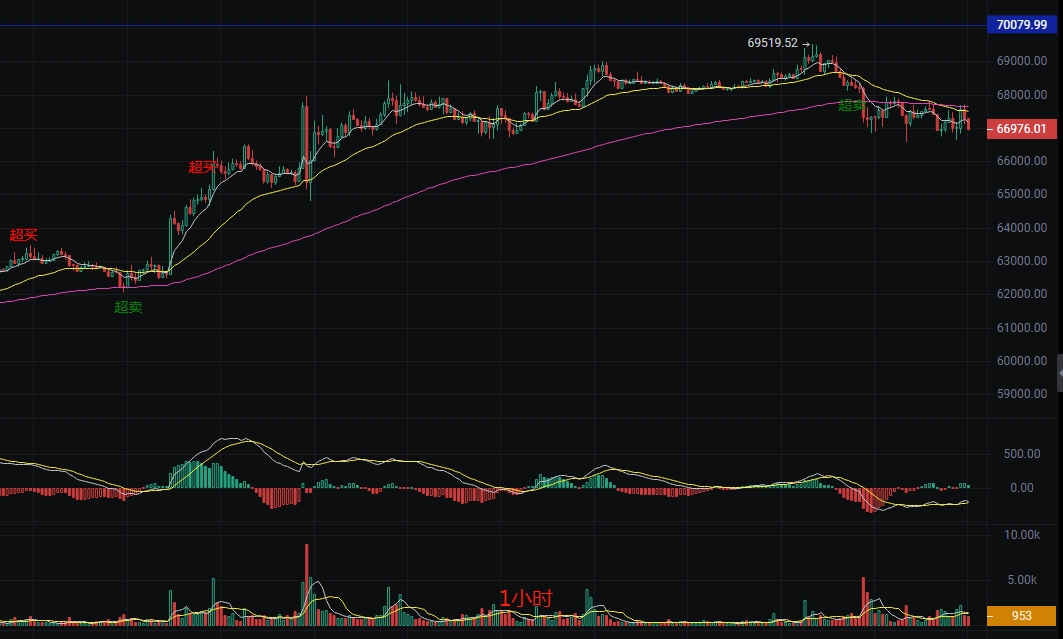
The current Relative Strength Index (RSI) is close to 40, not yet in the oversold zone, but still in a weak area. The EMA price is currently below EMA7, EMA30, and EMA120, with short-term, medium-term, and long-term moving averages showing a bearish arrangement, further confirming the downward trend. Additionally, the trading volume has increased in recent trading days, especially during price declines, indicating that both bulls and bears are entering a more intense phase. The market has reached a critical support point, so be prepared for both scenarios and avoid being washed out.
Today's point prediction: Pay attention to the support point; if it holds, go long; if it breaks, look for shorts.
Long entry at 66,000, add long at 65,000, stop loss at 64,500, target at 67,500.
Short entry at 68,000, add short at 69,000, stop loss at 69,500, target at 66,500.
Reason: Approaching previous lows, the round number may form support, and further probing may reach a stronger support area. At the same time, close to EMA120 and recent highs, the round number may form resistance. Once broken, upward space opens up, but there is still selling pressure near previous highs. Safety first; the content of this article is time-sensitive and for reference only; risk is borne by the reader.

The above is Liying's brief analysis of the current market situation for investors' reference. Over the past ten years, Liying has continuously explored and experienced hundreds of different digital assets. Throughout this process, Liying has witnessed the brilliance of bull markets and the gloom of bear markets, accumulating countless valuable experiences and profound lessons along the way. As a female trader striving in this challenging field, Liying feels a responsibility to share her insights, hoping to assist others with dreams in finding their place in this unpredictable market and embarking on their own journey to success.
免责声明:本文章仅代表作者个人观点,不代表本平台的立场和观点。本文章仅供信息分享,不构成对任何人的任何投资建议。用户与作者之间的任何争议,与本平台无关。如网页中刊载的文章或图片涉及侵权,请提供相关的权利证明和身份证明发送邮件到support@aicoin.com,本平台相关工作人员将会进行核查。


