The U.S. presidential election is 13 days away. This year, former President Trump, a Republican candidate who has publicly supported cryptocurrency multiple times, has seen his winning probability rise to 64%, widening the gap against Democratic candidate Harris, whose probability has dropped to 35.9%. This marks a new high for Trump since Biden withdrew from the race in late July.
In terms of cryptocurrency, Bitcoin reached a high of $69,546 yesterday morning before selling pressure began to emerge. Late last night, it briefly fell below $67,000, and this morning around 8:30, it again dipped close to the $66,500 level. After quickly breaking below the low of October 17, many investors were washed out of the market. As of the time of writing, the price is $67,325, down 2.45% in the last 24 hours. Currently, there seem to be signs that Bitcoin's upward trend may be interrupted. Is this just a temporary pullback, or are the main players looking to take advantage of the market's high sentiment to cut some losses before pulling back again during the U.S. election?
Bitcoin 4-Hour Chart
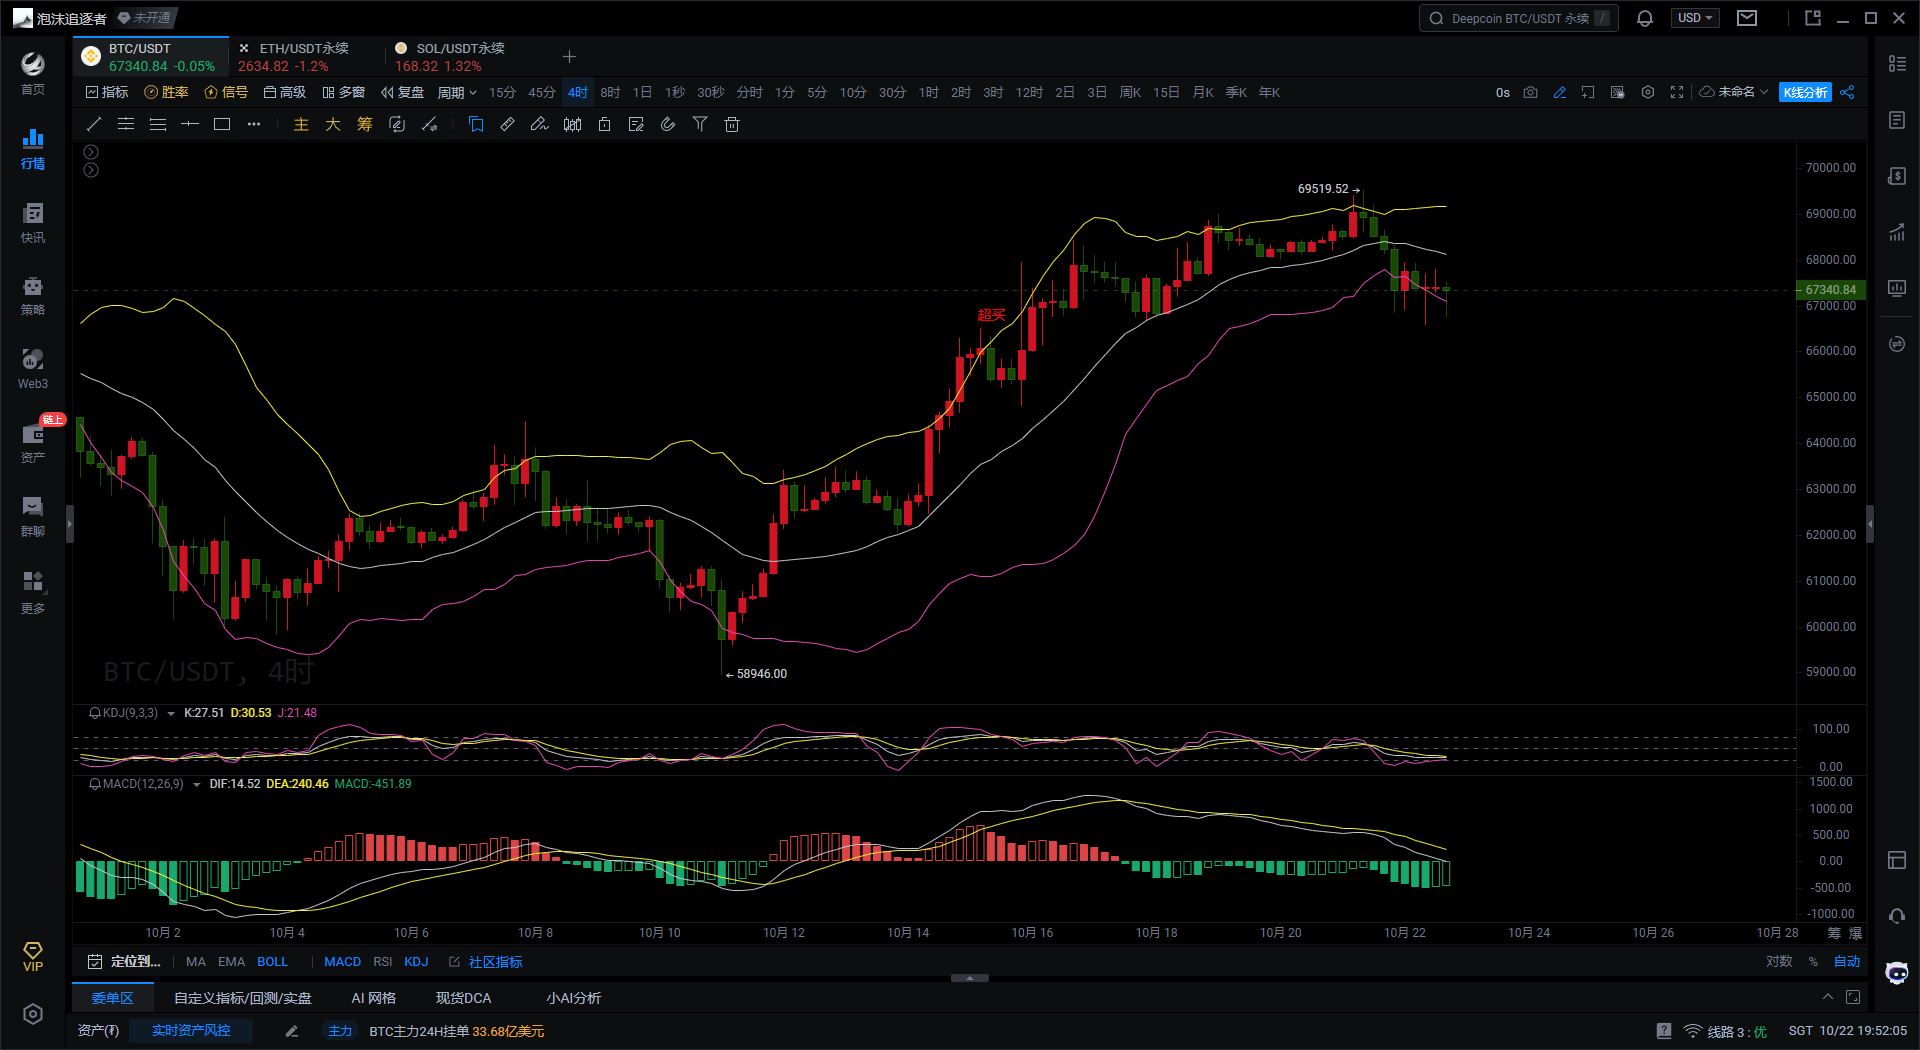
First, according to the Bollinger Bands indicator on the 4H Bitcoin chart, the current price is hovering near the middle band. It has previously touched the upper band multiple times, entering the overbought zone, but has since experienced some pullback. The middle band of the Bollinger Bands typically serves as a support or resistance level. If the price remains below the middle band, it indicates further pullback pressure. The opening of the Bollinger Bands is gradually narrowing, suggesting that volatility is decreasing, and the market is entering a consolidation phase.
Second, based on the MACD indicator on the 4H Bitcoin chart, the distance between the DIF line and the DEA line is gradually narrowing. If it continues to converge and forms a death cross, it will be a bearish signal, indicating that the price will further decline. The MACD histogram is also showing a shift from red to green, indicating that bullish momentum is weakening while bearish momentum is strengthening.
Finally, according to the KDJ indicator on the 4H Bitcoin chart, the K and D values are showing a downward turn in the overbought zone, and the J value has significantly dropped, moving down from the overbought area. This suggests that a price pullback may occur in the short term. If the KDJ three-line values form a death cross at high levels, the price will further decline.
Bitcoin 1-Hour Chart
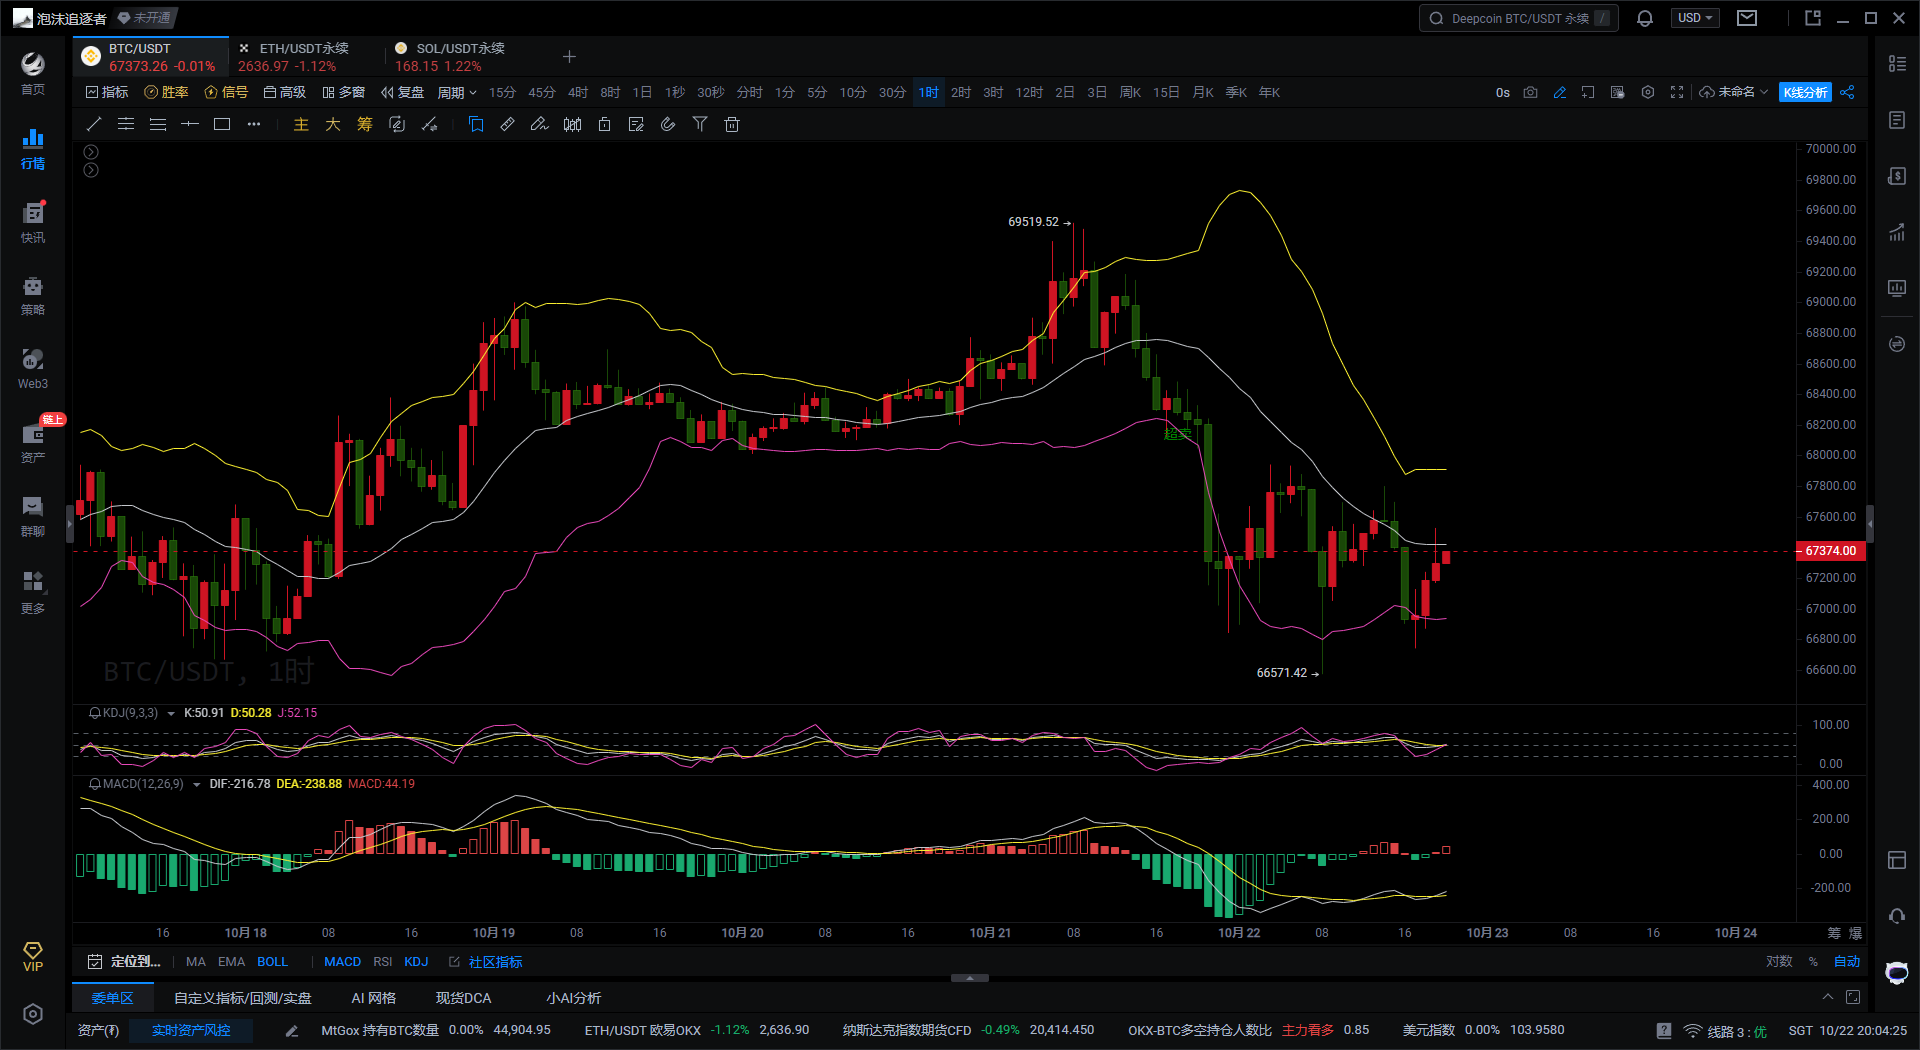
First, according to the Bollinger Bands indicator on the 1H Bitcoin chart, the price is currently between the middle and lower bands, and the opening of the Bollinger Bands is slightly expanding, indicating increased volatility and the possibility of further downward movement. The support near the lower band is crucial; if the price breaks below the lower band, there may be further downside potential. If the price can rebound above the middle band, the market may regain bullish sentiment.
Second, based on the MACD indicator on the 1H Bitcoin chart, the green histogram of the MACD is gradually shortening, indicating that bearish momentum is weakening, and there are signs that the DIF line and DEA line may form a golden cross upwards. If the golden cross is confirmed, it will signal a bullish outlook in the short term, and the price is expected to rebound. However, if the golden cross does not form, bearish sentiment will continue to dominate.
Finally, according to the KDJ indicator on the 1H Bitcoin chart, the K and D values are currently crossing at low levels to form a golden cross signal, and the J value has started to rise from low levels, indicating a signal of oversold rebound. A rebound trend is expected in the short term.
In summary, the analysis shows that Bitcoin is experiencing some pullback pressure after the previous rise on the 4-hour chart, with both MACD and KDJ indicating bearish signals. The 1-hour chart shows signs of a short-term oversold rebound, with KDJ and MACD suggesting possible rebound signs, but the opening of the Bollinger Bands is still expanding, indicating that there is still some downward pressure in the market. Therefore, the upcoming market may experience a brief rebound before continuing to face some downward pressure.
Based on the above, the following suggestions are provided for reference:
Short Bitcoin at 67,600-67,800, targeting 65,800-65,500, with a stop loss at 68,200.
Instead of giving you a 100% accurate suggestion, I prefer to provide you with the right mindset and trend. After all, teaching someone to fish is better than giving them fish. The focus is on the mindset, grasping the trend, and planning the market layout and position. What I can do is use my practical experience to help you make investment decisions and manage operations in the right direction.
Writing time: (2024-10-22, 19:50)

(Written by - Master Says Coin) Disclaimer: Online publication has delays, and the above suggestions are for reference only. The author is dedicated to research and analysis in the fields of Bitcoin, Ethereum, altcoins, forex, stocks, etc., with years of experience in the financial market and rich practical operation experience. Investment carries risks; proceed with caution. For more real-time market analysis, please follow the official account Master Says Coin for discussion and exchange.
免责声明:本文章仅代表作者个人观点,不代表本平台的立场和观点。本文章仅供信息分享,不构成对任何人的任何投资建议。用户与作者之间的任何争议,与本平台无关。如网页中刊载的文章或图片涉及侵权,请提供相关的权利证明和身份证明发送邮件到support@aicoin.com,本平台相关工作人员将会进行核查。


