Conveying the Way of Trading, Enjoying a Wise Life.

The price trend of Bitcoin formed a medium to long bullish candlestick last week, with a slight increase in trading volume. At this time, the moving average indicators for Bitcoin are showing a bullish divergence, having broken through the significant resistance at 66,000 USD. This combination is undoubtedly a positive bullish signal. Additionally, the MACD indicator has formed a golden cross above the zero line. Therefore, Bitcoin has formed a double golden cross resonance in this directional weekly cycle, which serves as an important reference for our bullish outlook.
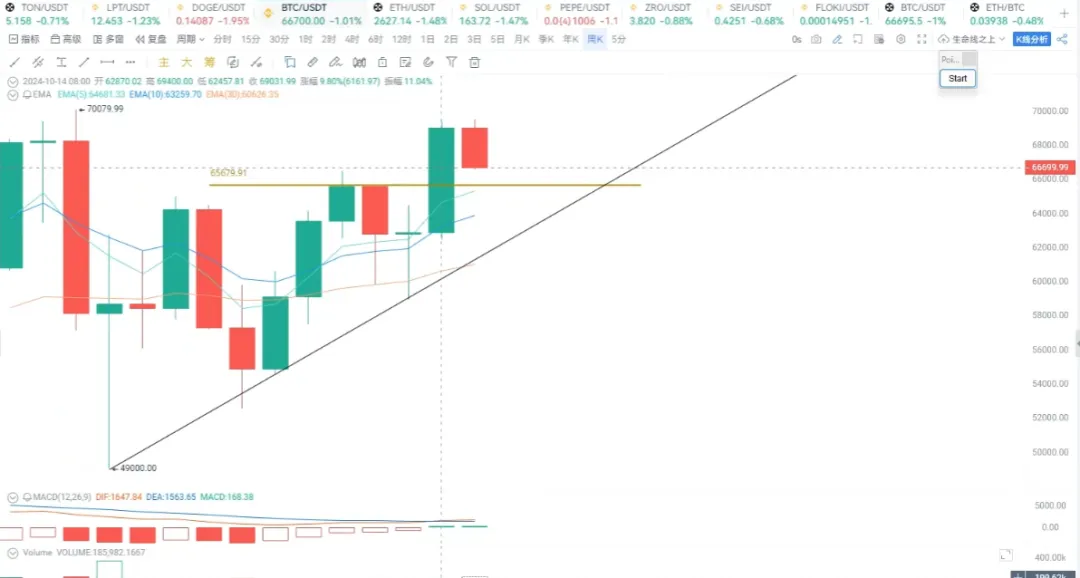
Why did Bitcoin continue to retreat after reaching 69,000 USD? At 69,000 USD, it faces significant resistance. Looking at the weekly chart, the descending trend line connecting two corresponding highs serves as an important resistance line for Bitcoin, and it cannot be broken through in one go. Some declines are necessary for a better rise, and this decline should facilitate a better breakout above 69,000 USD, leading to greater upward potential. During Bitcoin's pullback, we should focus on the position near 65,600 USD, close to the five-week moving average. This level is not only the midpoint of last week's medium to long bullish candlestick but also where the five-week moving average is located, and it is an important level of previous resistance. Therefore, if the price can pull back to between 65,600 USD and 66,000 USD, we can increase our positions.
Of course, some have raised opposing views, arguing that 69,000 USD is the peak for this wave of Bitcoin, and that a deep pullback may occur, potentially returning to 50,000 or even 40,000 USD. However, such judgments vary from person to person, as everyone has their own trading systems and standards. A thousand people looking at the same data and the same candlestick chart will have a thousand different opinions; this is the charm of the market and highlights the importance of establishing a trading system that suits oneself. Each person is an independent individual, with different paths to success, but the reasons for failure often share similarities. For Bitcoin to form a downward trend, it must effectively break its trigger point at 62,700 USD; otherwise, every pullback will be an excellent entry opportunity.

Ethereum's price is at 2,629 USD. After encountering resistance at the 30-week moving average, Ethereum's price began to retreat. However, last week's candlestick showed a medium to long bullish line, but Ethereum's performance was relatively weak, giving a less friendly impression. It is important to note that Bitcoin's breakout likely means Ethereum will follow suit. From the current trend, Ethereum is forming a bottom arc pattern. 2,776 USD is an important neckline.
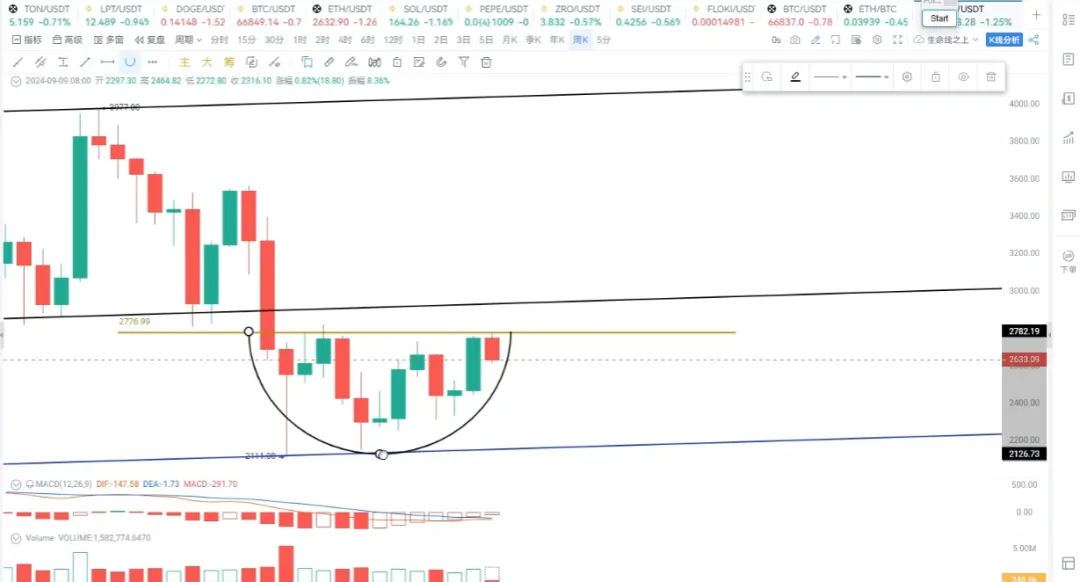
If it can effectively break through, it will be equivalent to standing above the 30-week moving average. In this case, it could rise from where it fell. If it stands above 2,776 USD or even 2,800 USD, the next resistance levels will be 3,500 and even higher at 4,050 USD. This is the allure of the arc bottom. The key lies in whether Bitcoin can stabilize and whether Ethereum will follow the market's downturn; we will wait and see. The current trend can be used to enter or add to positions based on the arc pattern.

SOL, as a strong competitor to Ethereum, has performed better than Ethereum in this wave of market movement. On the weekly chart, the MACD indicator and moving average indicators have also formed a double golden cross resonance pattern, which is an exciting formation and a commonly used strong bullish signal. During pullbacks on the daily and weekly levels, the five-week moving average, located around 158 USD, can be referenced. Interested parties may consider adding to positions or entering here.
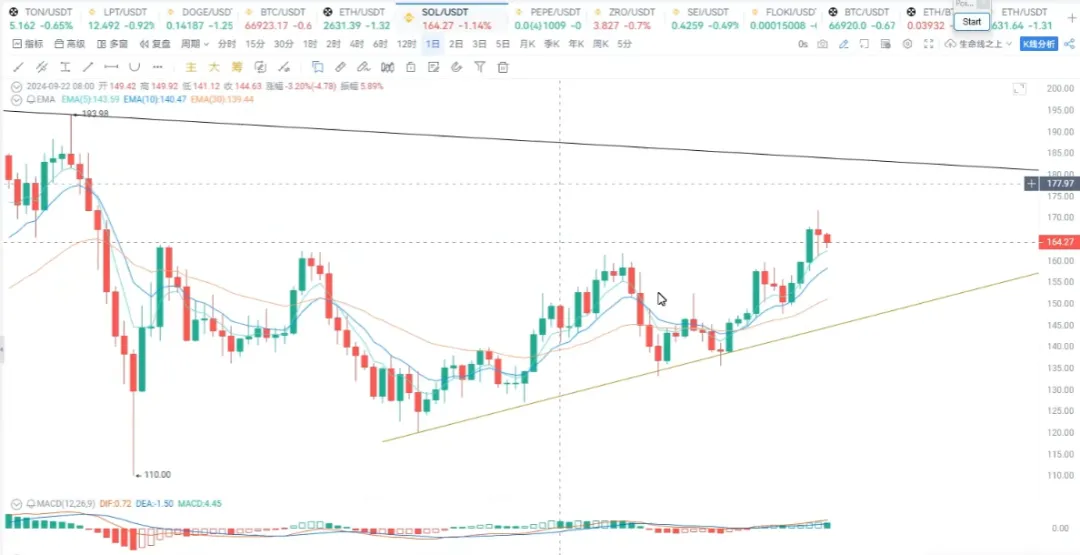
The upper resistance level is the descending trend line at 182 USD. If it can effectively break through, SOL will open up upward space. In addition to 158 USD, the downward support level also includes the ascending trend line. If support is not found at 158 USD, the next support target will be 147 USD. If it breaks below 147 USD, the short-term upward trend will be compromised, and risks should be avoided. With upper resistance at 182 USD and lower support at 147 and 158 USD, which point should you enter from? It can be determined based on your own risk tolerance. Don't forget that the double golden cross resonance on the weekly chart is a positive bullish signal.
In summary, the weekly chart shows an upward breakout forming a double golden cross resonance, including Ethereum, Bitcoin, and SOL. With the daily chart showing a downward pullback, will you choose to enter, add to your position, or exit?
For more information, you can contact our assistant and join the VIP group.
免责声明:本文章仅代表作者个人观点,不代表本平台的立场和观点。本文章仅供信息分享,不构成对任何人的任何投资建议。用户与作者之间的任何争议,与本平台无关。如网页中刊载的文章或图片涉及侵权,请提供相关的权利证明和身份证明发送邮件到support@aicoin.com,本平台相关工作人员将会进行核查。


