
Key Indicators: (Hong Kong Time October 14, 4 PM -> Hong Kong Time October 21, 4 PM)
BTC/USD +6.6% ($64,250 -> $68,500), ETH/USD +7.9% ($2,525 -> $2,725)
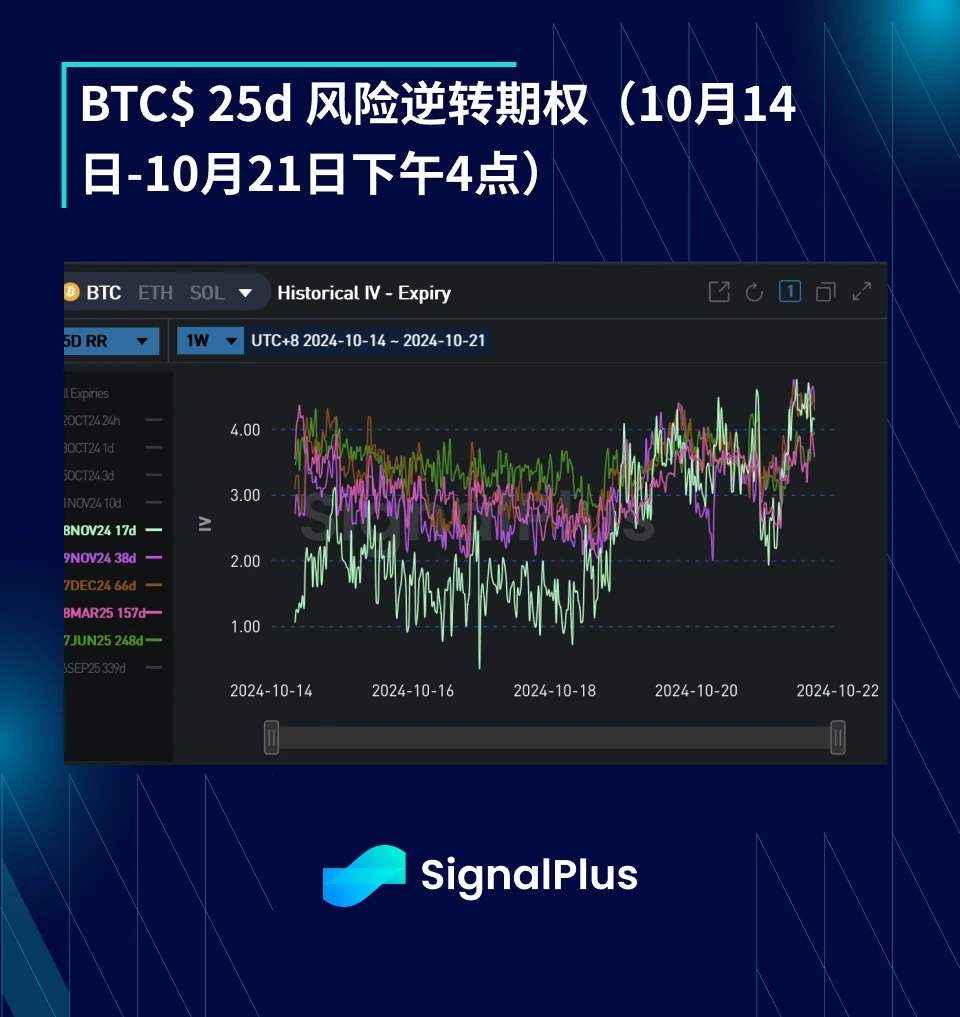
BTC/USD December (Year-End) ATM Volatility -1.6v (57.5 -> 55.9), December 25d Risk Reversal Volatility +1.4v (2.9 -> 4.3)
Spot Technical Indicators Overview
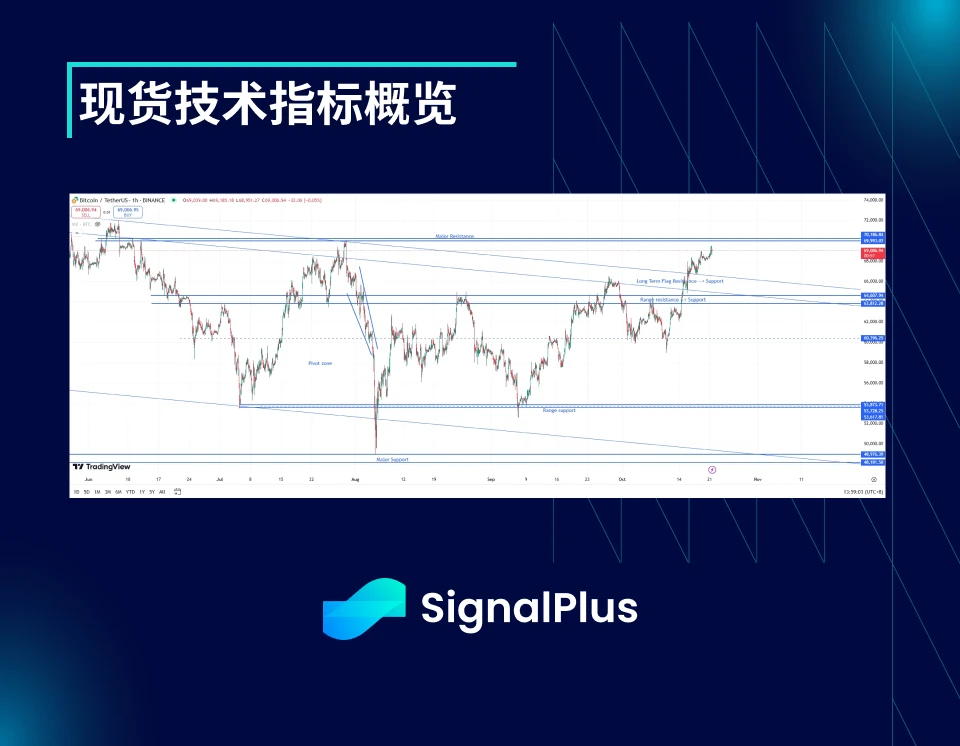
The spot market finally broke through the long-term flag pattern resistance last week, entering a new price range of $67-69.5k. As the election situation changes, the market begins to position itself for trades related to Trump.
Currently, the $70k level constitutes very strong resistance. The price uptrend is relatively mild (actual volatility is low), and we expect this situation to continue in the short term. If the price breaks through $70.25k (then $72k), the spot market may see a significant upward trend. Conversely, if it falls below $63.75k, it may trigger a sell-off in the spot market, with prices retreating to $60k and accompanied by significant volatility.
Major Market Events
The long-awaited "Uptober" rally has finally begun, with the rising probability of Trump’s election, coupled with strong overall performance in the third quarter U.S. earnings reports (and retail sales data), and no further escalation in Middle East tensions, leading to a warming of market risk sentiment.
From a technical perspective, as the market broke through the resistance of the $66.5k - $67k price range, the price trend remains bullish in the short term this week. Meanwhile, ETF inflows have increased, and performance across asset classes has also boosted this rally, with the gold to fiat currency exchange rate rising to a yearly high, and the SPX index also reaching a new yearly high.
Although Trump’s odds have risen significantly (winning probability over 60%), this change is mainly driven by a few large individual bets. Polling odds remain stable around 50/50, which means we need to be cautious about the market's early positioning for a Trump victory (rising dollar exchange rate, increasing cryptocurrency prices, and higher U.S. Treasury yields). It is expected that this election will be decided at the last moment, and we may see a pullback in recent Trump-related trades in the coming week.
ATM Implied Volatility
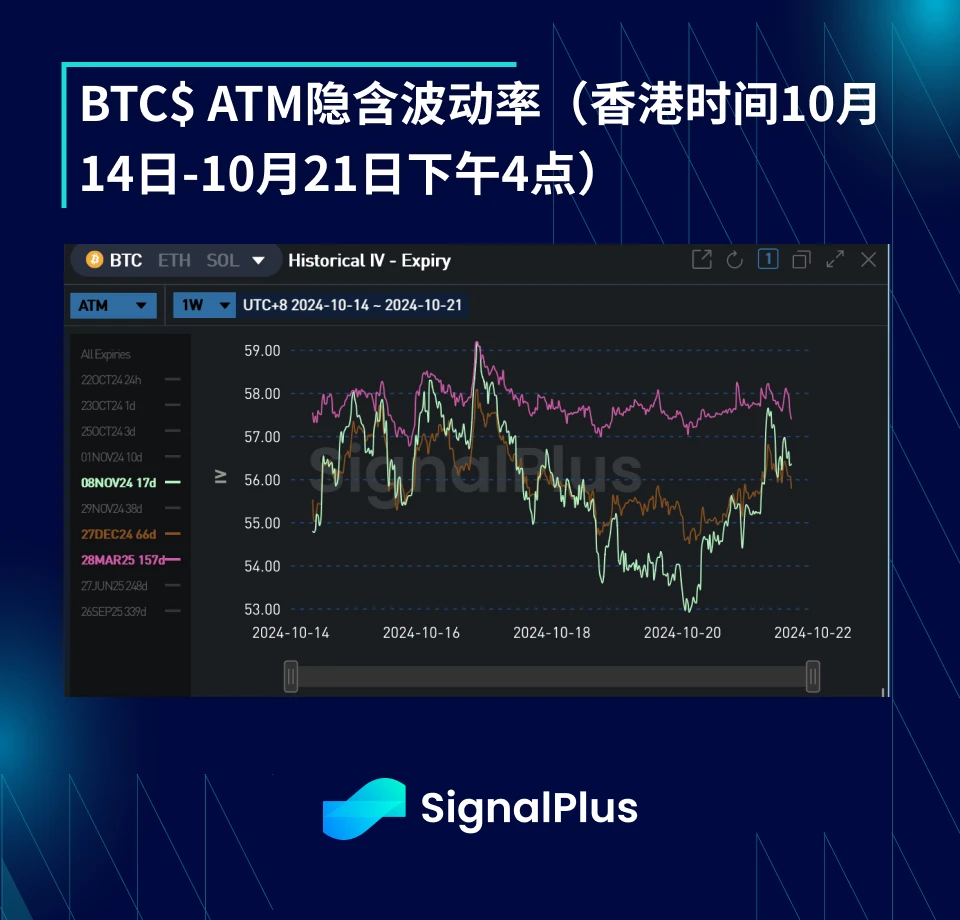
This week, as spot prices rose and broke through the range resistance, actual volatility increased. However, actual volatility remained relatively subdued at other times this week, with fixed-term actual volatility around 45 (while 1-week high-frequency volatility approached 54). Large-scale ETF inflows have supported prices during pullbacks, suppressing the decline in actual volatility. Meanwhile, the market seems to be engaging in long Gamma trading in high price areas, limiting the rise in spot prices due to Gamma hedging.
After successfully breaking through $67k, implied volatility failed to maintain its upward momentum, as the spot market lacked follow-up support, and price movements remained relatively stable, not stirring much in options trading. Additionally, in the short term, the market is mainly enhancing its volatility expectations through ratio call spreads and overlay selling strategies, so despite new demand, implied volatility has not significantly increased.
Last week, the spot market's early positioning for Trump reduced the demand for event "tail hedging," leading to a decrease in the pricing of election volatility. However, considering that polling remains close to 50/50, we believe the market reacted too early based solely on odds. With the intraday breakeven point below 5% and the probability of a Republican sweep increasing, we believe holding options positions with election expiration is worthwhile. Meanwhile, in the short term, asset price pullbacks related to Harris may be very rapid.
Skewness/Convexity
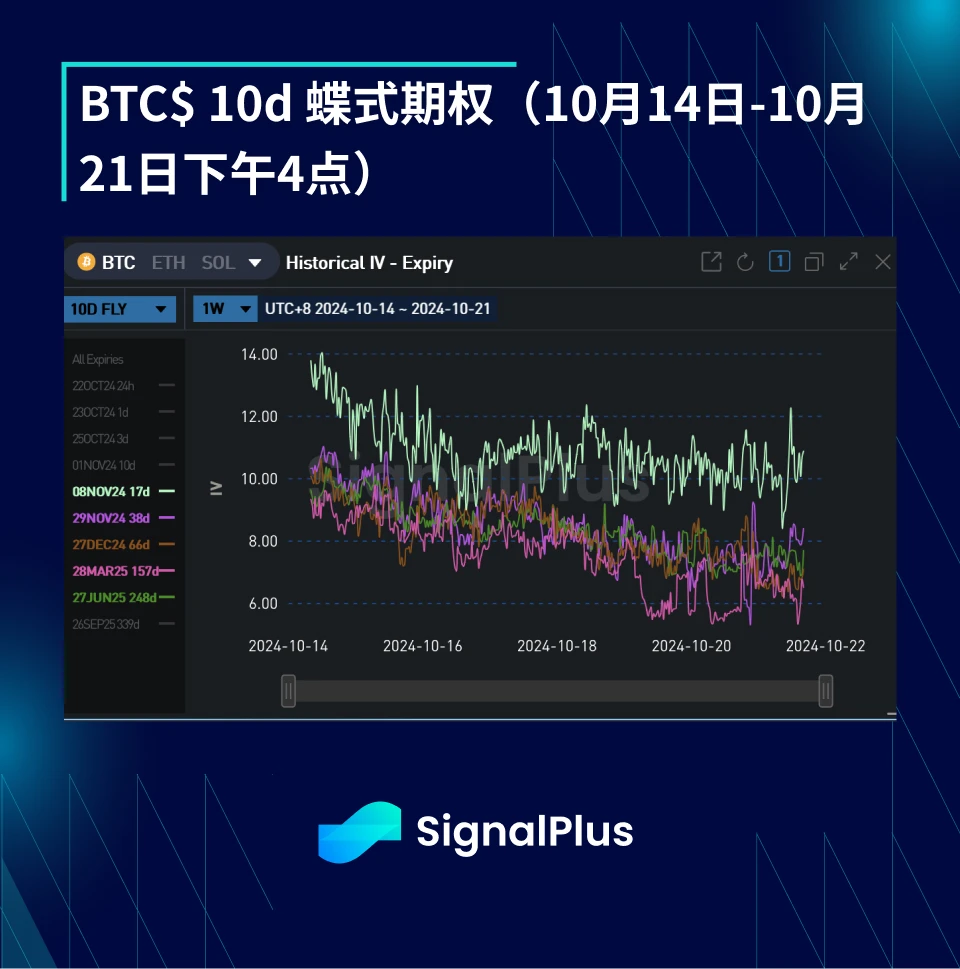
As spot prices broke through the upper limit of the range, there is an opportunity to set a historical high, leading to a sharp rise in volatility skew prices this weekend. However, this is completely contrary to the current correlation between spot and volatility; so far, we have observed that when spot prices rise, implied volatility is relatively low. Furthermore, the changes in volatility skew are not limited to post-election expiration; pre-election volatility skew has also increased, so this change cannot be solely attributed to the "Trump premium." We expect that if the odds fall back to the polling level of 50/50, the volatility skew prices will quickly retreat.
Although we observed a positive correlation between spot and implied risk reversals this week, convexity trading is in a sideways consolidation. We attribute this phenomenon to the large number of options contracts still at the wings between $100k and $120k, as well as insufficient demand from far-end users for tail hedging.
Wishing you successful trading this week!

You can use the SignalPlus trading indicator feature at t.signalplus.com for more real-time crypto information. If you want to receive our updates instantly, feel free to follow our Twitter account @SignalPlusCN, or join our WeChat group (add assistant WeChat: SignalPlus123), Telegram group, and Discord community to interact with more friends.
SignalPlus Official Website: https://www.signalplus.com
免责声明:本文章仅代表作者个人观点,不代表本平台的立场和观点。本文章仅供信息分享,不构成对任何人的任何投资建议。用户与作者之间的任何争议,与本平台无关。如网页中刊载的文章或图片涉及侵权,请提供相关的权利证明和身份证明发送邮件到support@aicoin.com,本平台相关工作人员将会进行核查。


