Daily Share
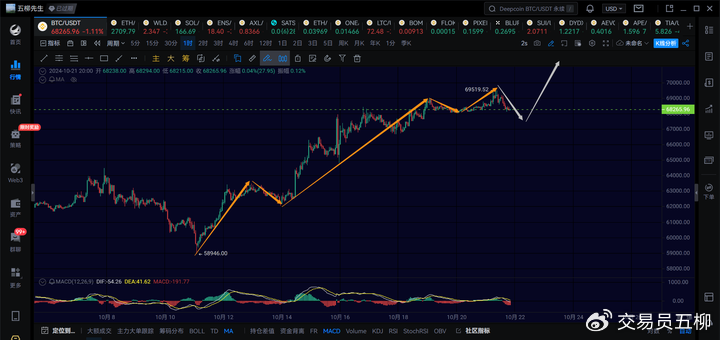
This morning, Bitcoin completed its weekly close, forming a relatively full bullish candlestick. Currently, the weekly MACD is locked in a golden cross above the zero line, and last night the price approached 70,000, reaching a high of 69,519. From multiple perspectives, this breakout above 70,000 to test the historical high of 73,777 seems inevitable. It is expected that this time it will not be like July 29, where it surged to 70,000 and then fell all the way down to 49,000. Therefore, I am inclined to believe that Bitcoin will continue to rise here. Since the main direction is to remain bullish, the current bullish sentiment can be slightly more aggressive, with expectations for this wave targeting the 75,000 to 80,000 range. After that, we can expect a daily pullback followed by another daily rise.
In the short term, if Bitcoin falls below 68,000, we should expect a 1-hour level pullback. However, the overall 4-hour upward trend is likely not over and will continue to push towards the 70,000 mark.
BTC
Due to the rapid changes in the market, this article can only make predictions based on the market conditions at the time of publication. Short-term traders should pay attention to the latest market changes and use this information as a reference.
1H:

At the 1-hour level, we need to observe the situation here. If Bitcoin falls below 68,000 in the short term, we should expect a 1-hour level pullback, with the lower target around 67,000. If it stays above 67,000, there should at least be a 1-hour level rebound to push above 70,000.
15M:

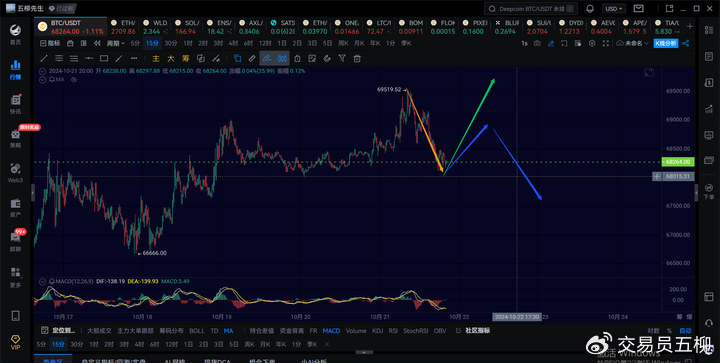
In the short-term structure, the probability of a 1-hour level pullback is still relatively high. Currently, we should see a 15-minute level rebound. If the 15-minute level rebound cannot break above 69,200, there should be a third 15-minute level decline, with the lower target around the 67,000 to 68,000 range. If it breaks above 69,200, we should watch for whether it continues to push towards 70,000 for a 1-hour upward extension. Currently, the probability of following the blue arrow is slightly higher.
ETH

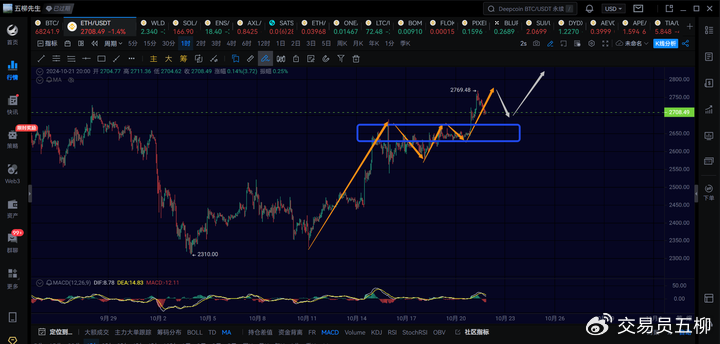
For Ethereum, we should observe the situation. If it can stabilize around 2,700 in the short term, there should be a 15-minute level rebound, with attention on whether it can break above 2,770 again. If it falls below 2,700, we should look for a 1-hour level pullback. As long as the pullback does not drop below 2,670, there should be a 1-hour level rebound to extend the 4-hour level rebound. The overall 4-hour rebound target for Ethereum remains at 2,830, and if it breaks through, it will aim for the 2,900 to 3,000 range.
Trend Direction
Weekly Level: The direction is upward, and the probability of a new weekly rebound is gradually increasing. 70,000 remains a key observation point.
Daily Level: The direction is upward, and in the short term, we continue to look at the 67,000 to 70,000 range. If it breaks above 70,000, the next target will be around 80,000.
4-Hour Level: The direction is upward, and the 4-hour level rebound has not yet ended, with hopes of breaking through 70,000 to reach around 74,000.
1-Hour Level: The direction is downward. If it falls below 68,000, we should look for a 1-hour level pullback. If it does not fall below that, we need to observe the strength of the next 15-minute level rebound.
15-Minute Level: The direction is upward, and in the short term, we expect a 15-minute level rebound. We should pay attention to the strength of the rebound.
Feel free to follow my public account for discussion and exchange:

The article is time-sensitive, please be aware of the risks. The views expressed are personal suggestions and for reference only!
免责声明:本文章仅代表作者个人观点,不代表本平台的立场和观点。本文章仅供信息分享,不构成对任何人的任何投资建议。用户与作者之间的任何争议,与本平台无关。如网页中刊载的文章或图片涉及侵权,请提供相关的权利证明和身份证明发送邮件到support@aicoin.com,本平台相关工作人员将会进行核查。


