Do not worry about having no friends on the road ahead; there are like-minded individuals on the investment journey. Good afternoon, everyone! I am the King of Coins from the Coin Victory Group. Thank you all for coming here to watch the articles and videos from the King, and I hope the brothers who have been following the King will return.

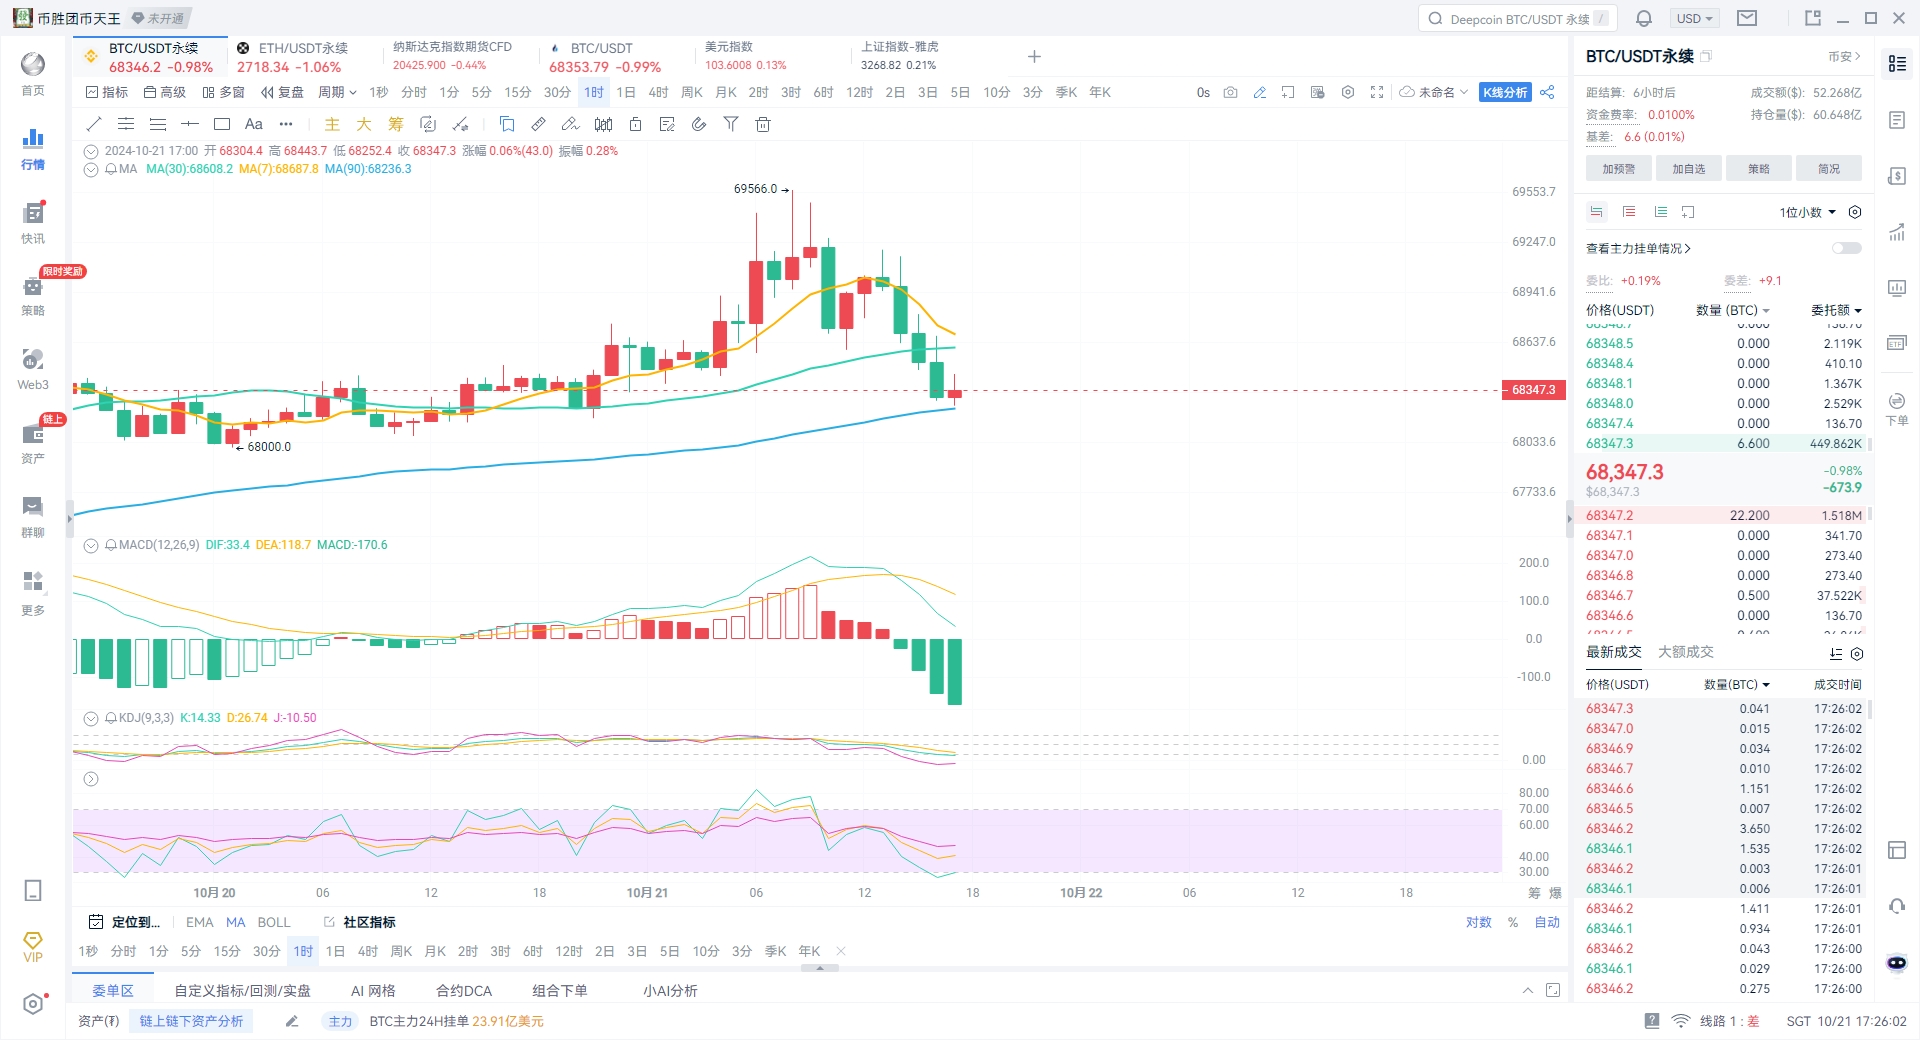
Today, Bitcoin continues its fluctuating pattern, with the price oscillating between $68,000 and $69,000, gradually approaching $69,000. Current market sentiment is slightly bullish; if the price can break through $69,000, it is expected to test $70,000. According to Mr. Coin's analysis, it is recommended that investors prepare in advance and consider going long during pullbacks, while paying close attention to whether the price can stabilize at this level after the breakout.
Technical Analysis shows that the Bollinger Bands on the short-term hourly chart are indicating an upward opening, but the price is still within a fluctuating range. The MACD indicator is below the zero line, but the fast and slow lines are gradually converging, which may form a golden cross, indicating that the short-term trend has not changed. The 5-day and 10-day moving averages show an upward trend, and it is expected that once the price breaks the fluctuating range, there is a high probability of continuing to rise.
Trading Suggestions:
Long Position: Go long in the range of $67,800 to $68,300, with a stop-loss set at $67,300 and a target above $68,800.
Short Position: If the price rises to the range of $70,800 to $71,300, consider a light short position, targeting around $69,800, with a stop-loss set at $72,900 and a stop-loss at $73,000.
Summary: Bitcoin is still in a fluctuating phase today, but short-term technical indicators suggest a potential breakout trend. Investors should pay attention to pullback opportunities and be prepared for stop-losses, operating in line with the trend to reduce risk.

Ethereum Market Summary (October 21, 2024)
Yesterday, Ethereum formed a large bullish candle, indicating a trend of increasing volume. The price has currently tested the 120-day moving average on the daily chart ($2,780), but faces significant pressure at this level. In the short term, support is mainly concentrated at the previous neckline support of $2,700 and the 60-day moving average on the weekly chart at $2,680. If the price pulls back and holds above these two key support levels, it is expected to test the high-pressure point of $2,780 again in the short term.
Trading Suggestions:
Go long with a light position near $2,700, and consider adding to the position if it pulls back to $2,680.
The target range is $2,750 to $2,780, paying attention to whether it can break the high point.
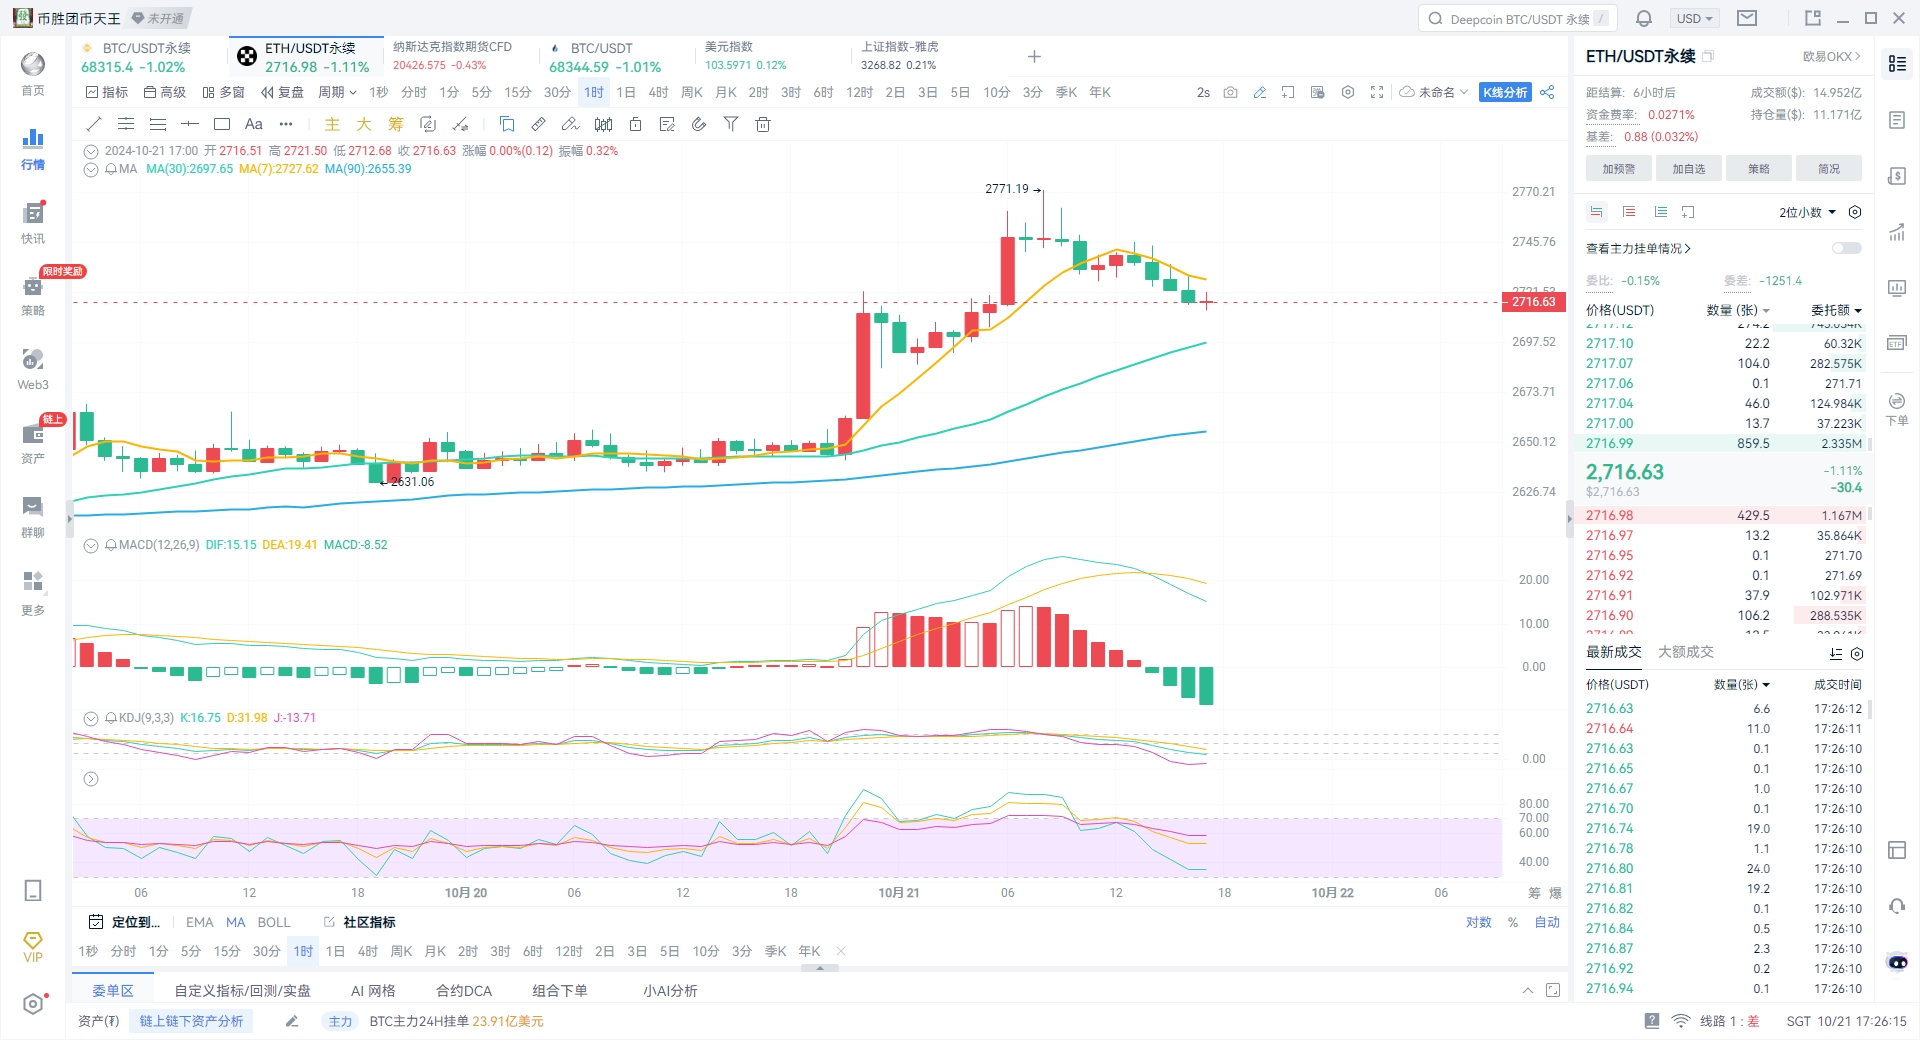
Summary: Ethereum shows a strong rebound trend in the short term. Although it encounters resistance at $2,780, if it can hold above the support level of $2,700, there is still potential for further upward movement. Investors should pay attention to changes at key levels and adjust their positions in line with market trends.
This article is independently written by the Coin Victory Group. Friends who need current price strategies and solutions can find the Coin Victory Group online. Recently, the market has been mainly fluctuating, accompanied by intermittent spikes, so when making trades, remember to control your take-profit and stop-loss levels. In the future, when facing significant market data, the Coin Victory Group will also organize live broadcasts across the internet. Friends who wish to watch can find the Coin Victory Group online and contact me for the link.

Mainly focused on spot and contract trading for BTC/ETH/ETC/LTC/EOS/BSV/ATOM/XRP/BCH/LINK/TRX/DOT, specializing in styles, mobile locking strategies around high and low support and resistance for short-term fluctuations, medium to long-term trend trades, daily extreme pullbacks, weekly K-top predictions, and monthly head predictions.
免责声明:本文章仅代表作者个人观点,不代表本平台的立场和观点。本文章仅供信息分享,不构成对任何人的任何投资建议。用户与作者之间的任何争议,与本平台无关。如网页中刊载的文章或图片涉及侵权,请提供相关的权利证明和身份证明发送邮件到support@aicoin.com,本平台相关工作人员将会进行核查。


