
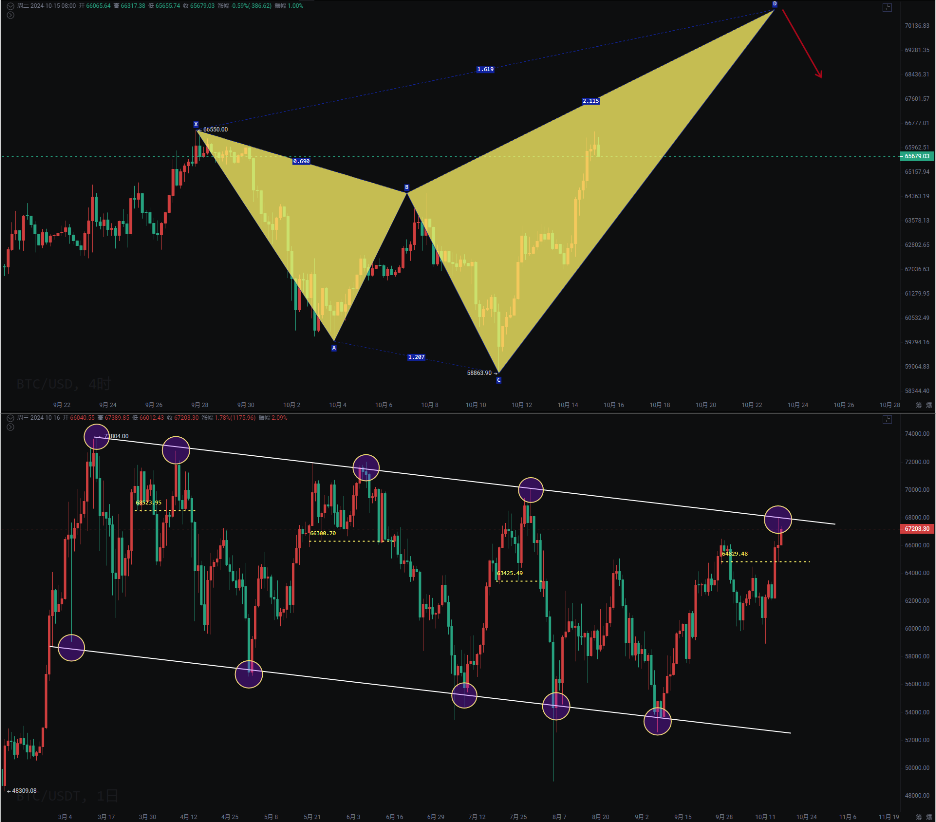
Bitcoin's weekly closing has broken through the ascending flag pattern. This week, it opened high and reached a maximum of 69,500, just a step away from the bearish deep-sea crab pattern we mentioned around 70,000. This wave rebounded from the spike low of 58,946 back to 60,300, reminding us to position ourselves, and with the breakout of the downward trend line, we have already gained 9,000 points in profit. Ethereum broke through the 4-hour trend line around 2,455 and has pulled up 330 points as of the time of writing.
The weekly MACD has crossed the zero axis with the fast and slow lines intersecting, indicating a weekly-level rebound that should at least target a breakout at 74,000. The next target is between 90,000 and 100,000. If you can't catch the best points to trade or are still focusing on small-scale movements of dozens or hundreds of points, you might miss the trend of a bull market.
Bitcoin
The daily chart continues to break through, reaching a high near 69,500. After the spike to 67,950 on the 15th, we reminded that the trend has been a narrow grinding upward movement, with only about 1,500 points gained over 5-6 days. Previously, we also noted that support has moved up from 66,666 to 67,600, and now support continues to rise to 68,500.
The 4-hour and 1-hour levels have also formed a lower slope channel during the upward trend. Although every time the market rises to around 70,000, there is extreme FOMO, the total open positions for Bitcoin contracts across the network have surpassed 40 billion USD. For friends without positions, we still remind you that there is no need to chase high prices; a pullback remains a good entry opportunity, and we will also remind you of the levels where you can add positions.
Support: Pressure:
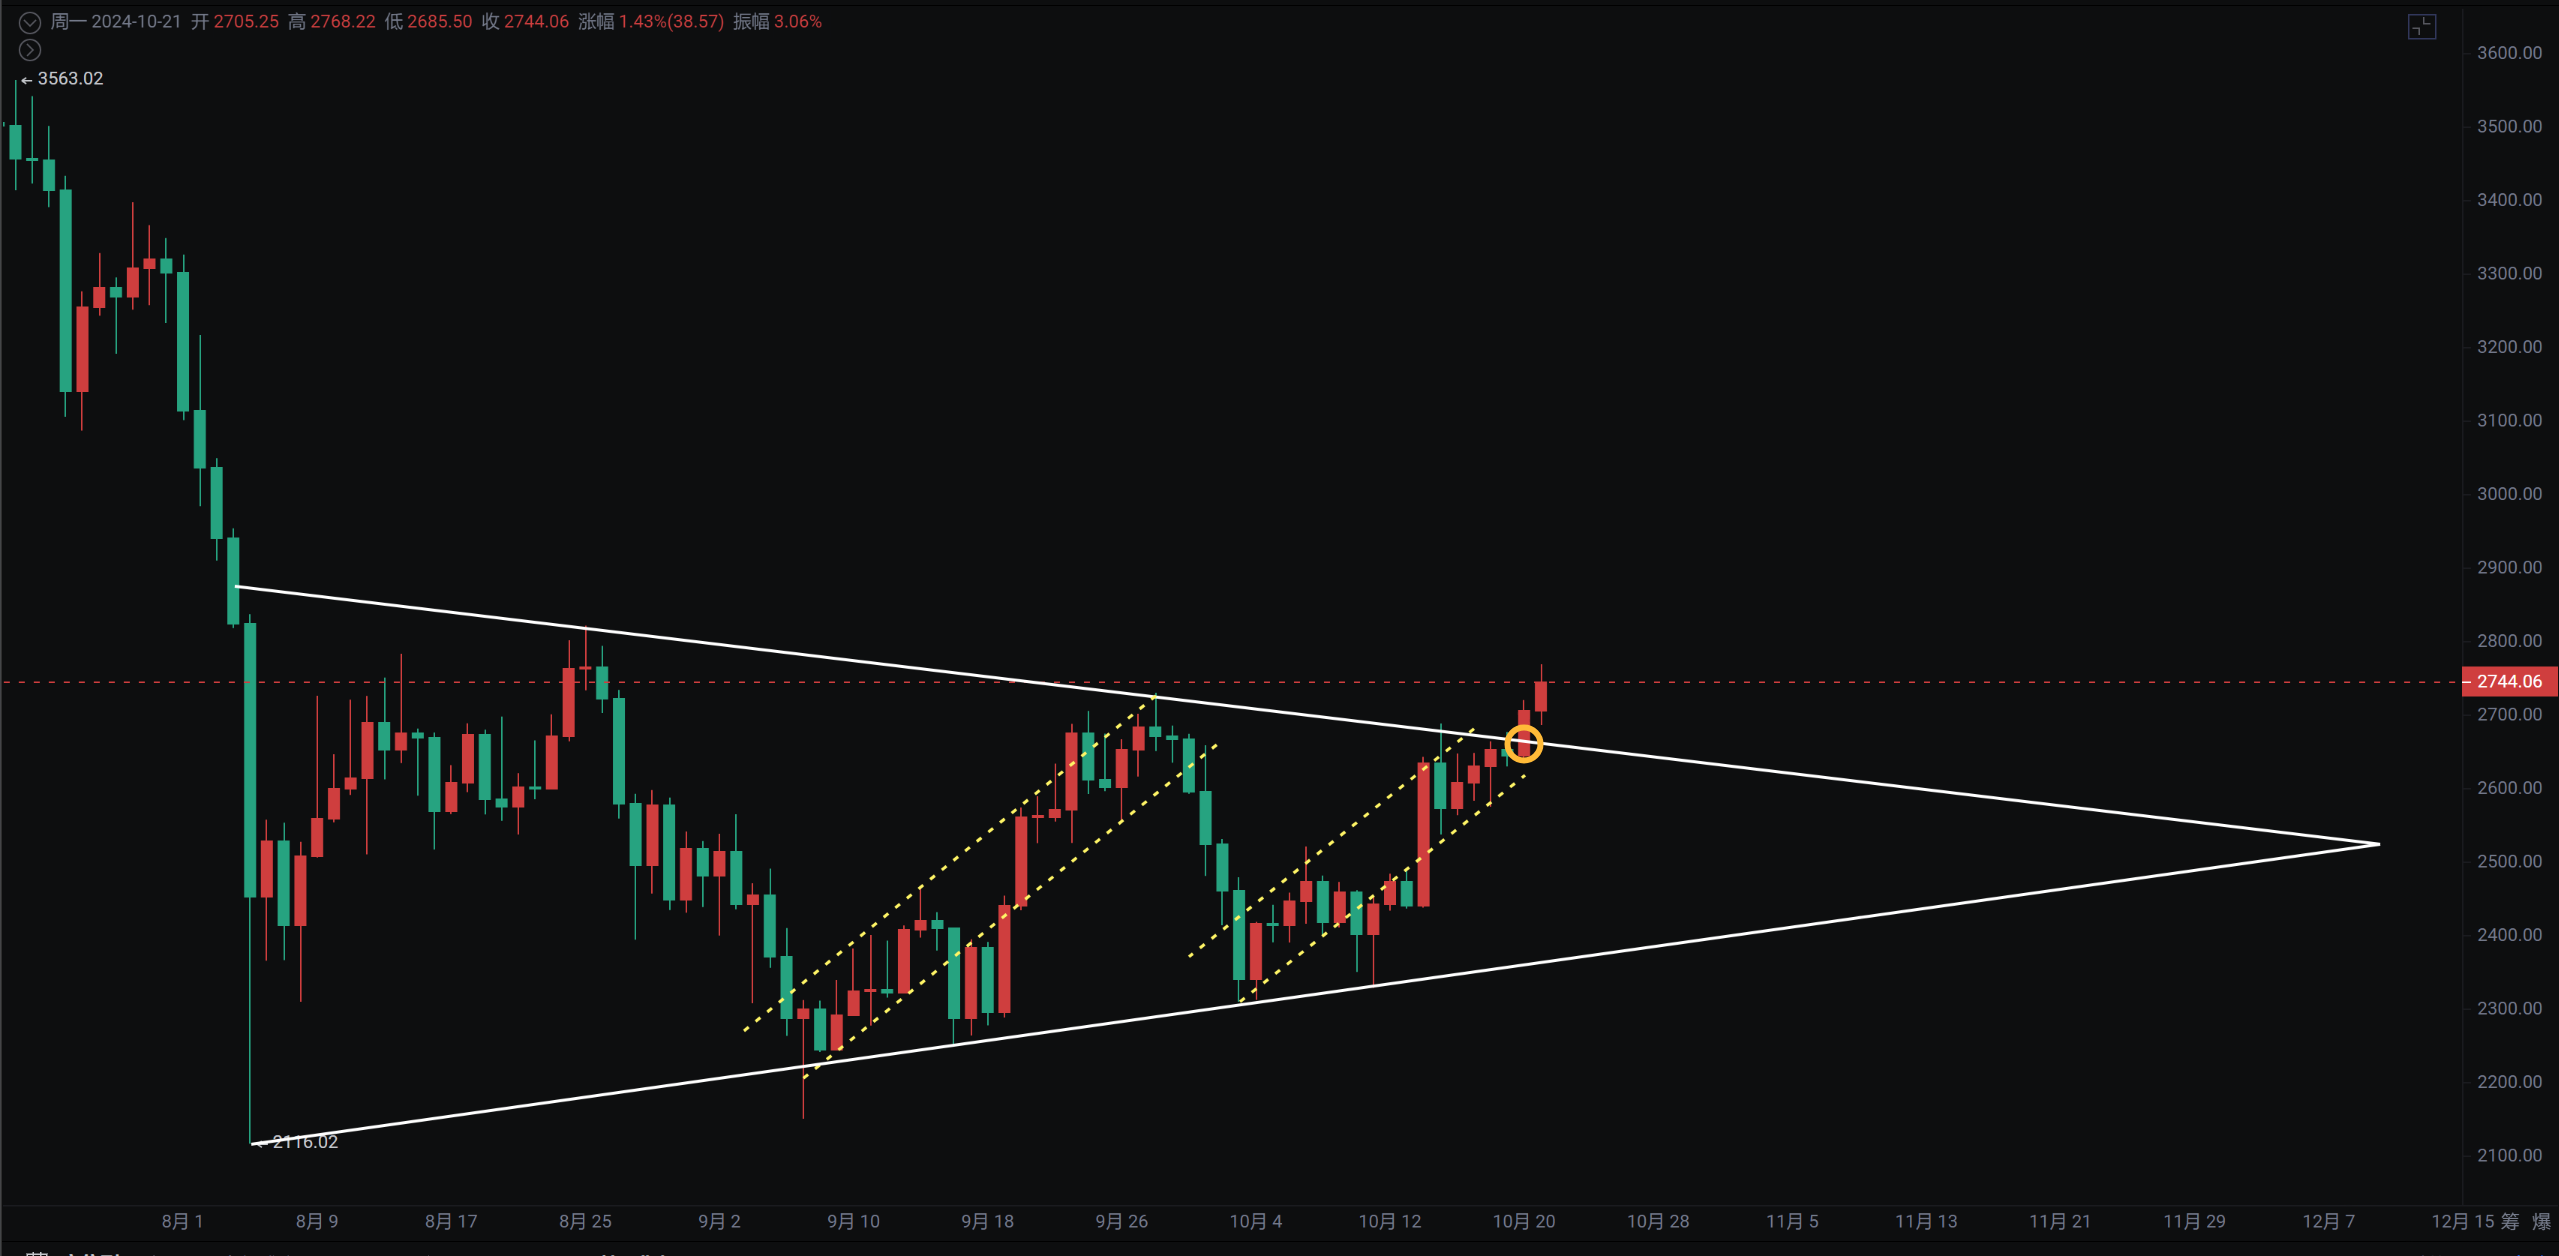
Ethereum
Last night, the daily chart broke out of a converging triangle, with the next resistance at 2,820. Previously, the daily chart also indicated an unstandard head and shoulders bottom pattern, which, once broken, could lead to a good market movement. The weekly MACD is slightly weaker than Bitcoin, but last week formed a morning star, which is also a bullish signal. A breakout above the 2,820 neckline could complete a bat pattern targeting around 3,300, but again, do not chase high prices.
The ETH/BTC exchange rate has seen a rebound after a few days of bottoming out, and we should also pay attention to whether the daily triangle pattern will break out.
Support: Pressure:
If you like my views, please like, comment, and share. Let's navigate through the bull and bear markets together!!!
The article is time-sensitive and for reference only, with real-time updates.
Focusing on K-line technical research, sharing global investment opportunities. Official account: Trading Prince Fusu

免责声明:本文章仅代表作者个人观点,不代表本平台的立场和观点。本文章仅供信息分享,不构成对任何人的任何投资建议。用户与作者之间的任何争议,与本平台无关。如网页中刊载的文章或图片涉及侵权,请提供相关的权利证明和身份证明发送邮件到support@aicoin.com,本平台相关工作人员将会进行核查。


