Cryptocurrency News
October 20 Highlights:
1. The unrealized losses of American banks are seven times that during the 2008 financial crisis.
2. Unisat: The maintenance of PizzaSwap has been completed, and the withdrawal function is now online.
3. Federal Reserve's Bostic: A significant first rate cut is appropriate, and I am very satisfied with this.
4. QCP: Bitcoin has shown strong growth this week, with market share reaching a multi-year high.
5. Data: The top five exchanges by cumulative spot and derivatives trading volume are Binance, OKX, Bybit, Bitget, and HTX.
Trading Insights
If there’s no market, just follow the rules.
Buy sideways, buy dips, don’t buy vertical sell points at the peak.
Continuous small rises are real rises; continuous large rises mean it’s time to exit.
A sharp drop with low volume is intimidation; a sharp drop with high volume means to withdraw quickly.
A significant surge needs a pullback; don’t dig deep pits, don’t buy too much.
LIFE IS LIKE
A JOURNEY ▲
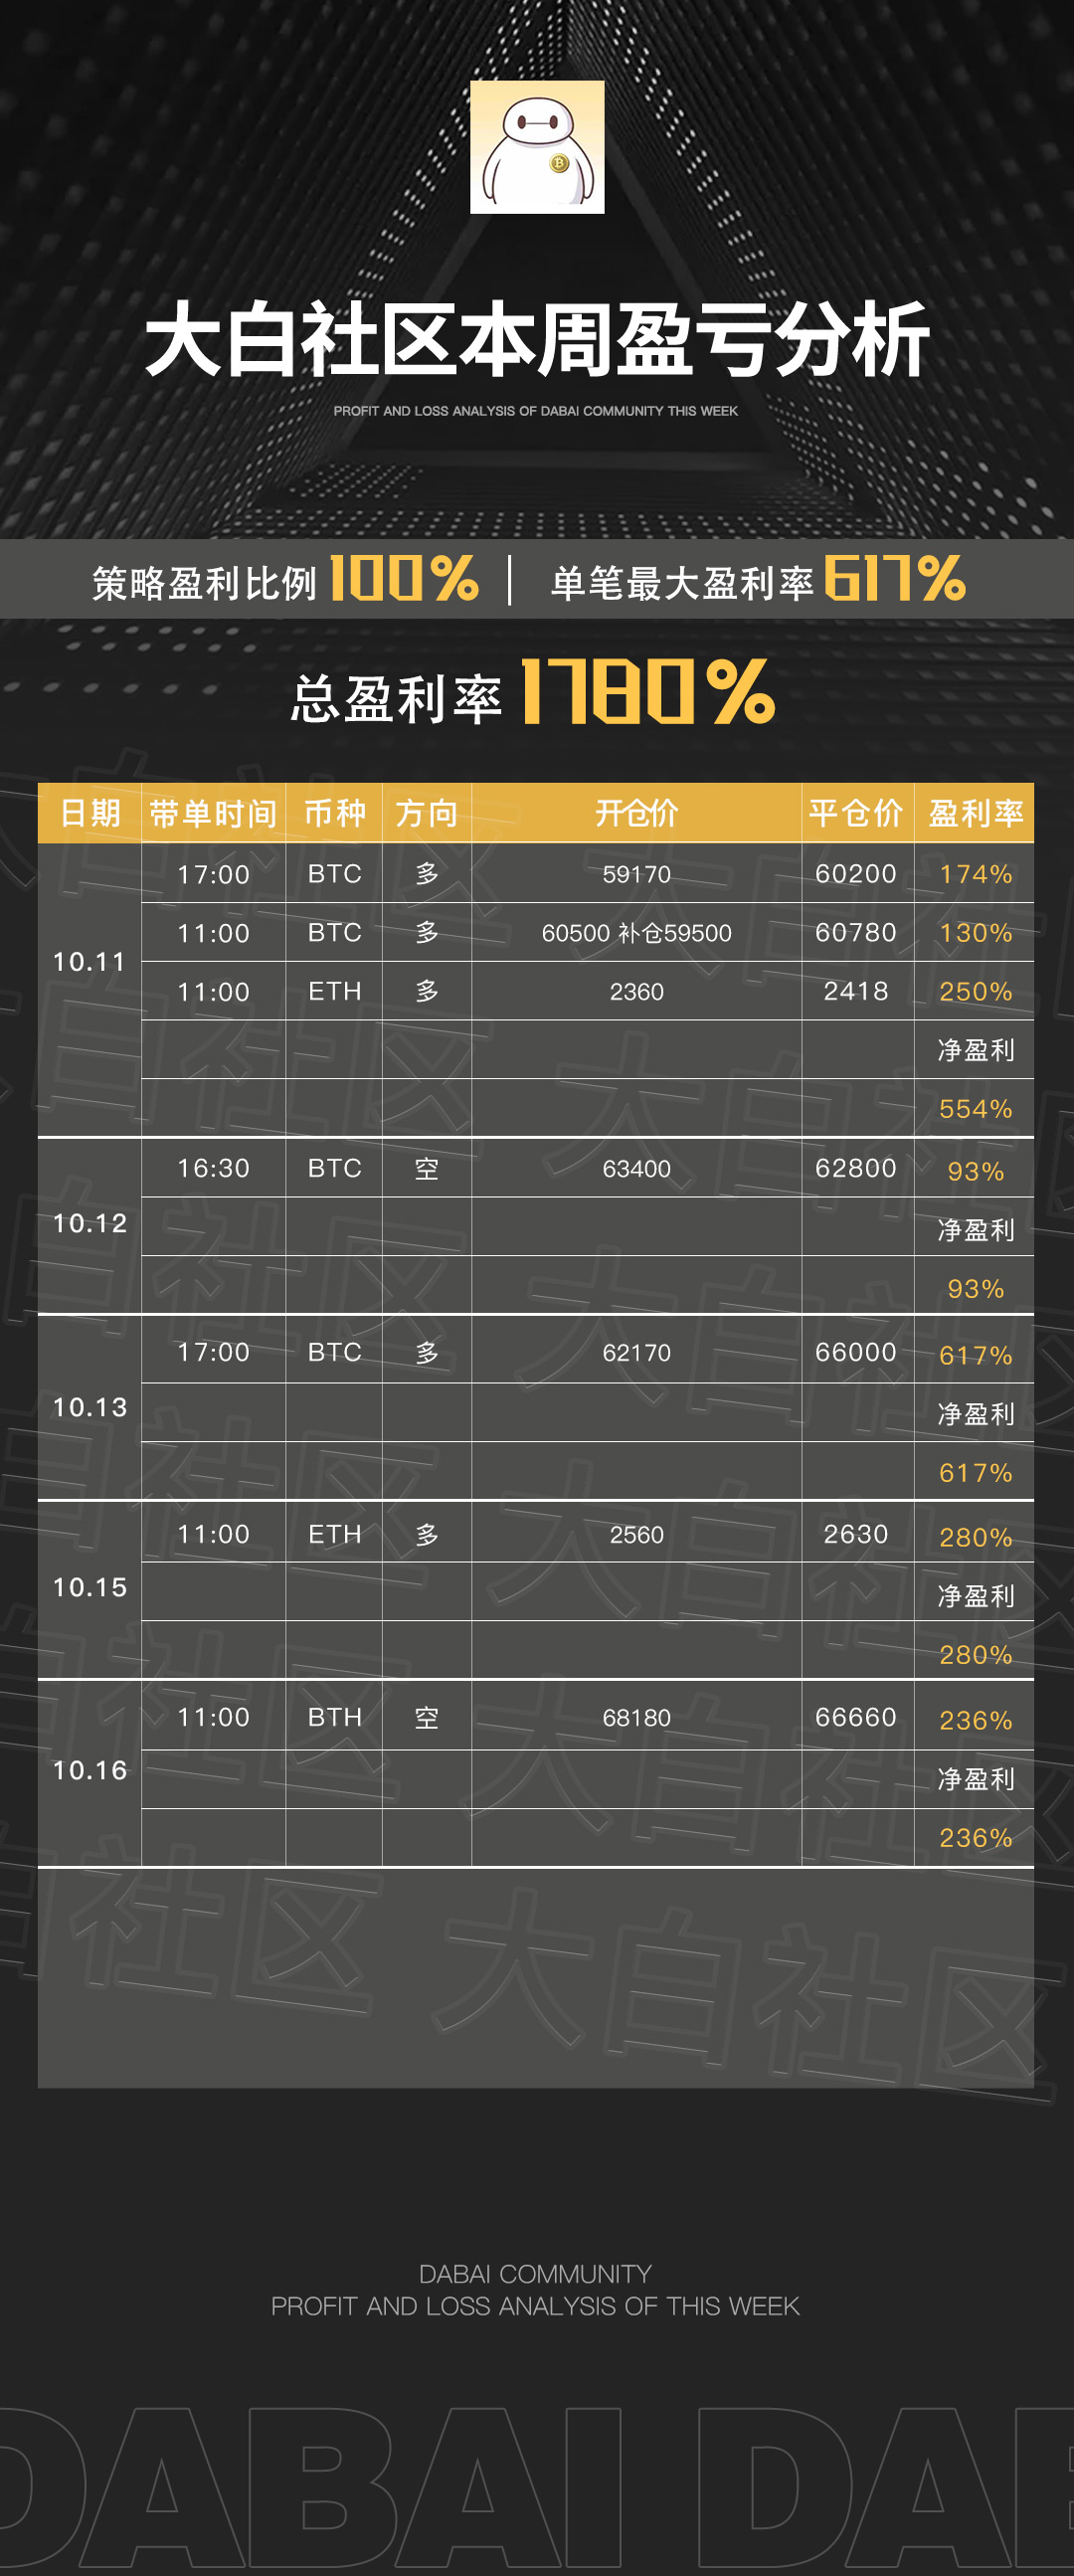
Below are the actual trades from the Big White Community this week. Congratulations to the friends who followed along. If your trades are not going well, you can come and test the waters.
The data is real, and each trade has a screenshot from the time it was issued.
Search for the public account: Big White Talks About Coins
BTC
Analysis
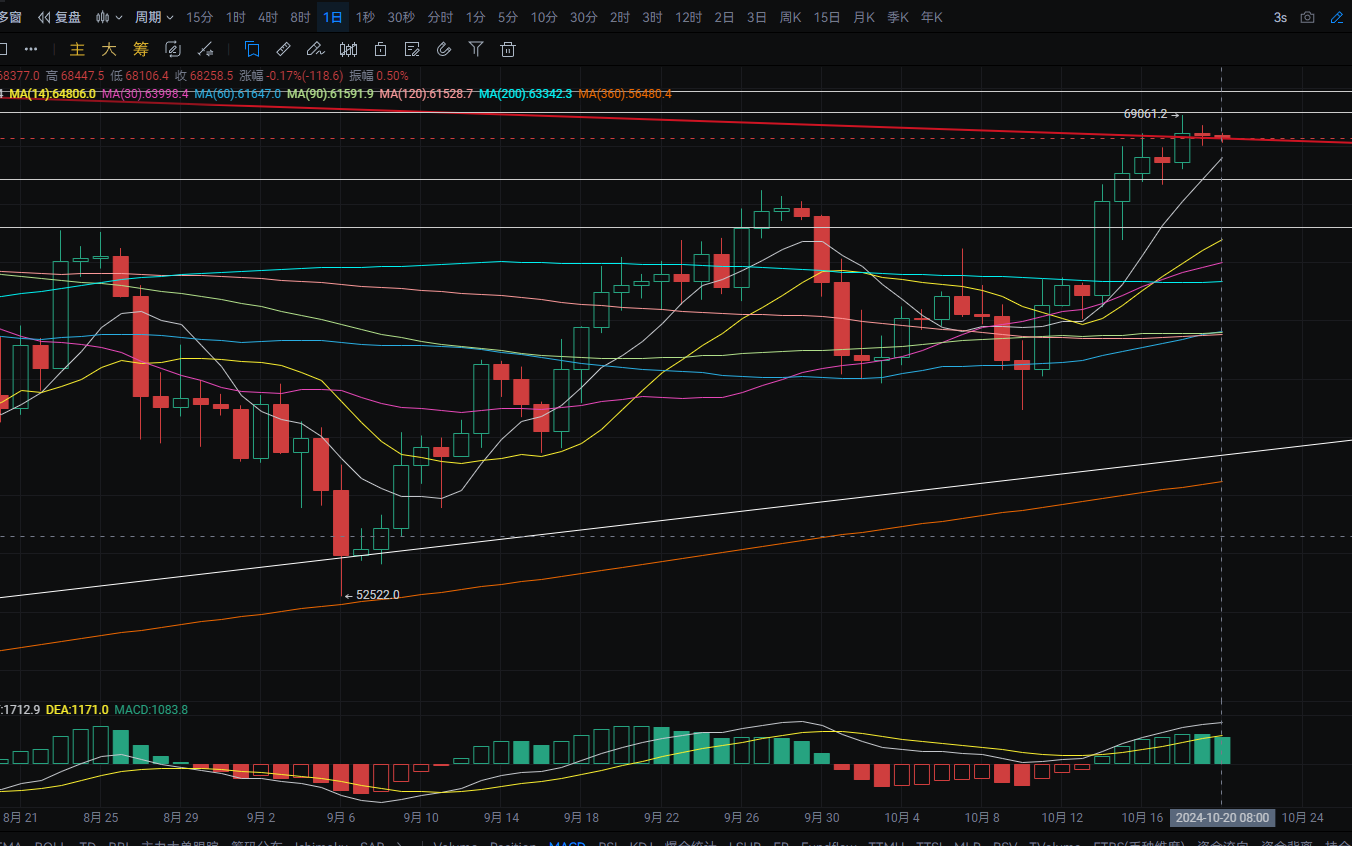
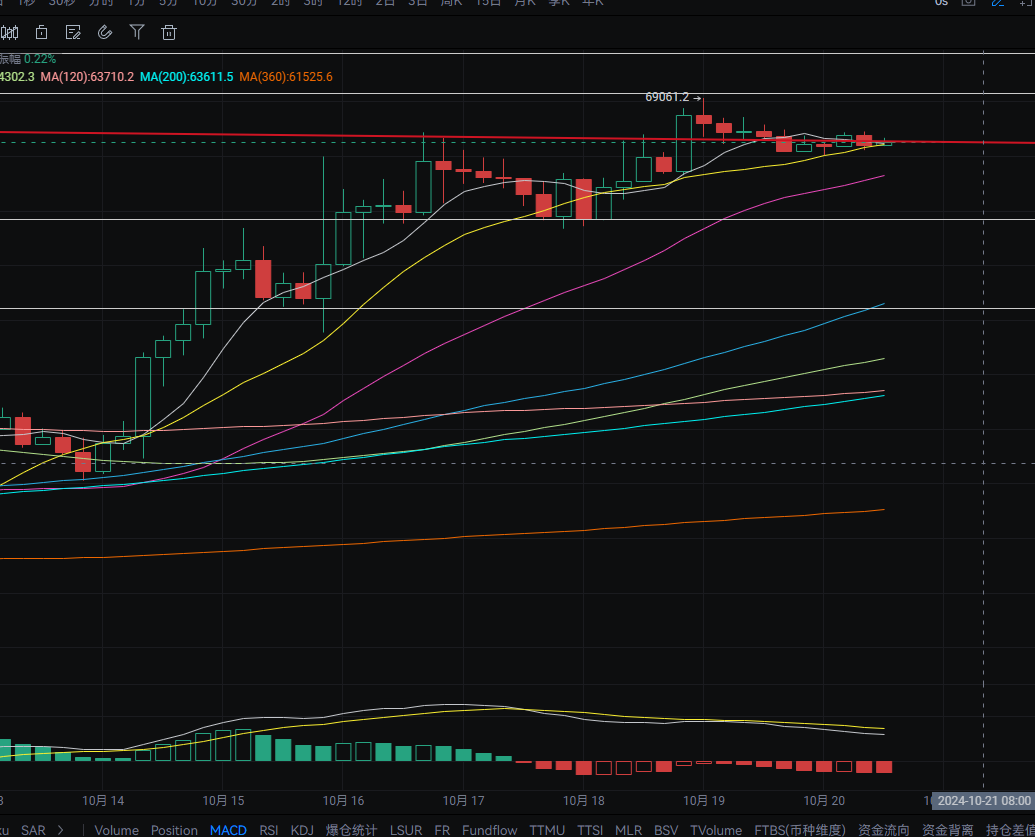
Bitcoin's daily chart formed a doji yesterday, with a high spike near 68,700 and a low drop near 68,000, closing around 68,400. The support level is near the MA7 moving average; if it breaks, it could drop to the MA14 level. The resistance at the top is near the 70,000 mark; a rebound to this area could be a short opportunity. MACD shows a decrease in bullish momentum. The four-hour chart shows a bottom divergence, with support near the MA30; if it breaks, it could drop to the MA60. MACD shows an increase in bearish momentum. A short-term target is set around 69,270-69,900 for a short position, with a target looking at 66,810-65,200.
ETH
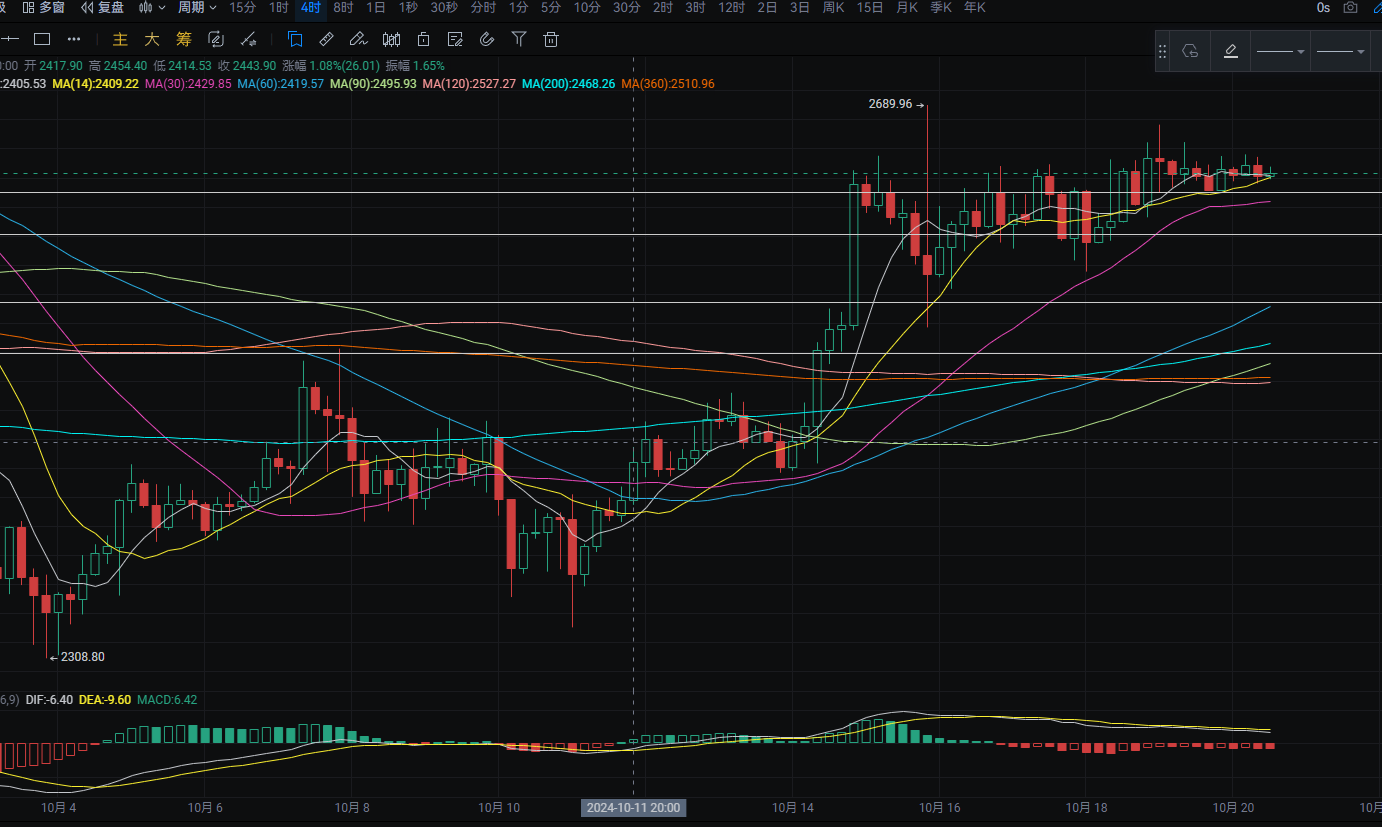
Analysis
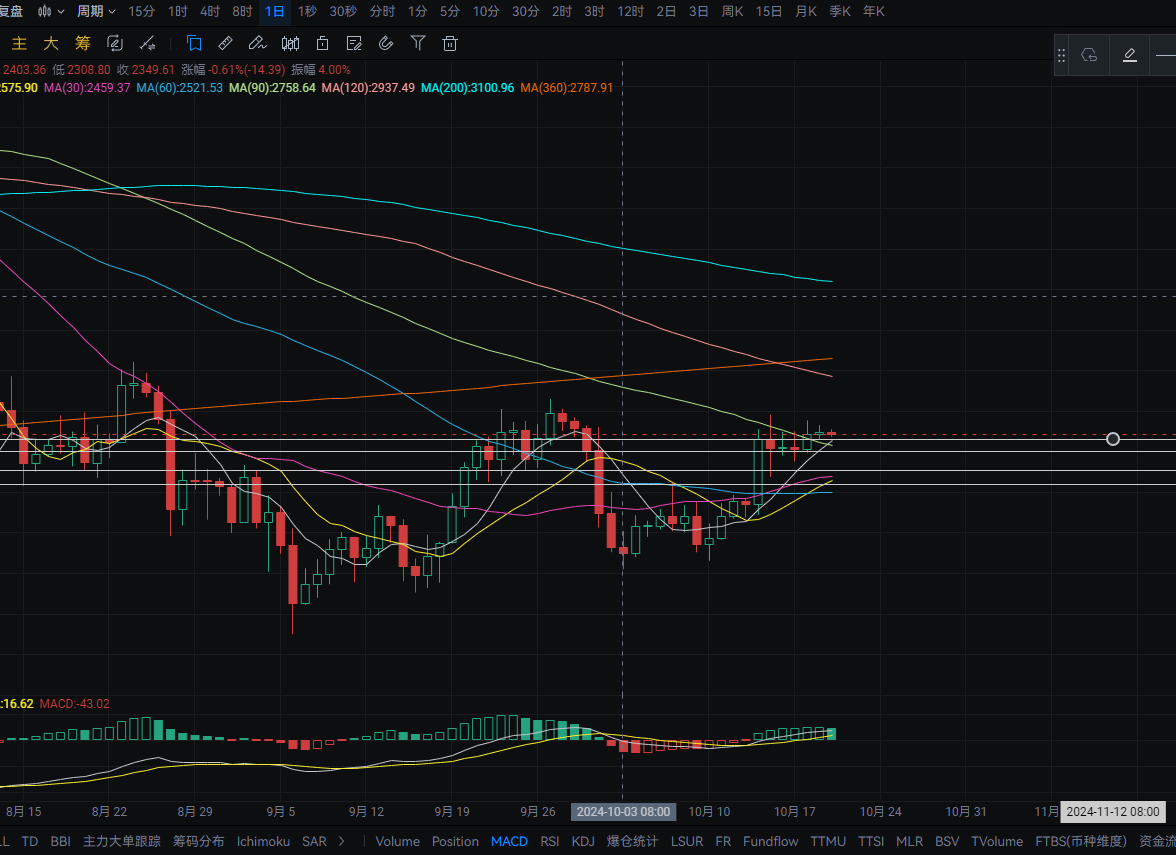
Ethereum's daily chart formed a doji yesterday, with a high spike near 2,665 and a low drop near 2,630, closing around 2,650. The support level is near the MA90; if it breaks, it could drop to the MA30. A pullback could be a buying opportunity nearby. MACD shows a decrease in bearish momentum. The four-hour chart continues to oscillate, with support near the MA60; if it breaks, it could drop to the bottom MA90. A pullback could be a buying opportunity nearby. MACD is flattening out. A short-term target is set around 2,553-2,520 for a long position, with a rebound target looking at 2,600-2,630.
Disclaimer: The above content is personal opinion and for reference only! It does not constitute specific trading advice and does not bear legal responsibility. Market conditions change rapidly, and the article may have some lag. If you have any questions, feel free to consult.
免责声明:本文章仅代表作者个人观点,不代表本平台的立场和观点。本文章仅供信息分享,不构成对任何人的任何投资建议。用户与作者之间的任何争议,与本平台无关。如网页中刊载的文章或图片涉及侵权,请提供相关的权利证明和身份证明发送邮件到support@aicoin.com,本平台相关工作人员将会进行核查。


