
In the early morning, the price rose again to 69,000, just 1,000 points away from the 70,000 we mentioned. This wave has also gained over 8,000 points. We are focusing on trend-based large wave market movements. If you care about ultra-short-term fluctuations of dozens or hundreds of points, our analysis may not be very useful to you.
I discussed with a few friends who have been in asset management for several years. Without a major trend, we can only engage in phase fluctuation markets, which can still yield relatively considerable profits and be responsible to investors. During other times, we basically travel around the country; this is true trading, not being led by the market.
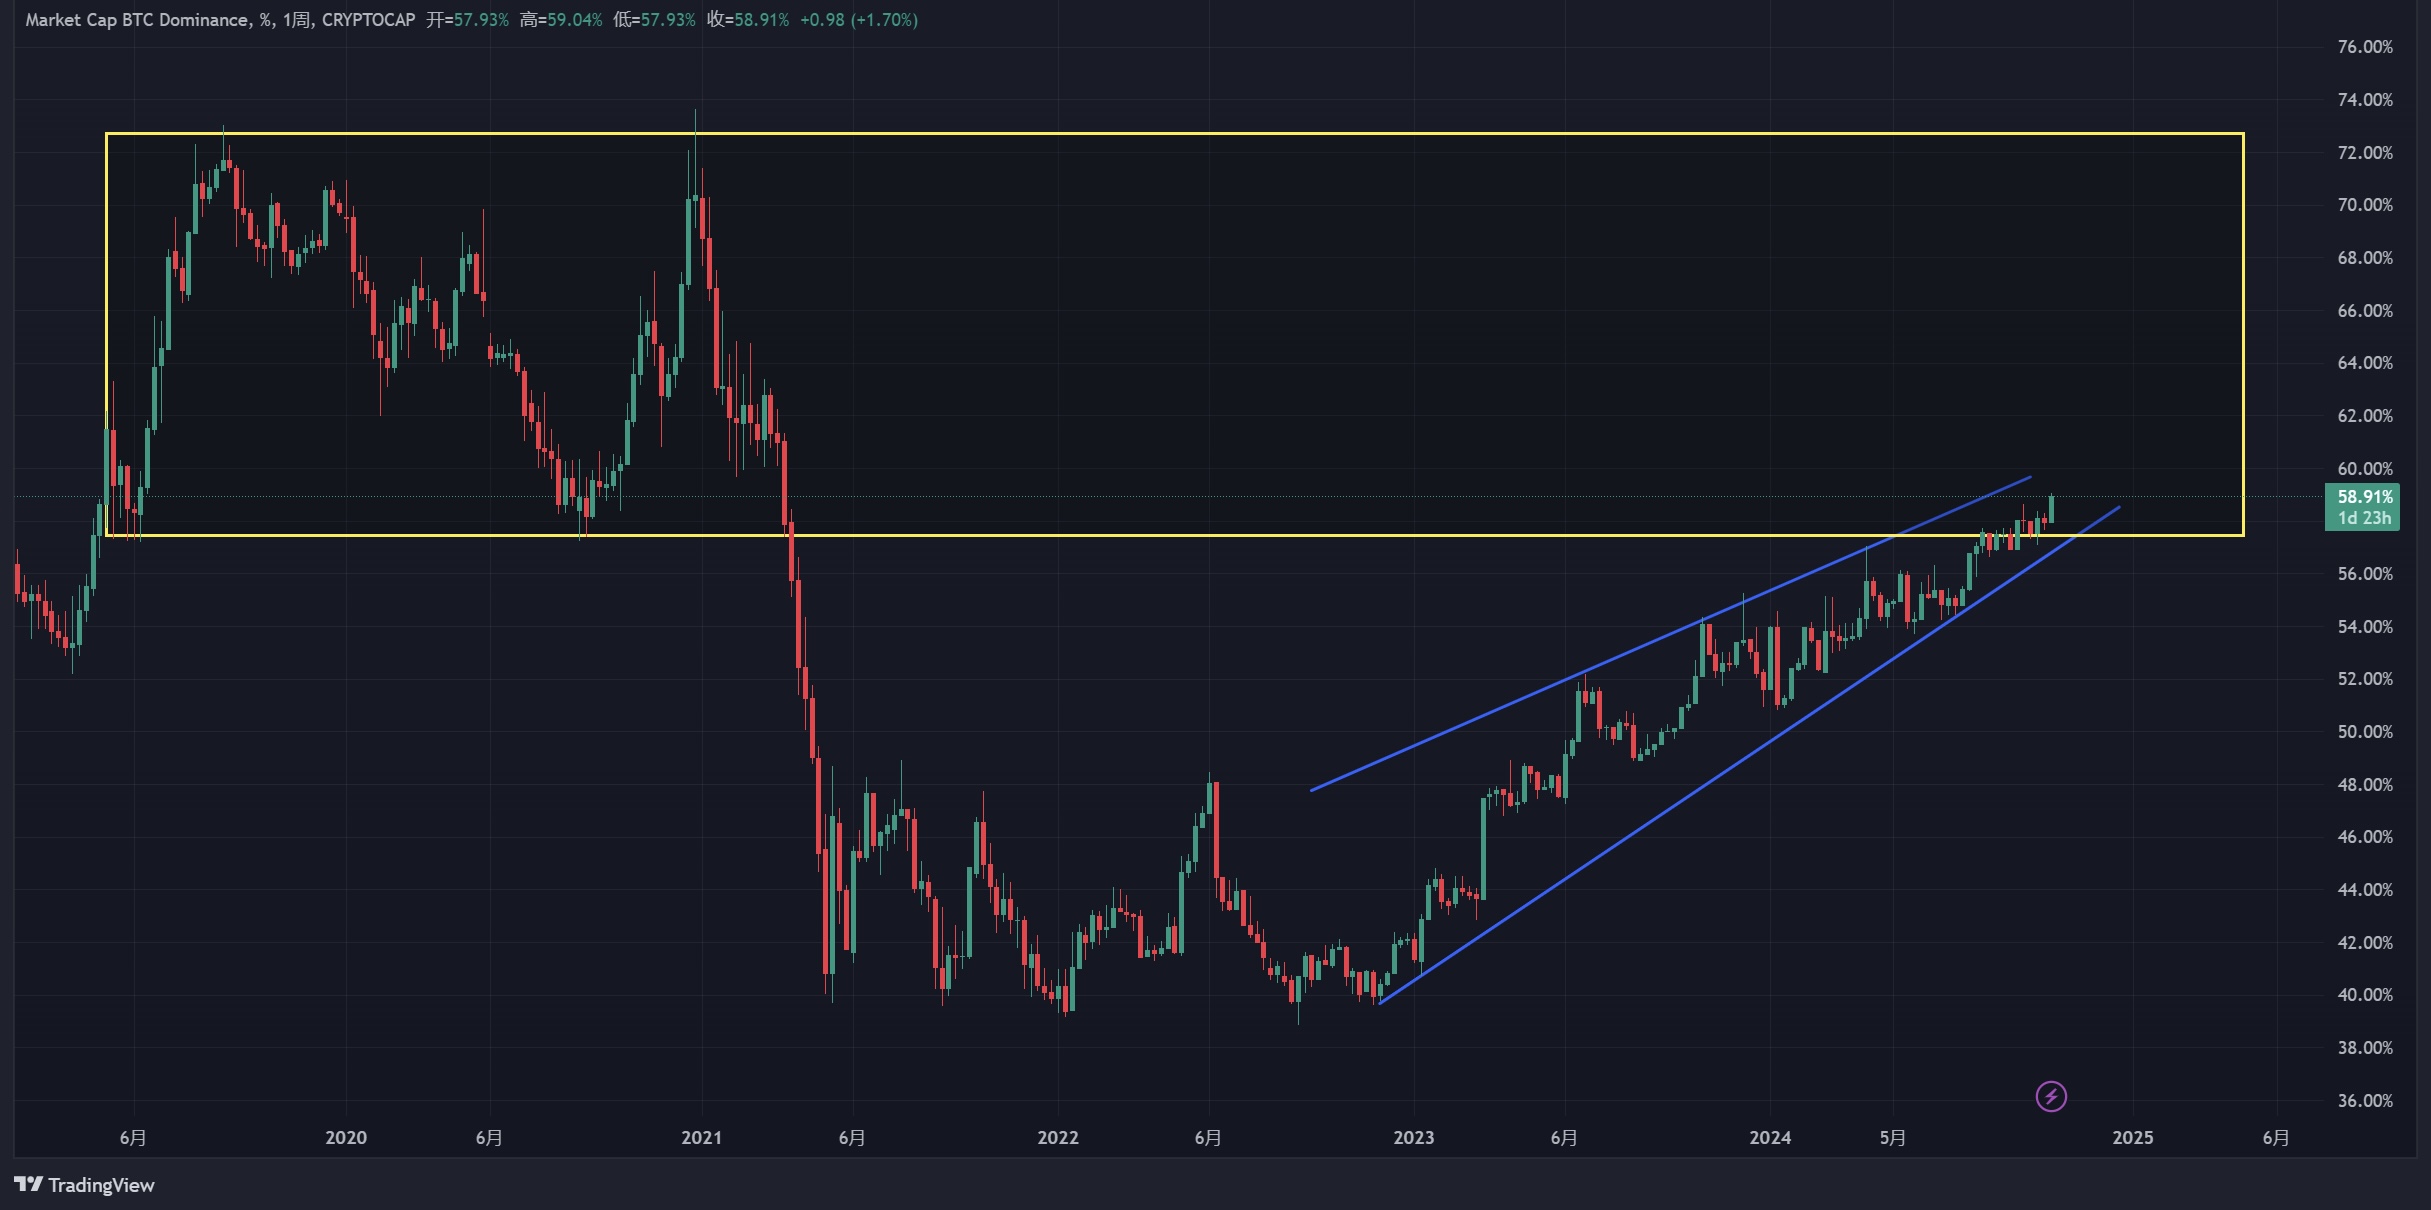
BTC·D total market cap accounts for 58.91%. Ethereum has been hovering near the downtrend line, and the ETH/BTC exchange rate is precarious. We need to pay extra attention to weak altcoins and look forward to a rebound market.
Bitcoin
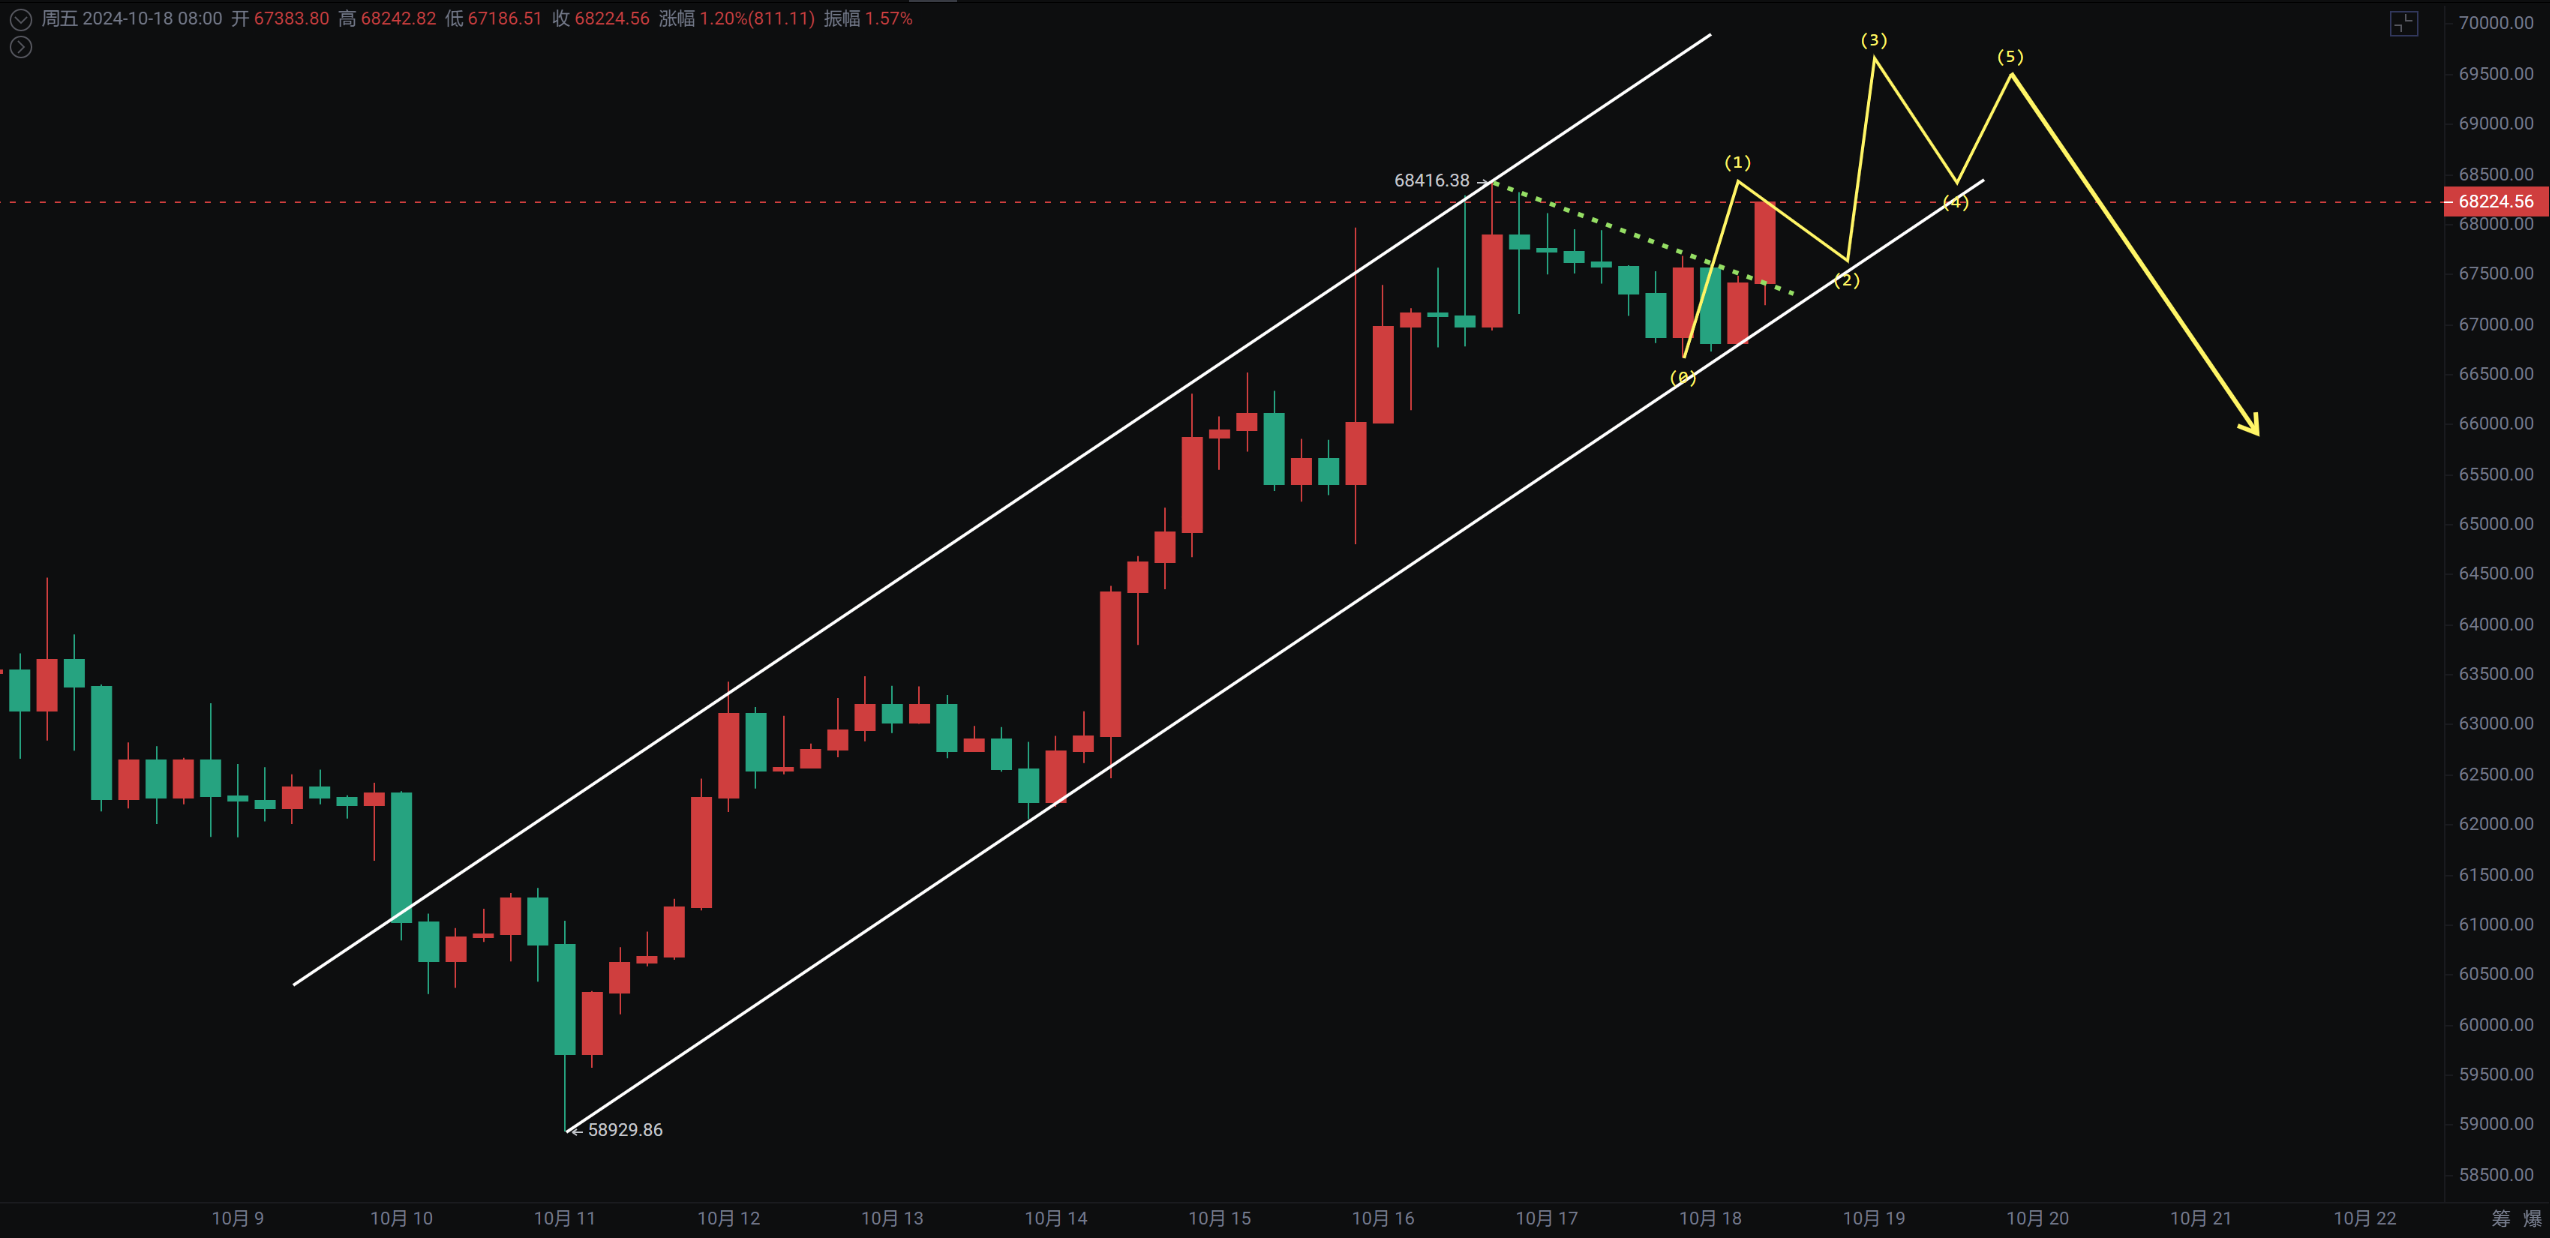
The most frequently asked question is whether the daily line has broken through. From the K-line chart, the daily ascending flag pattern has seen some breakthrough, but it is not yet stable. We have positioned ourselves with a long entry at 60,600 and added to our position near 62,000. We need to consider when to take profits, rather than when to enter.
The 3-day line has moved into a bullish phase, and the weekly MACD has turned red with a crossover of the fast and slow lines. If this week's closing can maintain its shape, we can expect a positive fourth quarter. The upward momentum on the daily line has weakened, which is a response to the previous pressure between 67,000 and 70,400.
The 4-hour and 1-hour ascending channels are still being maintained. In the short term, we continue to see a fluctuating upward trend with signs of divergence. The support level has moved up to 67,600 as mentioned yesterday.
Support: Resistance:
Ethereum
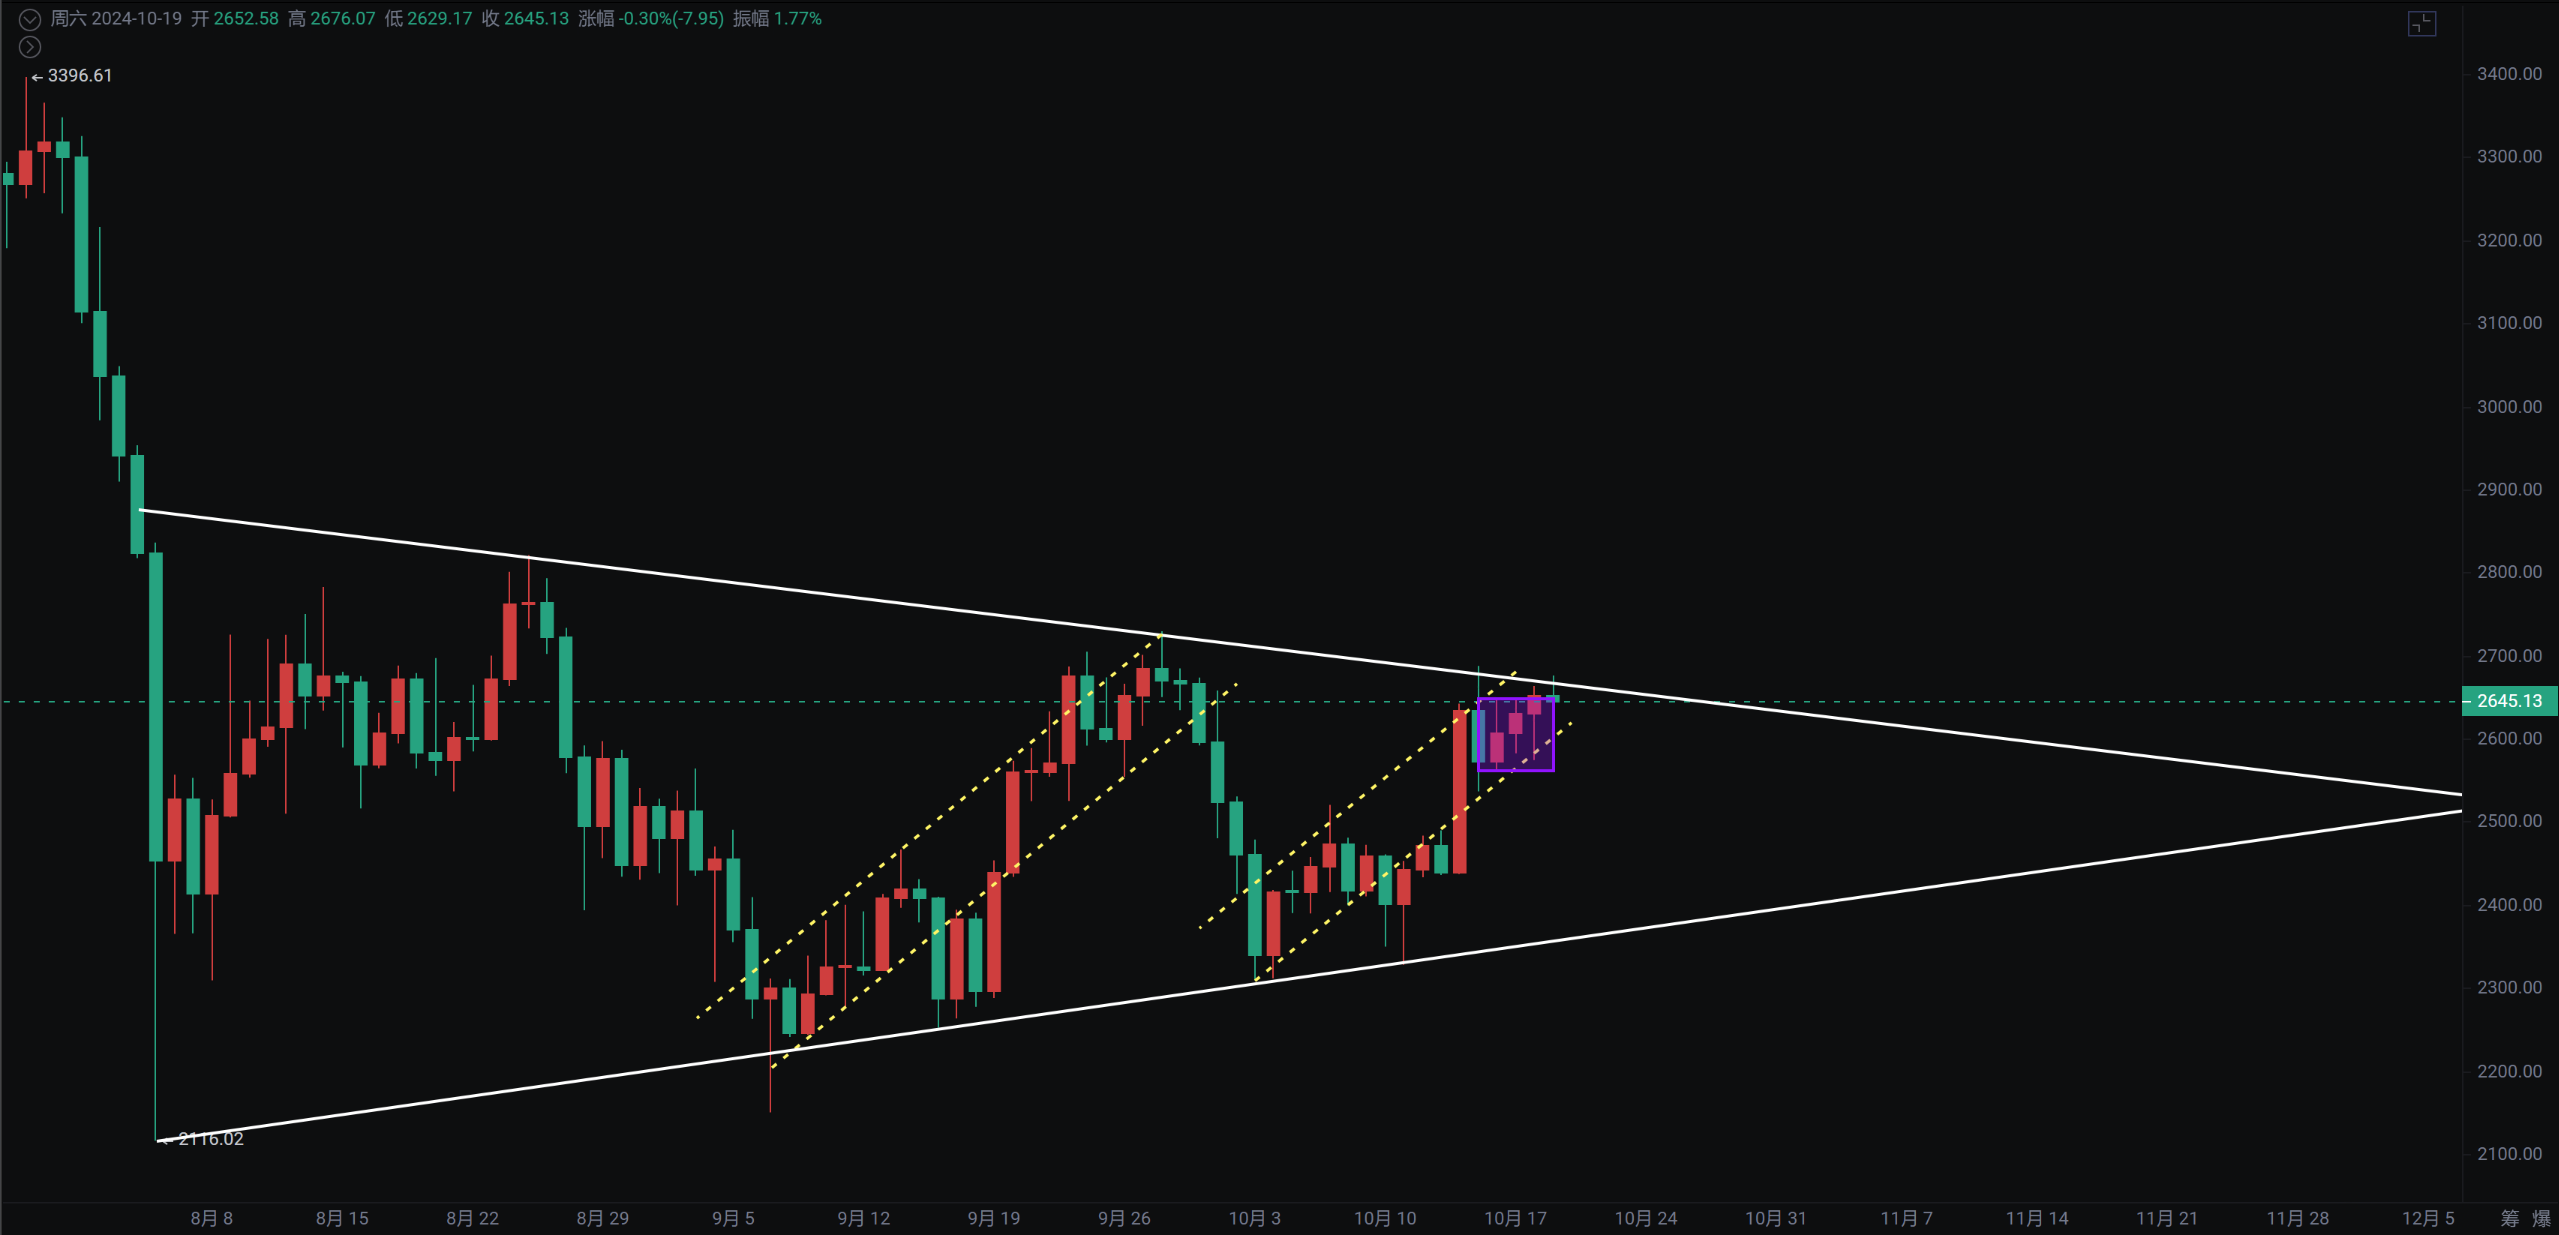
There hasn't been much change in the short term; it remains fluctuating, with a maximum rebound to 2,675, still below the 2,688 spike. The 4-hour MACD has been below the zero line since the spike at 2,688.
We also need to pay attention to Ethereum's rebound opportunities. Previously, we mentioned that the usual sequence is BTC—ETH—strong rebound altcoins—B—MEME coins—sharp decline. The ETH/BTC exchange rate is precarious and is nearing the breakout level of the head and shoulders pattern from 2019-2020. If it continues to decline, a rebound cannot be ruled out; it just depends on the height of the rebound.
Support: Resistance:
If you like my views, please like, comment, and share. Let's navigate through the bull and bear markets together!!!
This article is time-sensitive and for reference only; it is updated in real-time.
Focusing on K-line technical research, sharing global investment opportunities. Official account: Trading Prince Fusu

免责声明:本文章仅代表作者个人观点,不代表本平台的立场和观点。本文章仅供信息分享,不构成对任何人的任何投资建议。用户与作者之间的任何争议,与本平台无关。如网页中刊载的文章或图片涉及侵权,请提供相关的权利证明和身份证明发送邮件到support@aicoin.com,本平台相关工作人员将会进行核查。


