A series of on-chain indicators show that the market is gradually warming up, and funds are flowing in.
Written by: 1912212.eth, Foresight News
Although the market is not as optimistic as many hoped, it is also not as pessimistic as some feared. No one anticipated that the downward trend in the crypto market, which began in March of this year, would last for a full six months. At one point, the decline led some investors to vent their frustrations, criticizing everything from the heavens to exchanges. There were predictions from some ancient OGs that one should prepare for an 18-month long battle, and some whales even tweeted about giving up on the crypto space, urging more people to invest fully in A-shares.
Will there be an altcoin season? Every time the market is in doubt, it is precisely at the bottom range, and history always responds: there will be one.
History is often remarkably similar; in 2023, the market also began to quiet down around mid-year, only to take off starting in October last year. This year is no different. Interestingly, some funds seem to be smart, sensing the opportunity and quickly positioning themselves, resulting in a significant market surge by the end of September. After a brief pullback in early October, the self-fulfilling prophecy of "rising October" was once again realized, with the market climbing from a short-term low of $52,000 to $68,000, just $6,000 shy of its historical high. Meanwhile, some previously scorned altcoins have also seen substantial gains from their lows, even doubling or tripling in value.
After waiting for half a year, has the bull market arrived?
Bitcoin Spot ETF Data Continues to See Large Inflows
The data from Bitcoin spot ETFs represents the real purchasing power from the over-the-counter market. Unlike personal trading, it indicates that some individuals are willing to pay fees for others to purchase BTC on their behalf. Historically, when there is a significant net inflow, buying pressure tends to increase, often leading to a rise in Bitcoin prices; conversely, significant net outflows usually result in price declines.
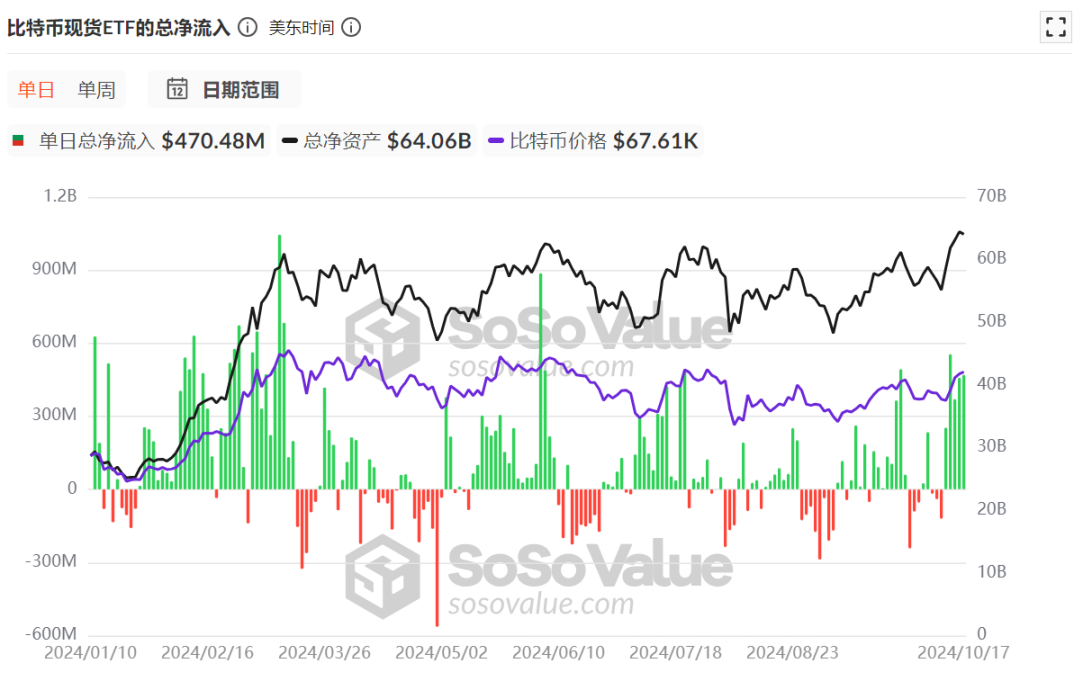
Since the official launch of the spot ETF, the total net inflow has reached $20.66 billion. Notably, from October 1 to date, there have been six days of net outflows, but seven days of net inflows, with the net inflow amounts being quite substantial. On October 14, the net inflow exceeded $555 million, and on October 16 and 17, the net inflows were both over $450 million, with October 15 seeing a net inflow of over $370 million.
Although the number of days with net inflows and outflows is roughly equal, the amount of net outflows is small, while the net inflows are often several times greater than the outflows.
Even the less favored Ethereum spot ETF has seen a rare single-day net inflow of $48.41 million since October.
The purchasing power of off-exchange funds remains quite strong.
Stablecoin Market Cap Approaches Historical Highs
The changes in the total market cap of stablecoins represent the size of fund inflows. Although the market has fluctuated over the past few years, when we broaden our perspective, it is hard to be pessimistic.
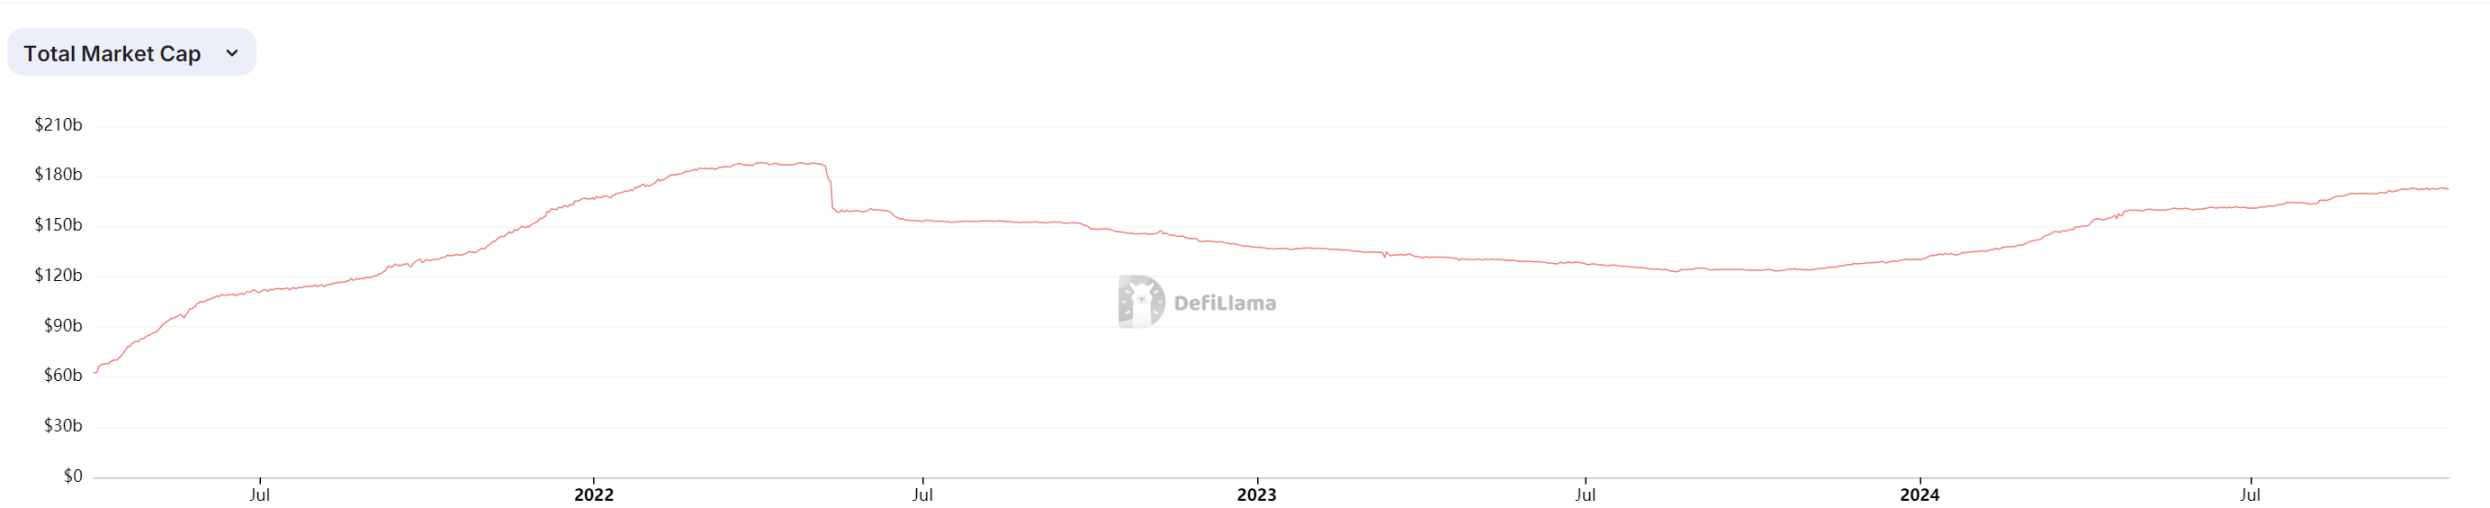
The total market cap of stablecoins reached a historical high of $18.63 billion in mid-2022, then continuously declined, but overall remained above $12 billion. Fast forward to October 2023, fund inflows have accelerated, and the total market cap of stablecoins has now exceeded $17.23 billion, nearing its historical high.
Unrealized Net Profit of BTC Shows Most Players Are in Profit
The unrealized net profit/loss of Bitcoin is a key indicator used to measure the profit/loss situation of on-chain Bitcoin players. We can see that the colors of the chart range from red, orange, light yellow, gray-white, to light blue from top to bottom. The bottom blue represents that most people are at a loss, while the top red indicates that most players are in profit.
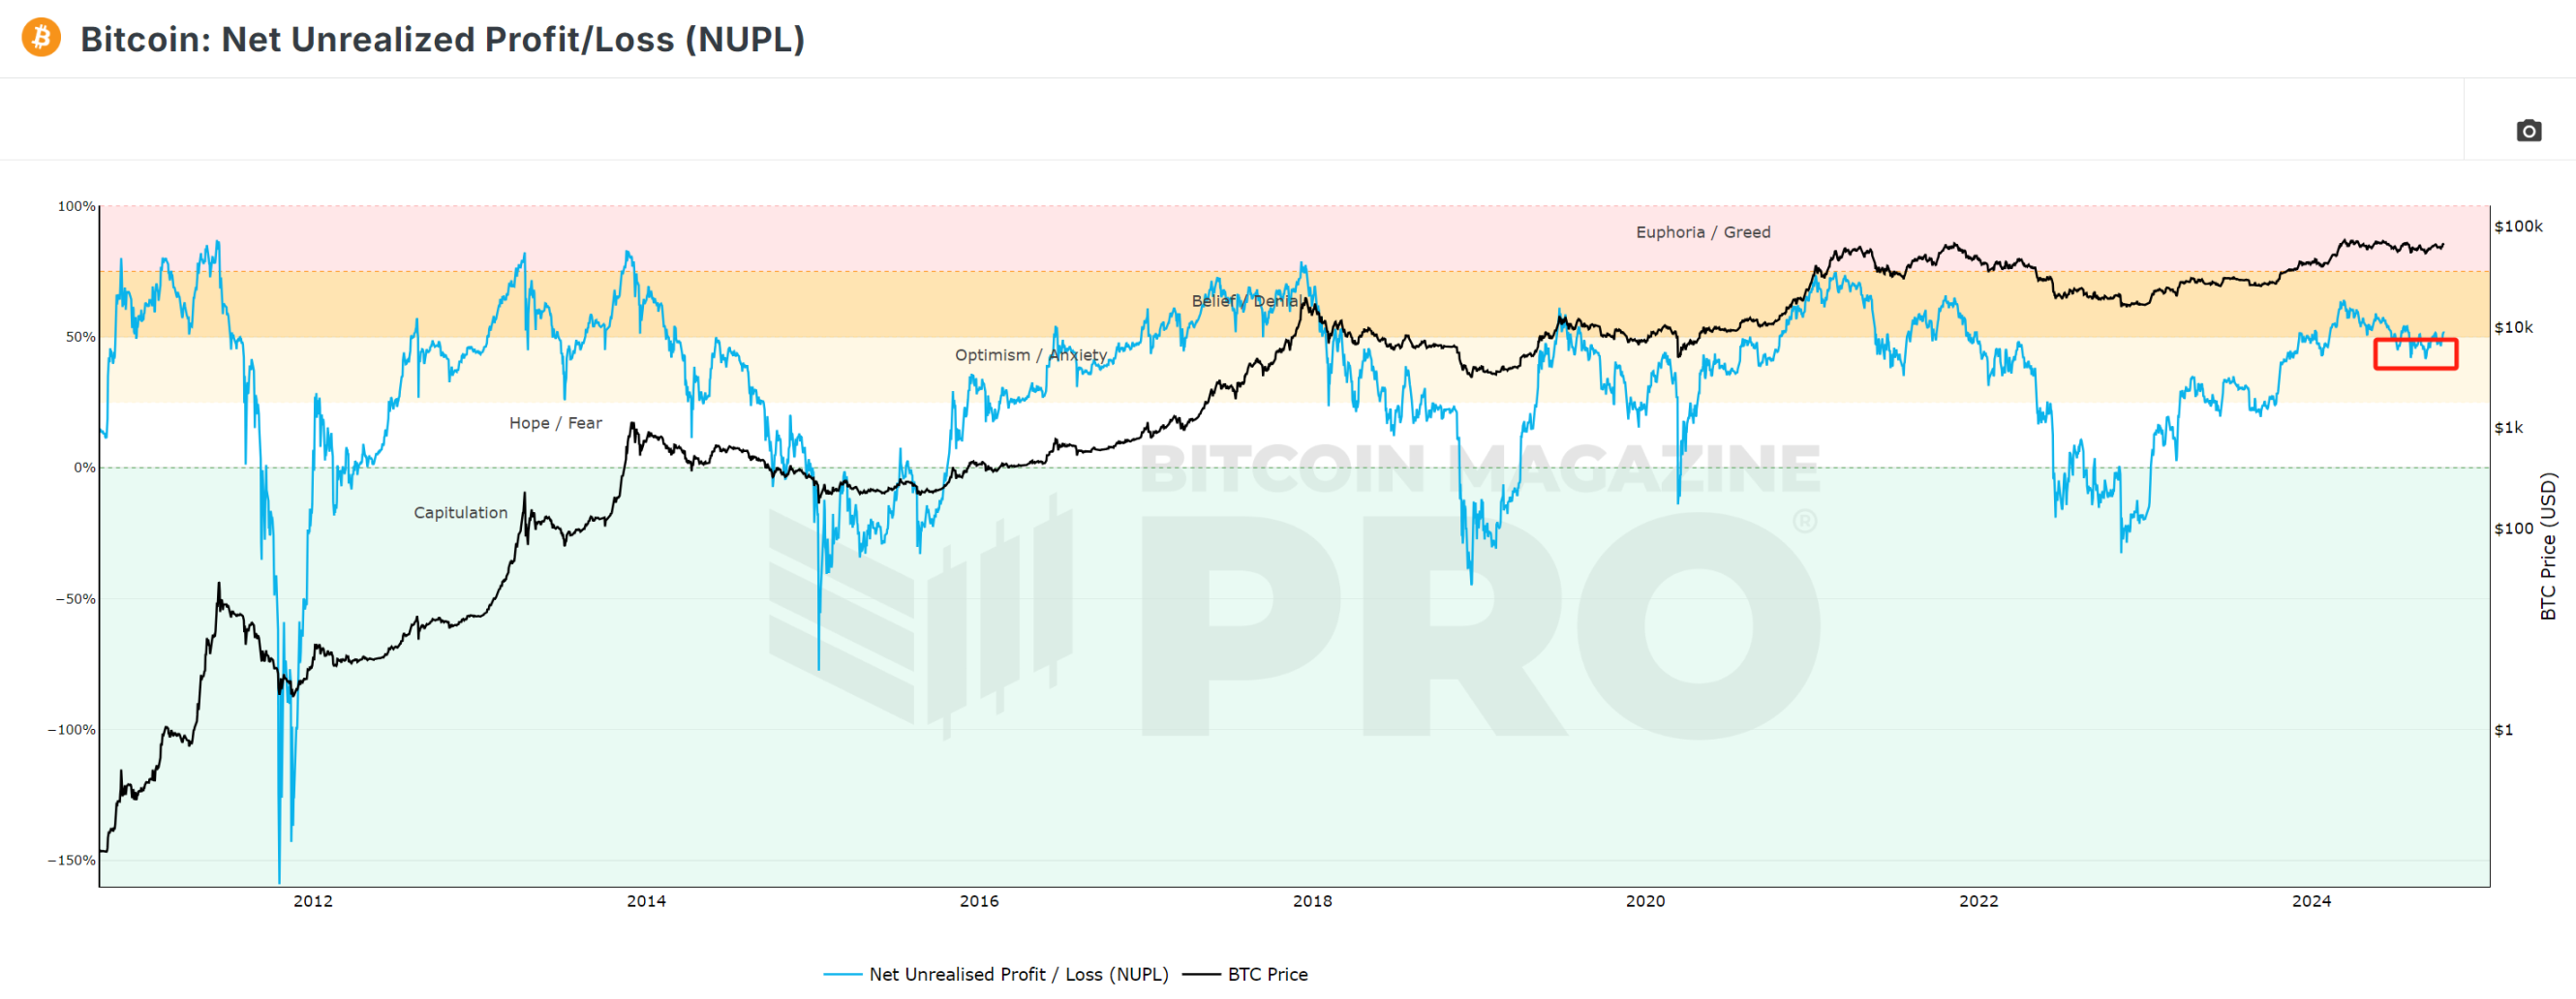
When the line chart is in the light blue area, it often indicates the bottom range of BTC prices, as those at a loss are continuously exiting the market. Conversely, when the line chart is in the yellow or red area, it typically indicates the top range of BTC prices, where many profit-taking players choose to exit, leading to a peak in the cycle. This cycle repeats itself.
From the line chart, the market has currently climbed from the light area back into the yellow area. According to data disclosed by IntoTheBlock, 95% of BTC addresses are now in profit, indicating a clear warming of market sentiment.
Historically, such levels often signal a strong bullish momentum, but they may also represent potential overextension.
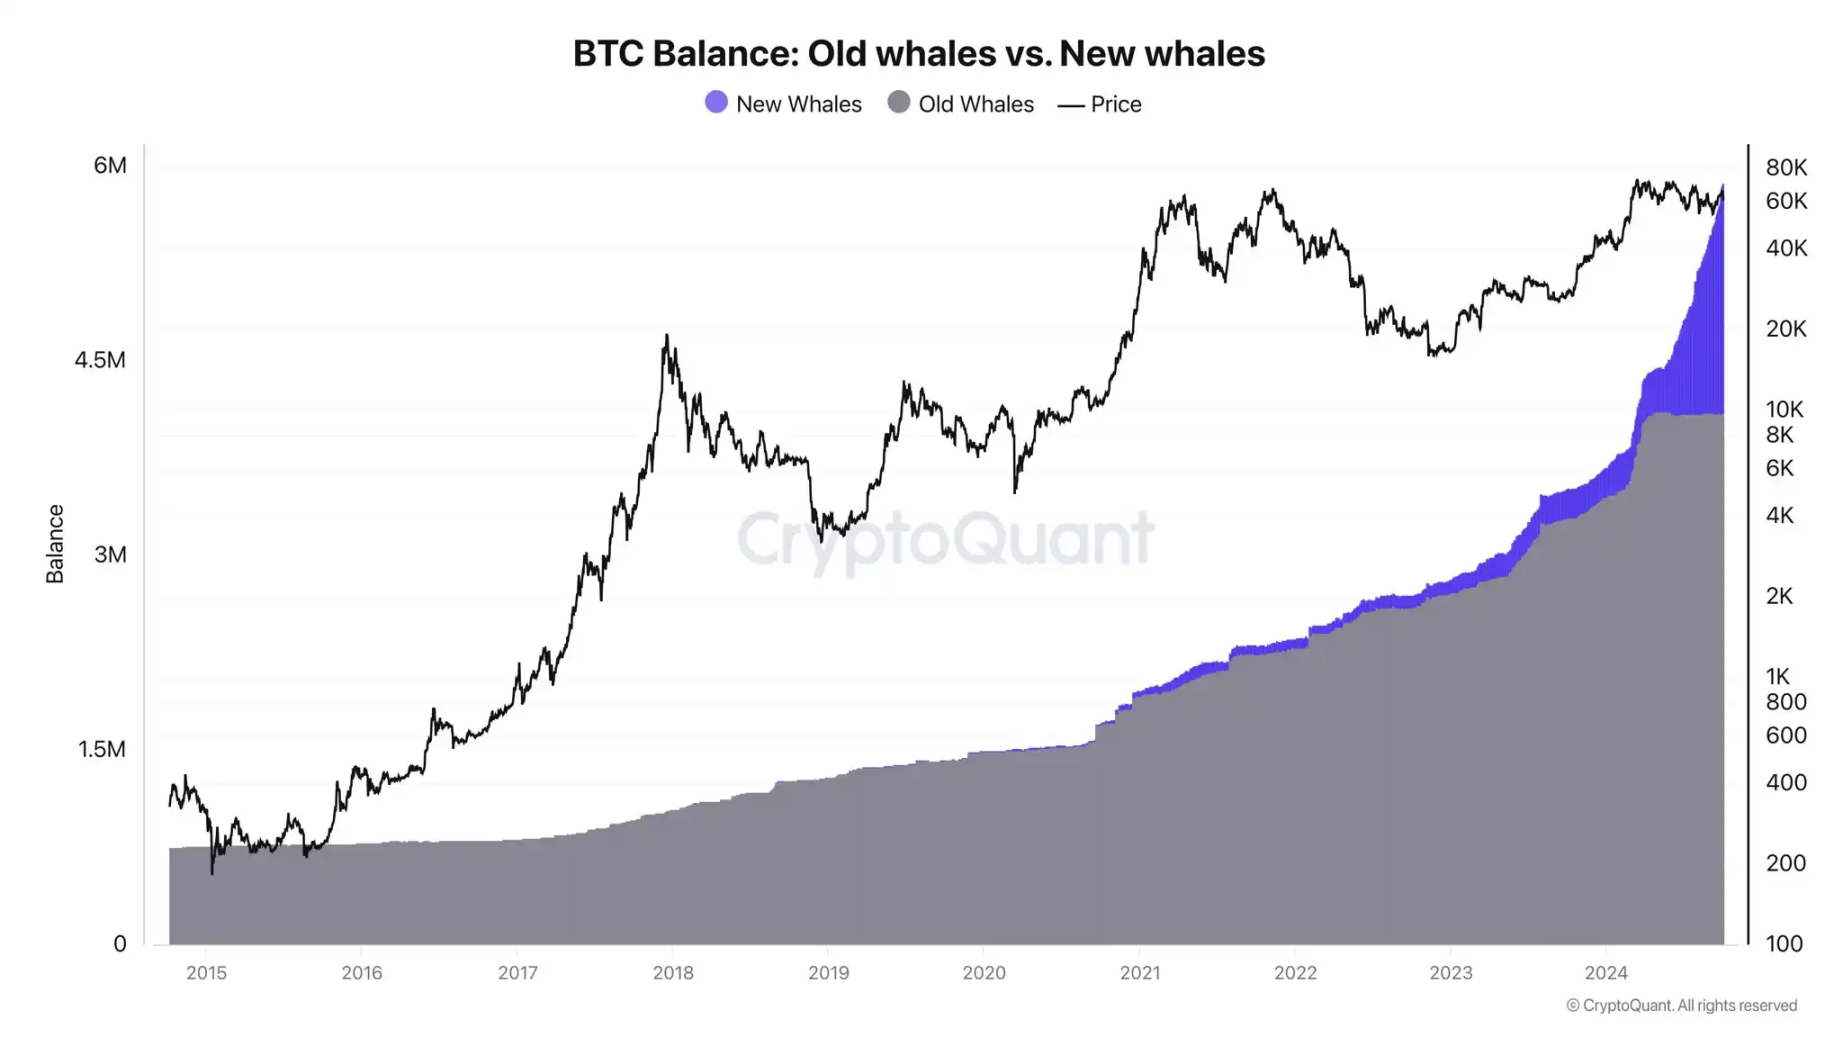
Long-term Holders Continue to Buy
The volume of long-term holders primarily shows the total supply of BTC held by long-term holders, specifically those addresses that have held BTC for over 155 days.
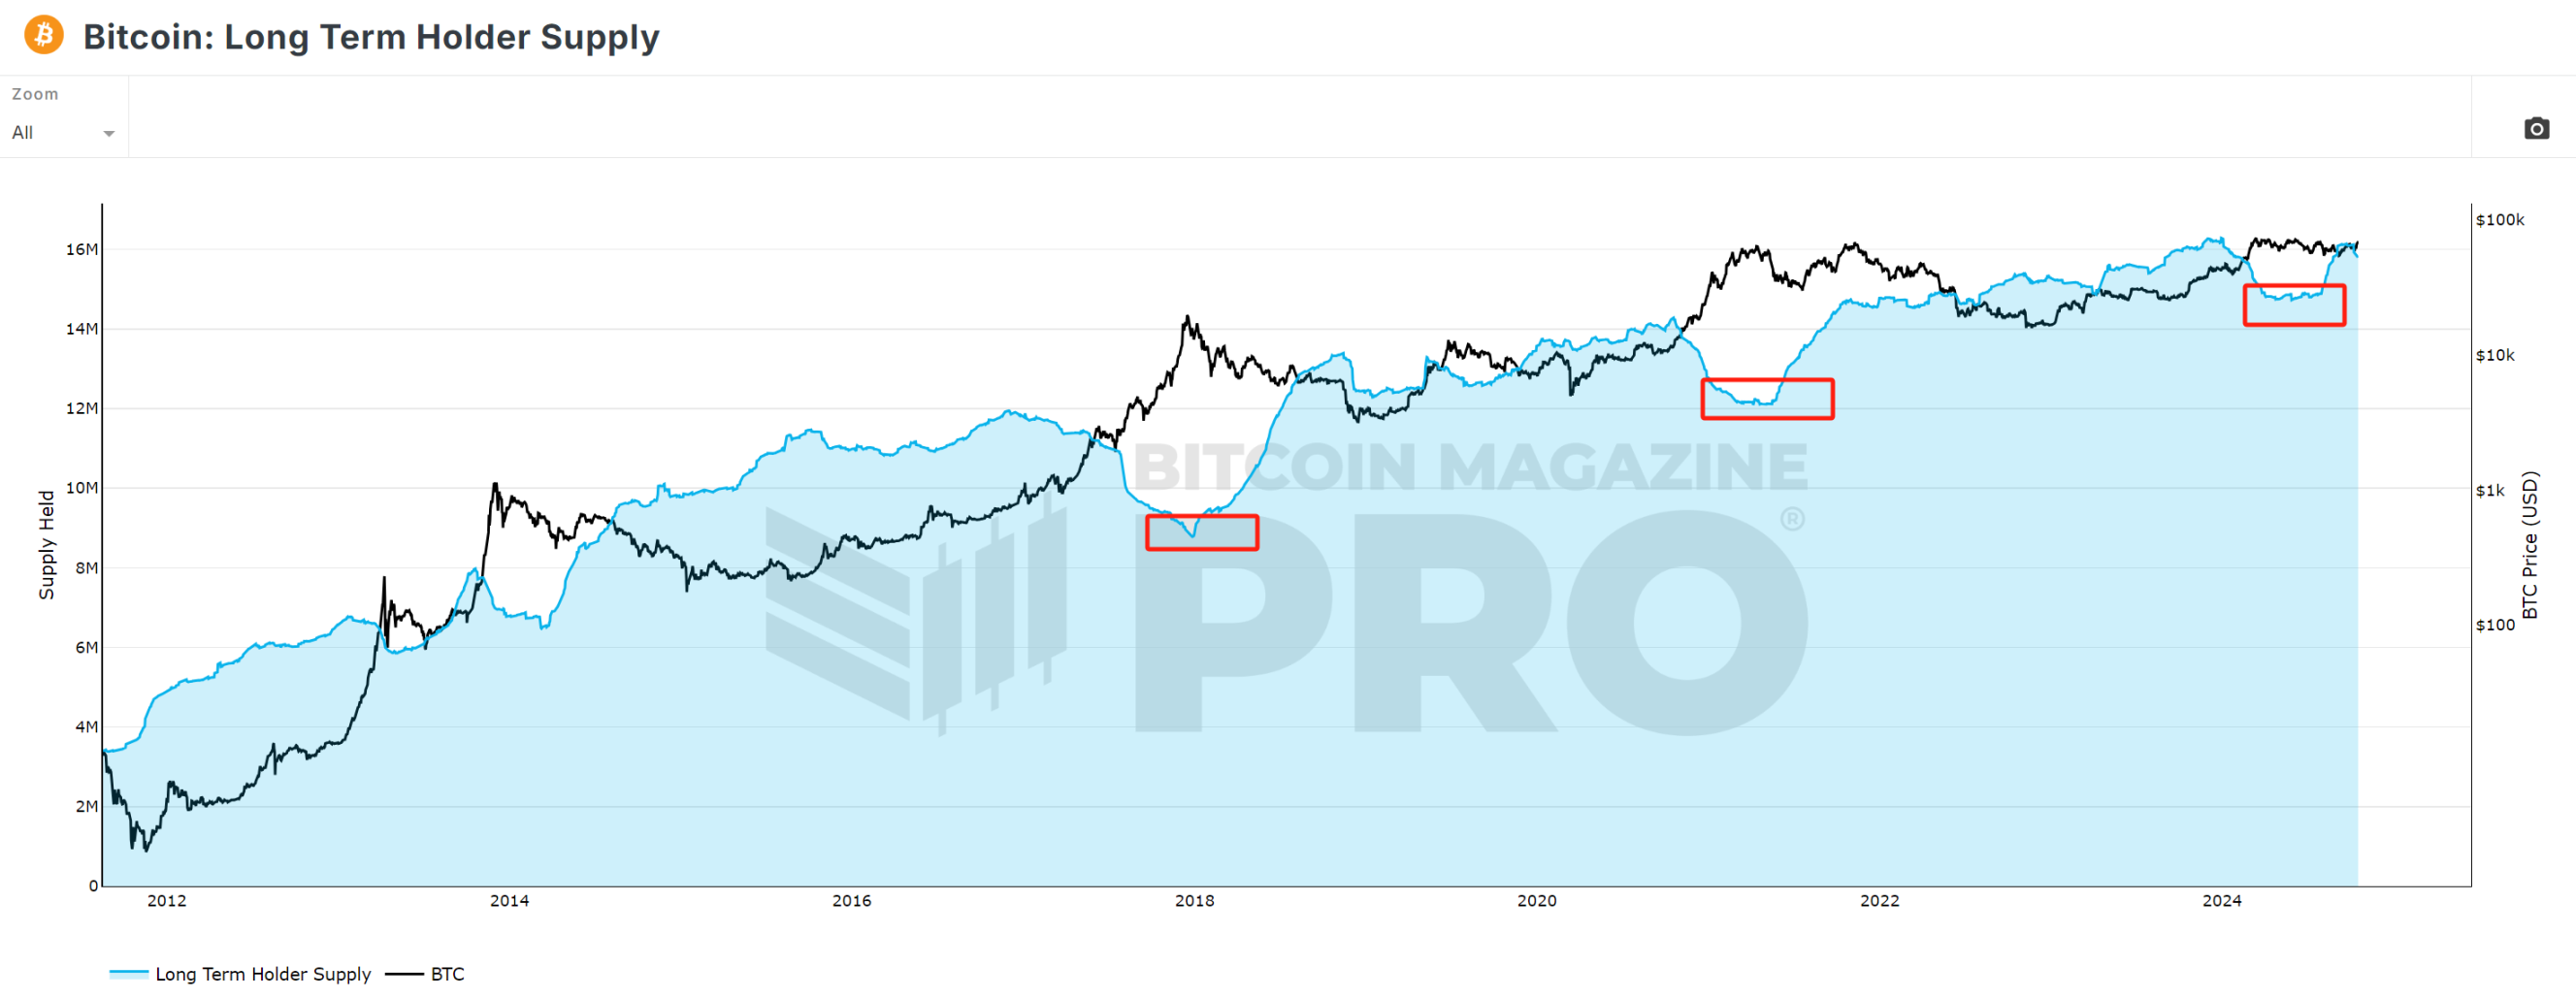
The chart shows that whenever BTC prices peak, the number of addresses held by long-term holders decreases. This is because smart money tends to take profits and exit at price peaks. After a decline, they accumulate BTC again until prices rise to a high point, at which point they sell again, and this cycle continues.
The chart indicates that since the end of July this year, long-term holders have resumed their buying spree, with the right-side line chart appearing quite steep. Clearly, these smart funds are optimistic about future market trends.
Notably, according to CryptoQuant data, new whale addresses are almost frantically accumulating BTC. Founder Ki Young Ju stated that the BTC market has never seen such accumulation behavior. Some believe that the new whales are primarily due to ETF inflows, but recent accumulation behavior suggests that these new whale addresses have little correlation with ETFs.
The Total Open Interest in Bitcoin Has Reached a Historical High
Today, according to Coinglass data, the total open interest in Bitcoin across the network has risen above $39.7 billion, setting a new historical high.
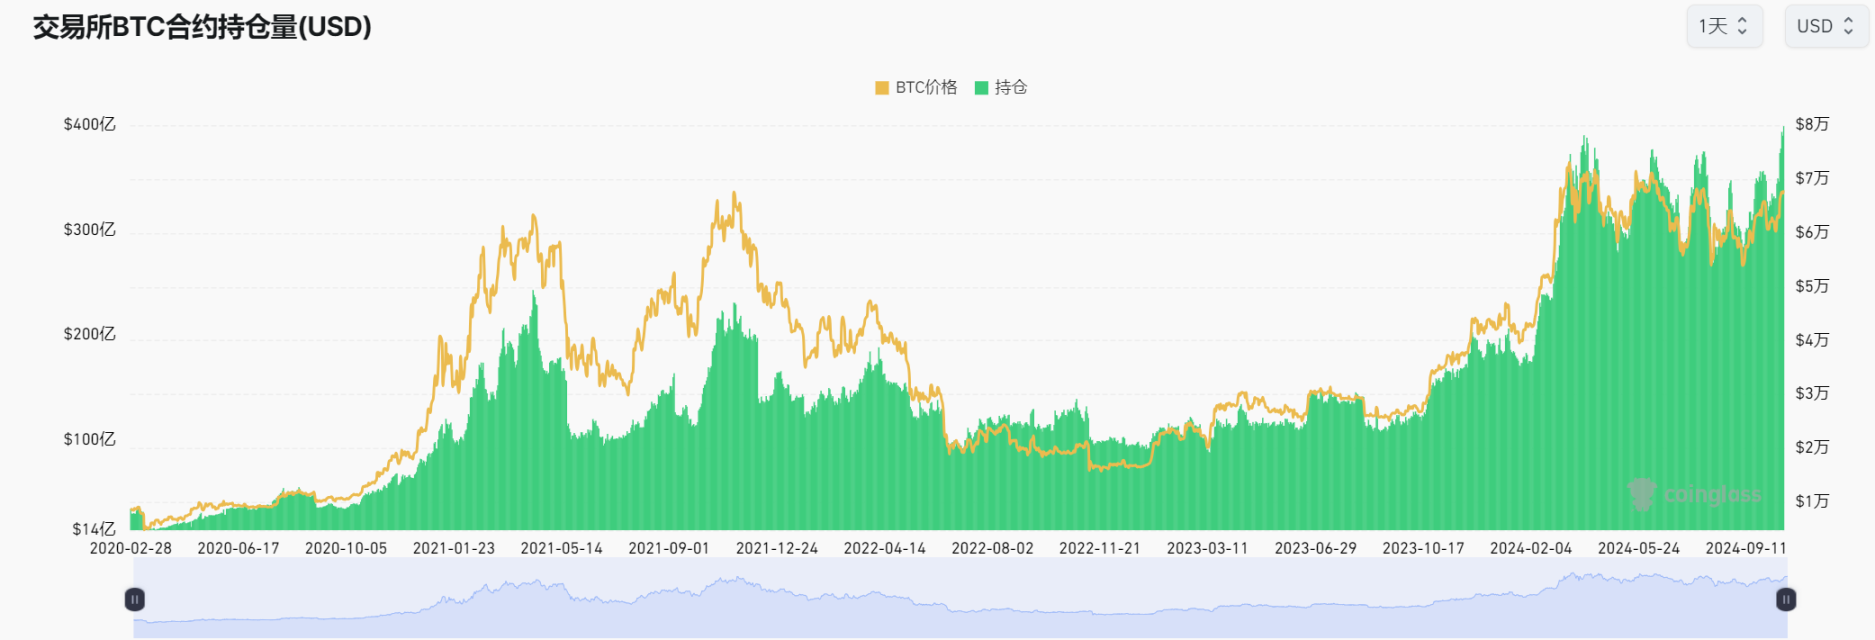
Contract data often represents the market's view on future price trends. It typically lags behind the performance of Bitcoin's spot price, which is why when the market becomes overly optimistic about short-term trends, it is also prone to corrections that clear out positions and leverage.
It is worth noting that over the past six months, the open interest in Bitcoin has remained at relatively high levels. This latest data marks a historical high, breaking the previous record of over $38 billion set earlier this year. Market optimism has clearly increased.
Conclusion
On a macro level, the Federal Reserve is set to cut interest rates in November and December, and some liquidity from around the world will continue to flow into risk assets, making liquidity in the crypto market more abundant. A series of on-chain indicators show that the market is gradually warming up, and funds are flowing in.
"Markets are born in despair, grow in skepticism, mature in hope, and die in expectation."
Perhaps, after nearly half a year of waiting, a new round of the crypto market bull run is about to take off.
免责声明:本文章仅代表作者个人观点,不代表本平台的立场和观点。本文章仅供信息分享,不构成对任何人的任何投资建议。用户与作者之间的任何争议,与本平台无关。如网页中刊载的文章或图片涉及侵权,请提供相关的权利证明和身份证明发送邮件到support@aicoin.com,本平台相关工作人员将会进行核查。


