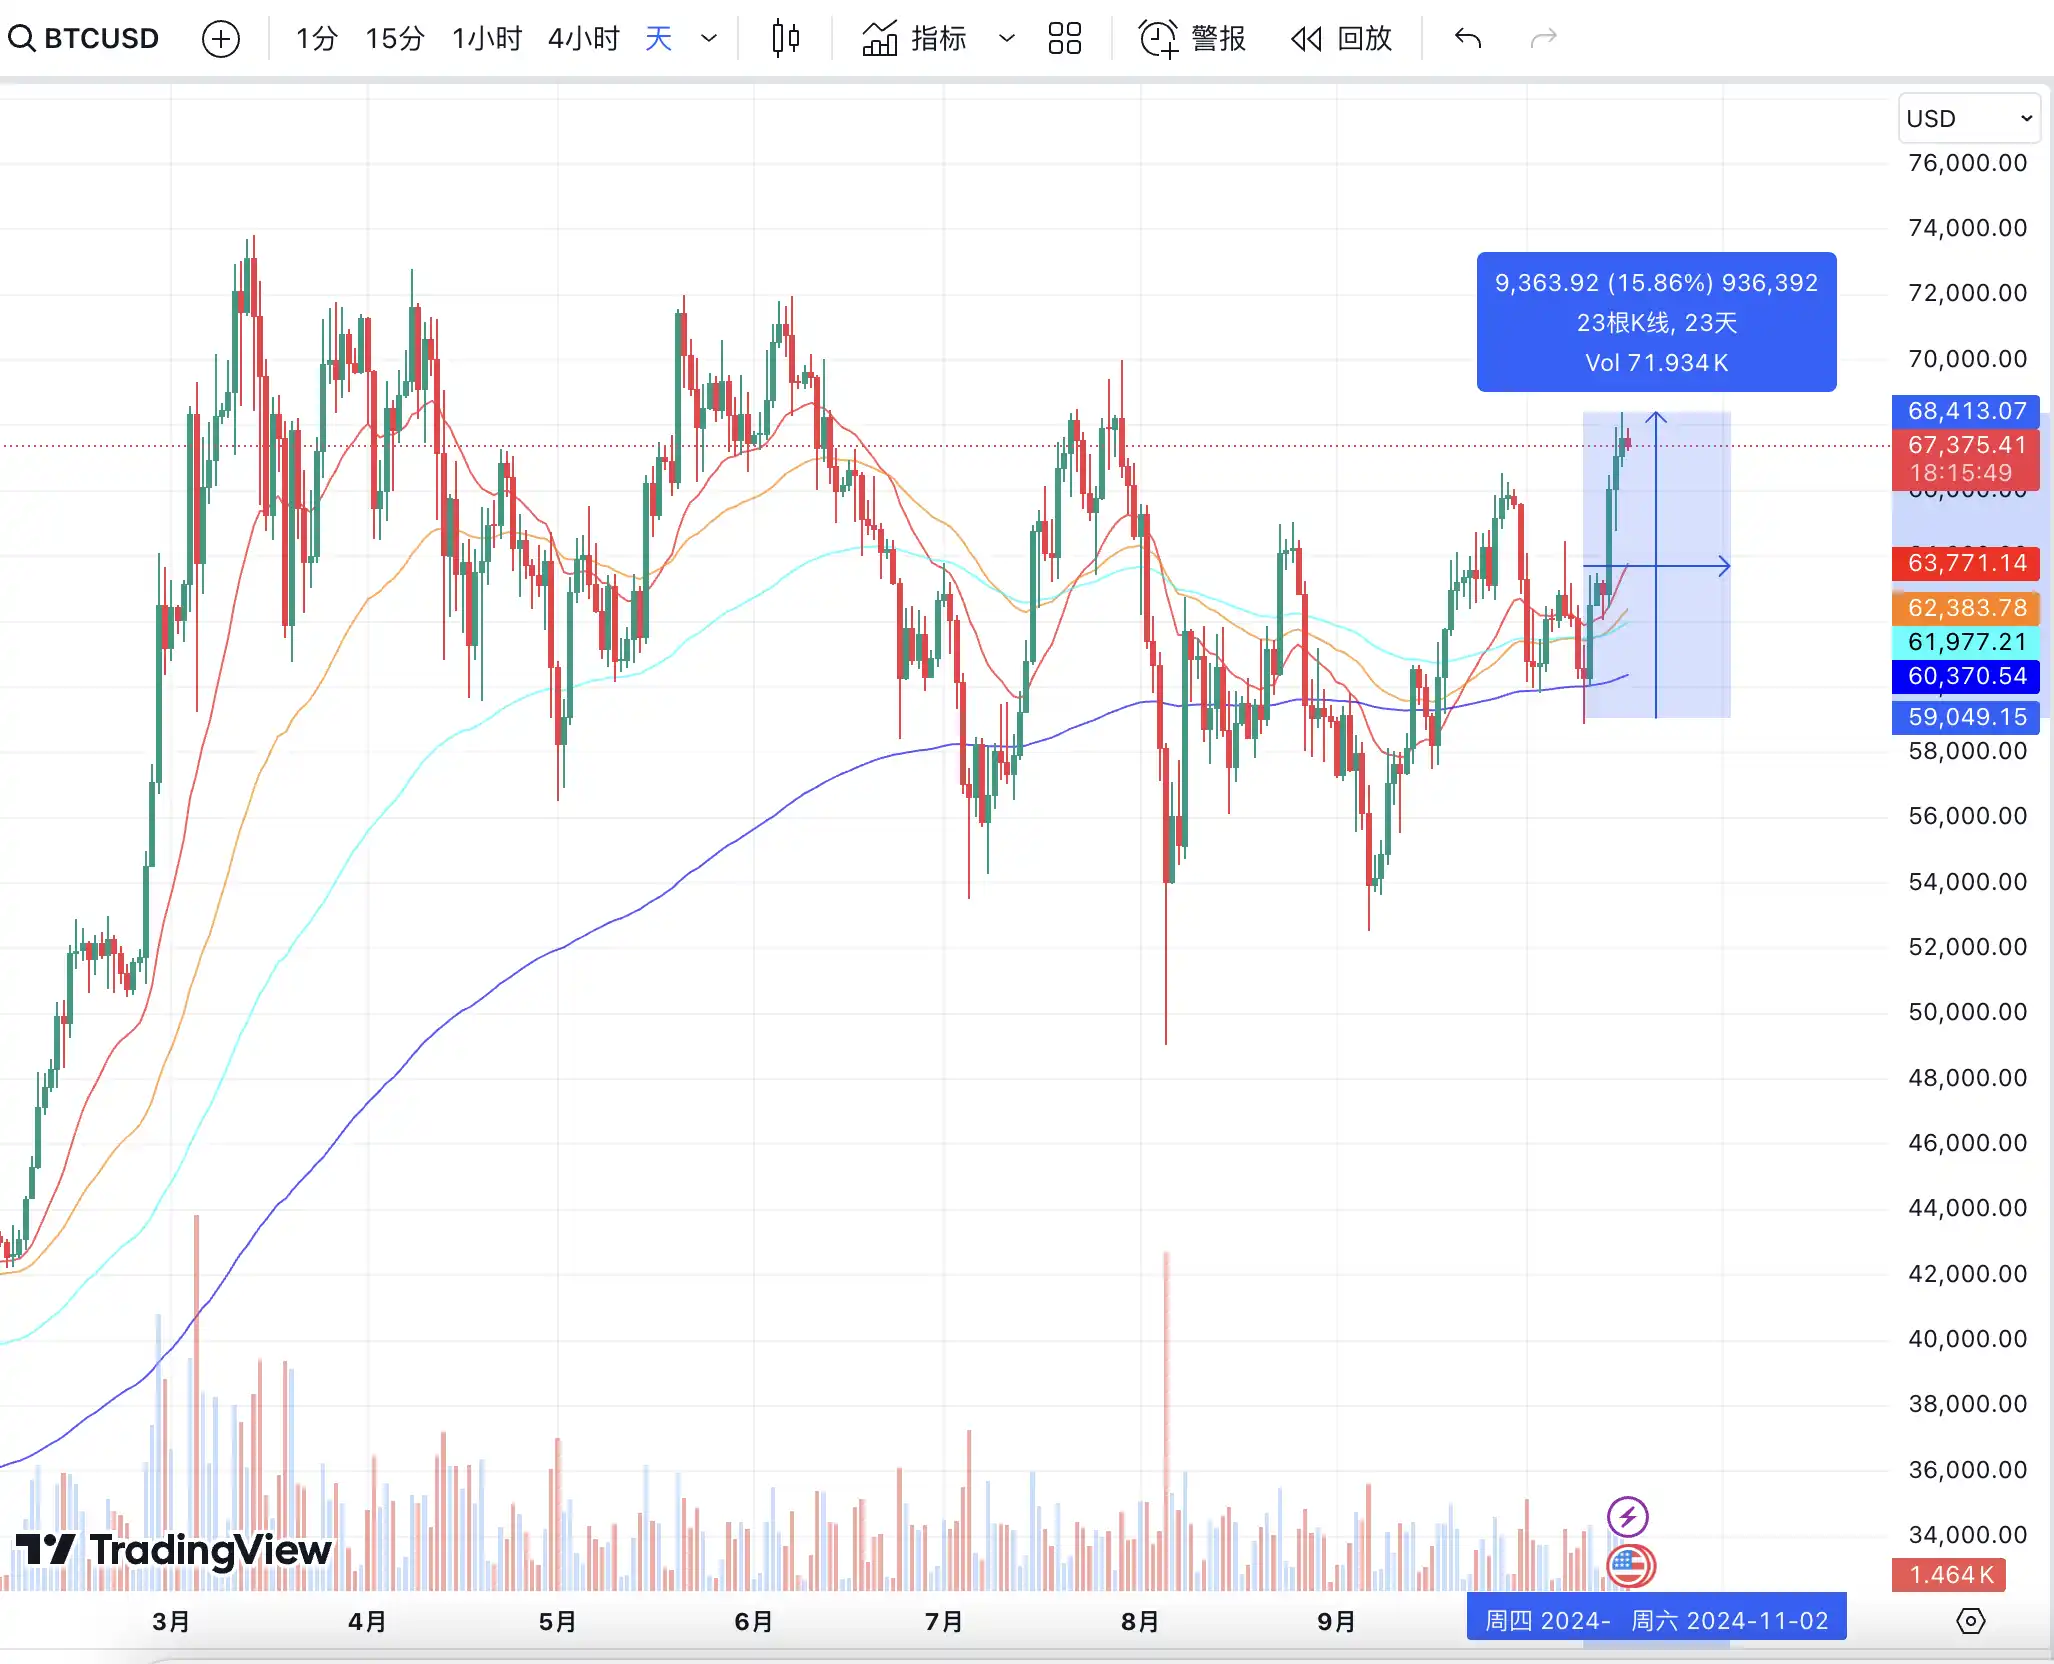
On October 10th during the US market, BTC broke down below the $60,000 mark, resulting in a single liquidation of a $10 million long position. It then began a one-sided upward trend, with the highest increase reaching 15.83%. The intensity of this one-sided rise was incredibly unexpected, with almost no pullback during the rapid ascent.
The macro environment seems to have shown no significant changes in recent days. Traders have not made significant adjustments to their pricing regarding whether the Federal Reserve will cut interest rates in November. The performance of US stocks and gold has also been relatively stable and rising. What factors have led to such a strong BTC trend? Is this an independent BTC market or is the liquidity from the Federal Reserve's interest rate cuts gradually spilling over into the cryptocurrency market?
How should we view this intensity of the rise? Is it a consensus that the bull market has returned, or is it a continuous inducement for long positions in a low-volume upward trend? Traders in the market all have their own opinions.

Technical Analysis Group
@CryptosLaowai
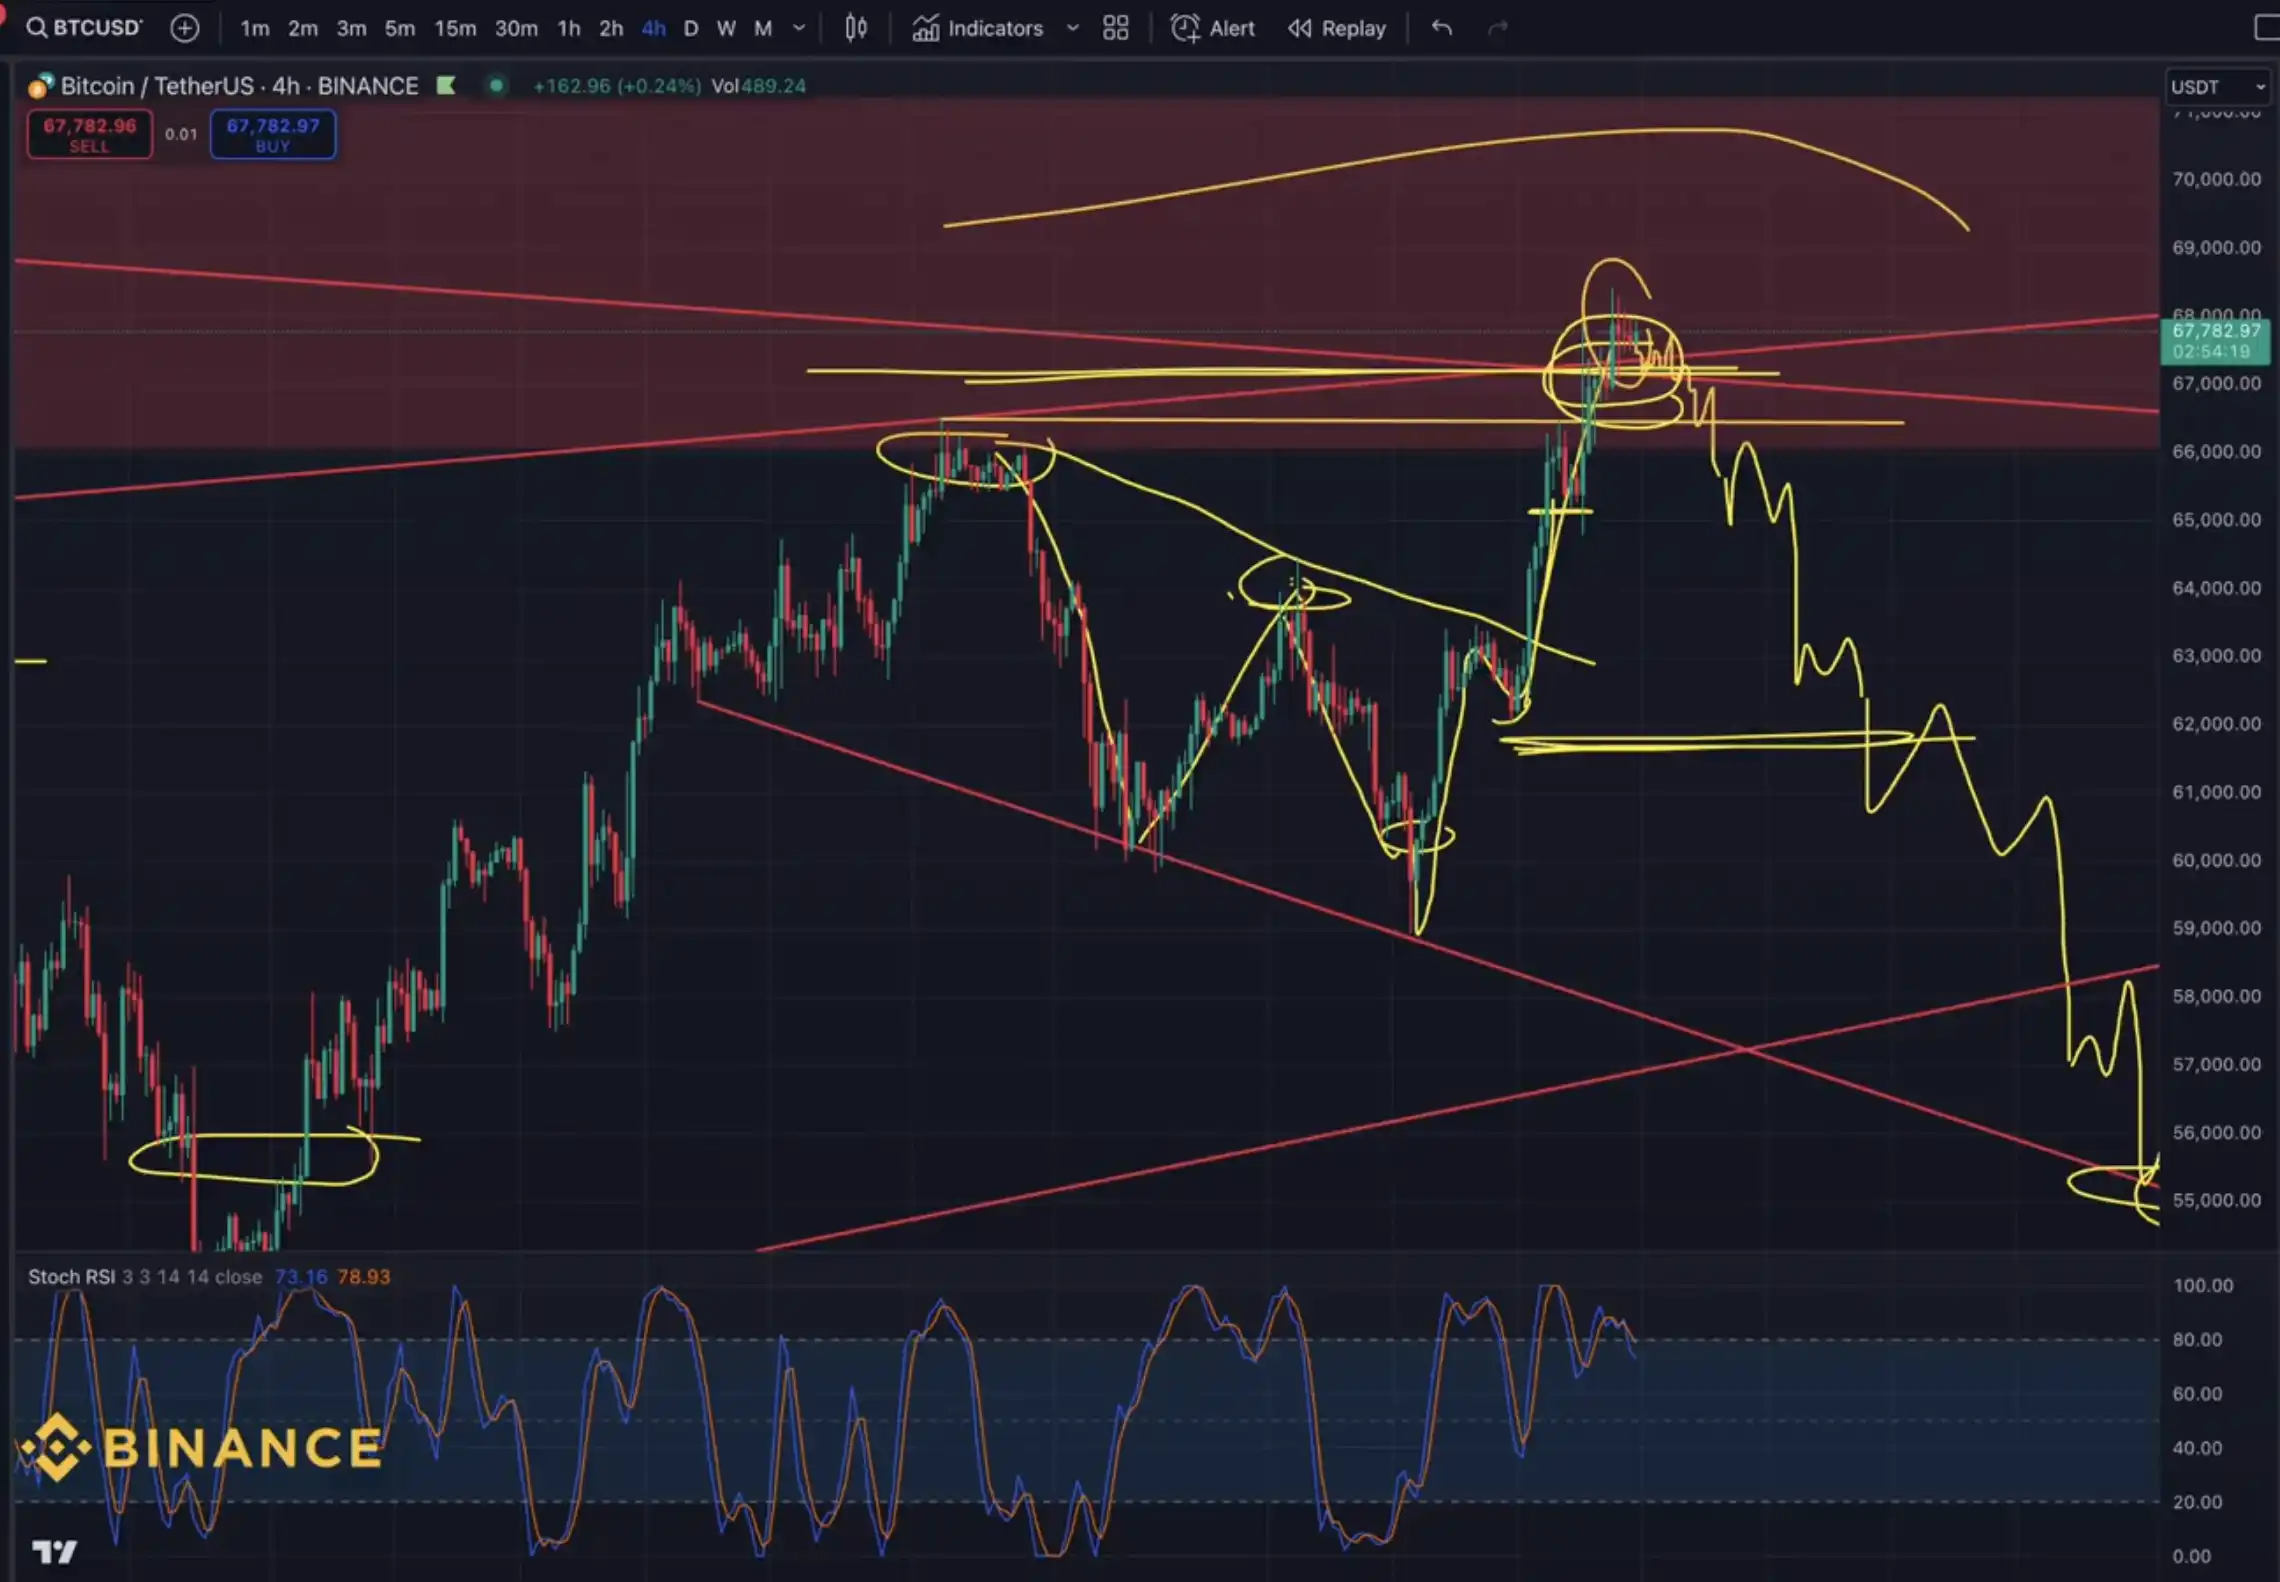
Believes that at this position, BTC has broken through the upper supply line and the intersection of a demand line for this cycle. From a pattern perspective, this round of upward movement resembles the trend at the end of August, where an upward flag formed and then a false breakout led to a downward break. From the liquidation heatmap, there isn't much short liquidity available for upward movement, but there is a significant amount of long liquidity available for downward movement. Currently, the average price of short positions is around $65,000, with a target for downward break set at around $55,000. It is not believed that there will be a new trend by the end of the year; a true bull market will need to wait until 2025.
@yekoikoi
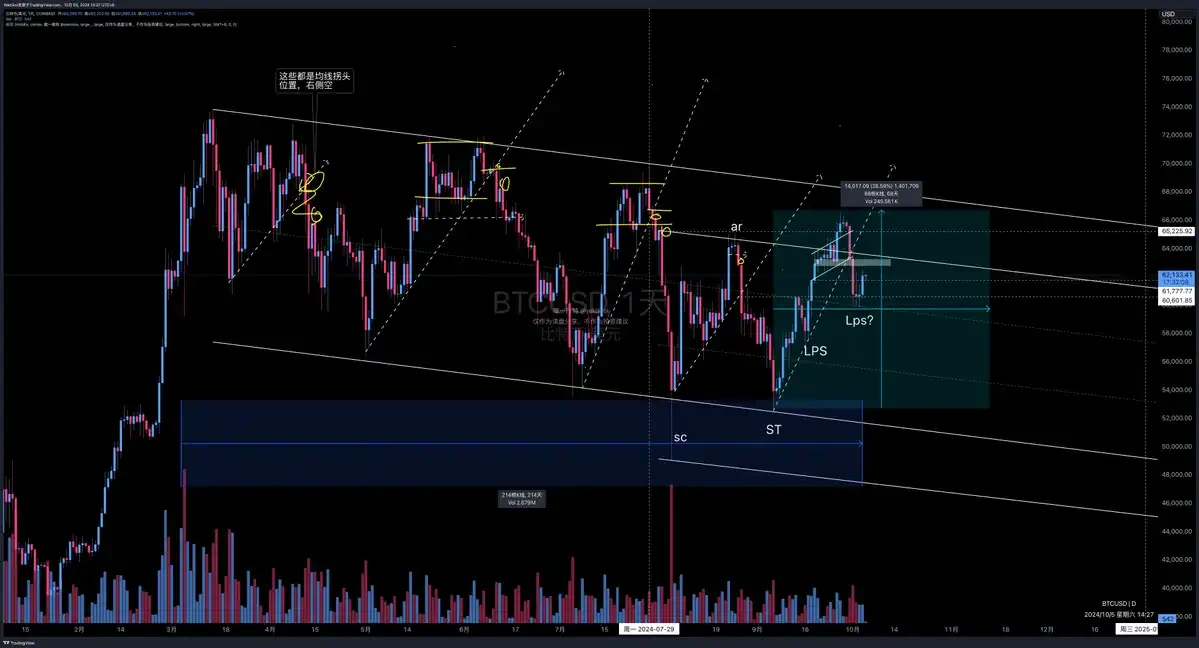
Believes that from the structure since July 29, BTC has performed well. After breaking through the demand line this time, it did not experience a smooth downward trend like before; instead, it found support in the $59,800 range. $59,800 is the 50% position of the rise from September 6 to now. From a pullback perspective, this is considered a good pullback, and the daily moving averages are slowly forming a bullish arrangement. The Wyckoff accumulation structure has emerged, indicating that there are main forces accumulating. Looking at it from a perspective of "carving a boat to seek a sword," the drop from $65,000 to $60,000 may be the last demand point (LPS). Demand has consistently exceeded supply, meaning buying is greater than selling. Currently, confirmation of the breakout is still needed, and long positions at the bottom should be firmly held without new operations.
@Patrade_Buer
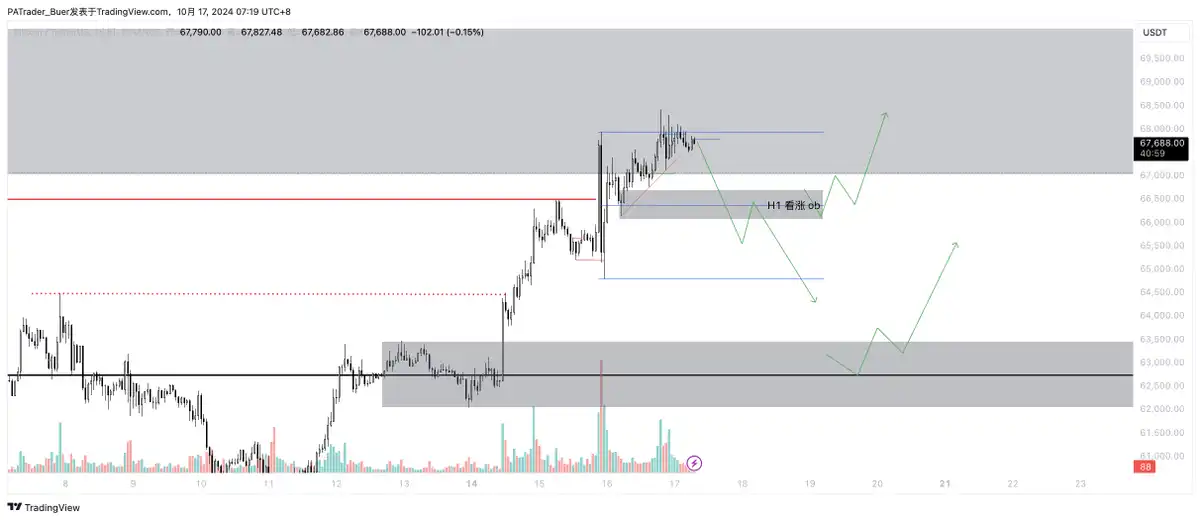
Daily level: The upward trend has already emerged. The $59,000 position mentioned in the October monthly report is the last entry point. Still, continue to pay attention to the bearish OB test, whether it will directly break through to hit range-H or reject and pull back. The pullback focus remains on $64,500 and $63,000; these are buying positions. The key spot for spot orders remains at $63,000.
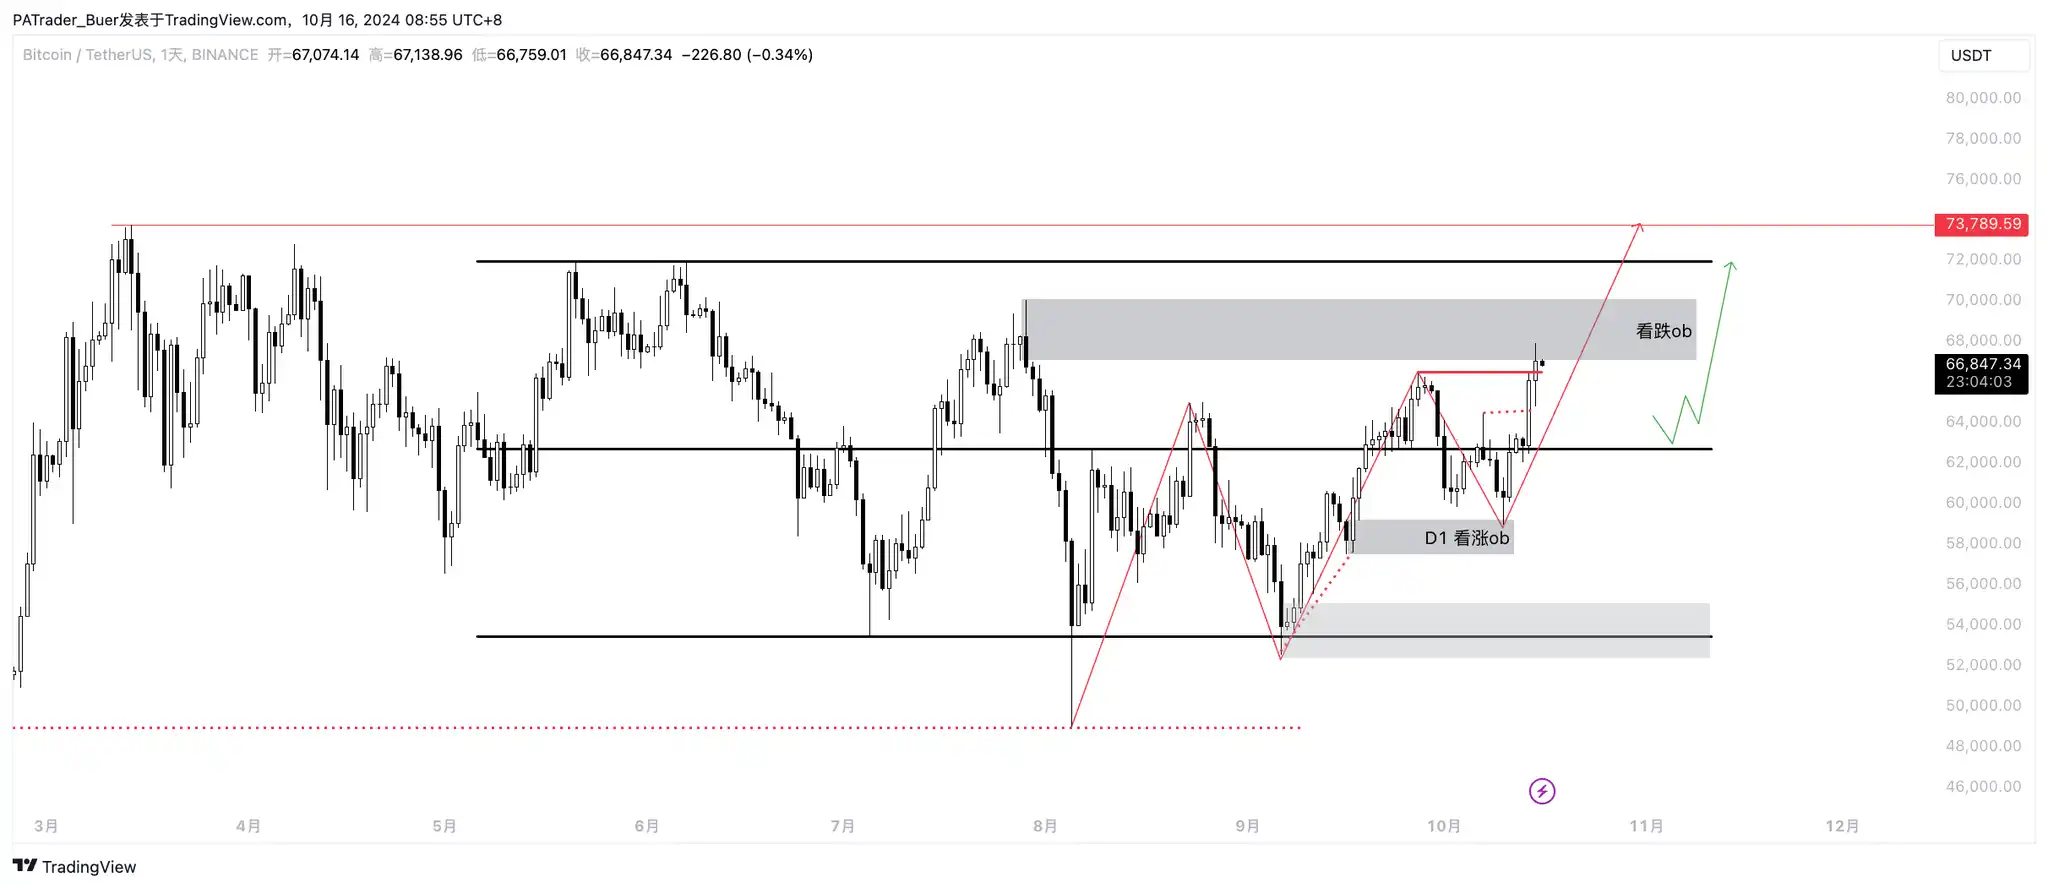
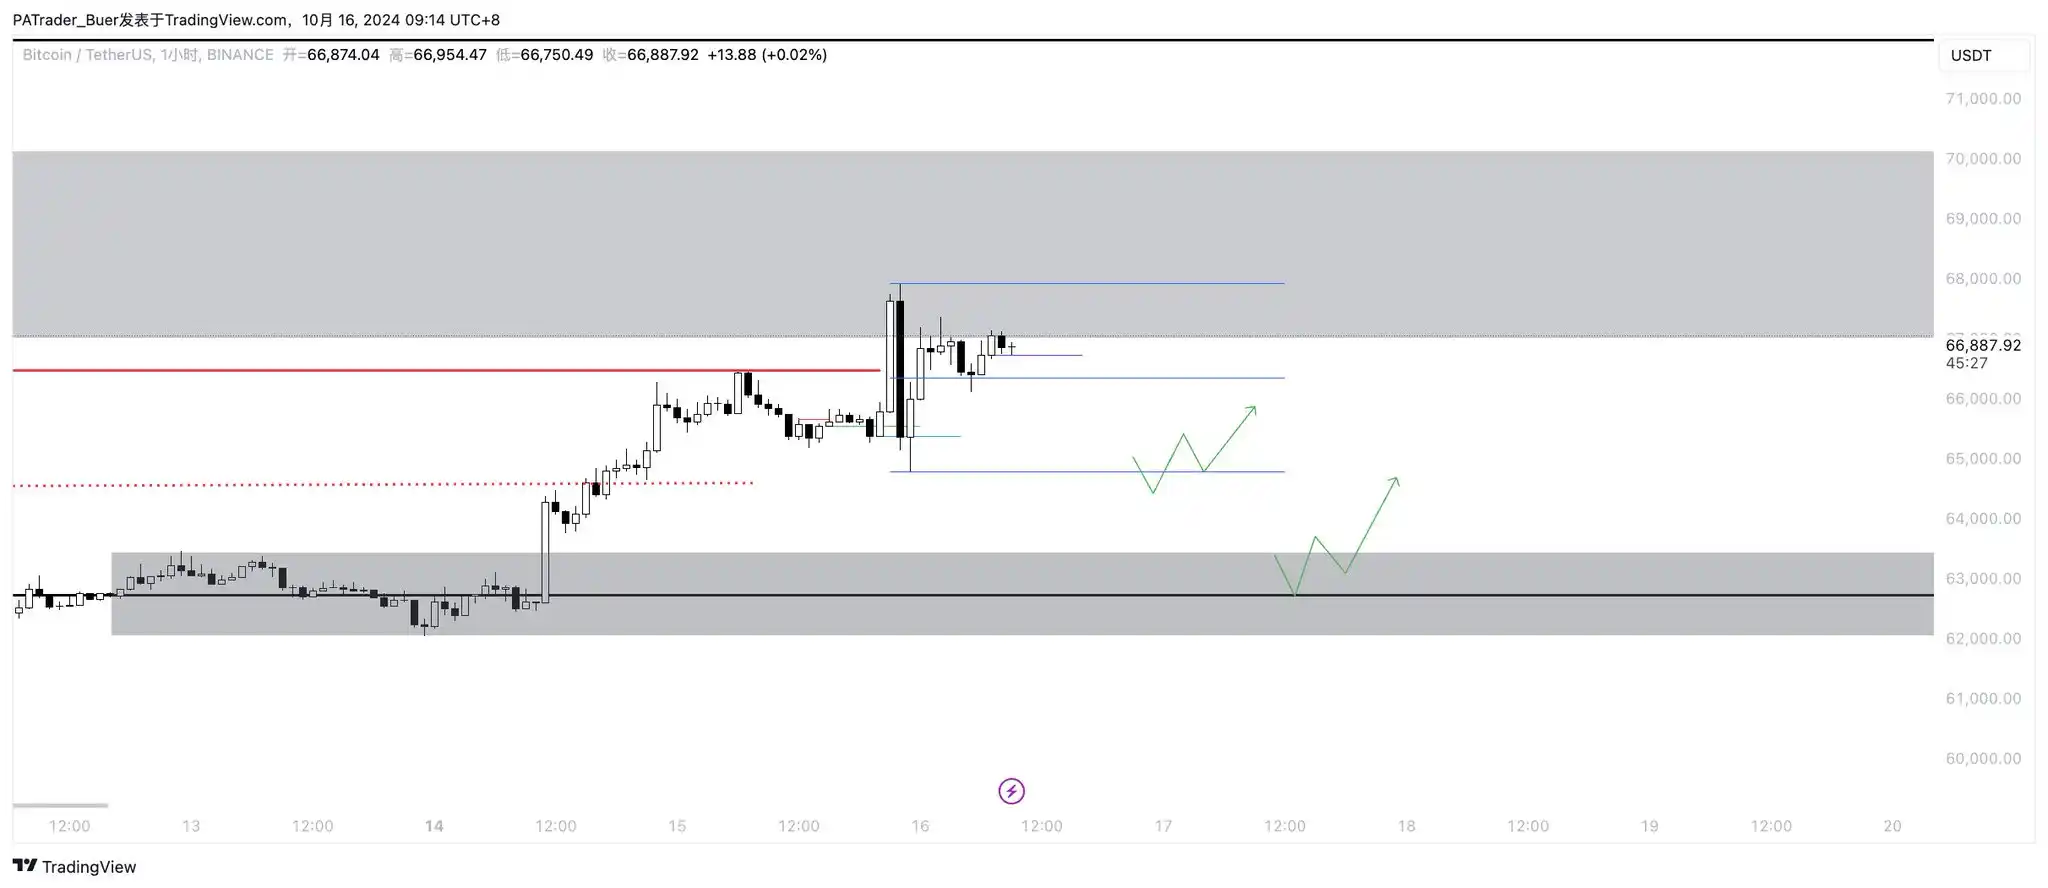
Hourly level: After making up and down pin bars on October 15, it again made a raid upward. If one wants to short, it is safer to pay attention to the bullish OB test on H1. Here, if the entity breaks down, a pullback would be the opportunity to short. The trend remains upward; first, look for buying opportunities after testing the bullish OB on H1 following the raid. If it breaks below the bullish OB on H1, we can expect a pullback as we consistently anticipate, focusing on raiding $64,500 (short-term) for buying opportunities after the blue range-L and paying close attention to the bullish OB around $63,000 on H4 for buying opportunities.
@siyizhisheng3
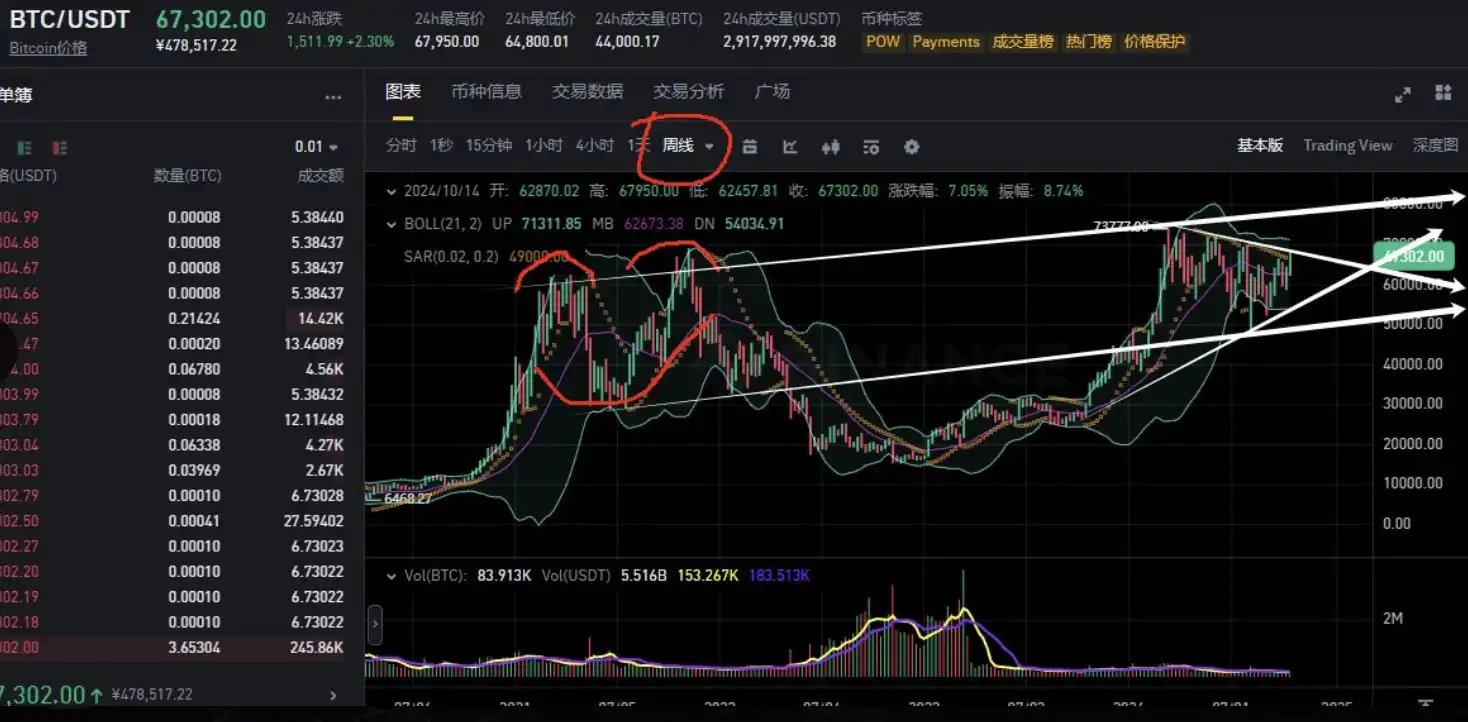
Currently, the structure has been oscillating upward since the bottom of 5B, with capital accumulating! The current price of $67,000 has broken through the daily high point of $66,500, entering the secondary channel trajectory as shown in the first image below: the red channel represents oscillating downward consolidation, while the white channel represents the secondary channel trajectory just emerging from the red consolidation channel! In the short term, the prevailing view is bullish, but from the secondary channel perspective, it is currently at the B turning point, which is the first wave of a new three-wave structure breaking away from the previous consolidation range, with the second wave rising. Currently, it is at the B turning point of the secondary channel.
From the trading structure, the B turning point will oscillate upward about 80% of the time, similar to a slope greater than acceleration! From the trading structure, I personally feel that Bitcoin needs to oscillate widely at the B turning point before narrowing down and then accelerating through the B turning point!
From the daily extension to the weekly level, the weekly chart is still in the pressure turning point area of the consolidation channel and has not broken through, as shown in the third image: on the weekly chart, BTC is still under pressure in the triangular area, and there are only two possible movements in the triangular pressure area.
Break through the pressure triangle and consolidate on the second weekly candle.
Oscillate and consolidate below the pressure line, with the second candle building momentum.
Regardless of which line it follows, the overall trend, in summary, indicates that the short-term trend is forming a preliminary thought on the small right side! The upward movement is greater than the downward movement. Be cautious about shorting; the weekly pressure and daily B turning point position suggest that the focus is on building momentum!
Currently, the major support has risen to around $64,700, and the weekly value has risen to $63,000.
The daily pressure zone is at $68,600, and the weekly resistance line is around $71,600.
Macro Analysis Group:
@Crypto_Painter
Believes that this round of upward movement may be related to MSTR's excessive premium and its decoupling from BTC. MSTR started two weeks ago, with market rumors that MSTR would be included in the QQQ index, completely decoupling from BTC and entering a sustained bullish trend.
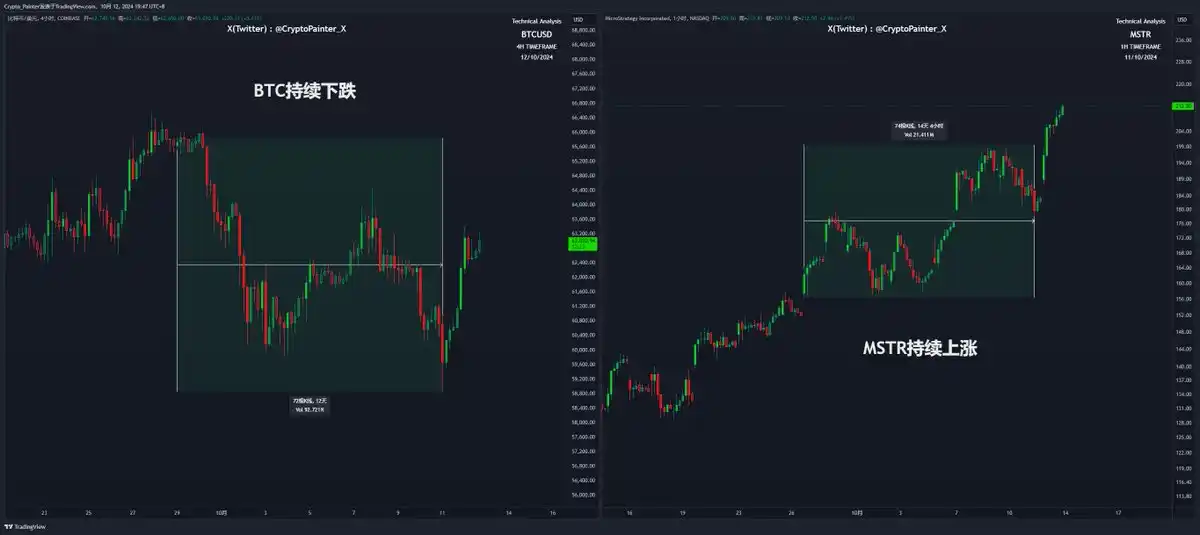
Hedge funds shorting MSTR while going long on BTC have narrowed the premium difference between BTC and MSTR, potentially bringing hedge funds a return of 20%-30%.
In the current market situation, BTC is rapidly rising, approaching new highs, while MSTR is oscillating near its new high position. For hedge funds, such arbitrage is nearing its end, so the short-term bullish trend of BTC may stagnate.
@Maoshu_CN
Believes that the driving force behind this round of upward movement is that US tech stocks are approaching their third-quarter earnings reports. Investors are buying more calmly than before, and with a favorable investment environment, the economic situation is optimistic, and risk appetite is increasing.
The flow of capital sectors has attracted some of the spilled liquidity back into the cryptocurrency market, with large caps moving into small caps and large caps moving into BTC. This is enough to prove that the current market liquidity is still tight, and the liquidity spilling from tech stock profits will gradually flow into small-cap stocks and BTC. Personally, I do not feel that it is related to Trump's increased chances of winning; those who trust Trump will always believe he can win, while those who do not trust him will feel the same even if his approval rating is high now.
However, after the four major US stock indices closed higher today, BTC did not gain more bullish momentum. According to previous logic, the liquidity that was originally spilling from US stocks has reached a bottleneck. Unless US stock earnings improve again and spill more liquidity, or there is external stimulus, BTC will not see another breakthrough. Tonight's initial jobless claims and September retail data may become catalysts.
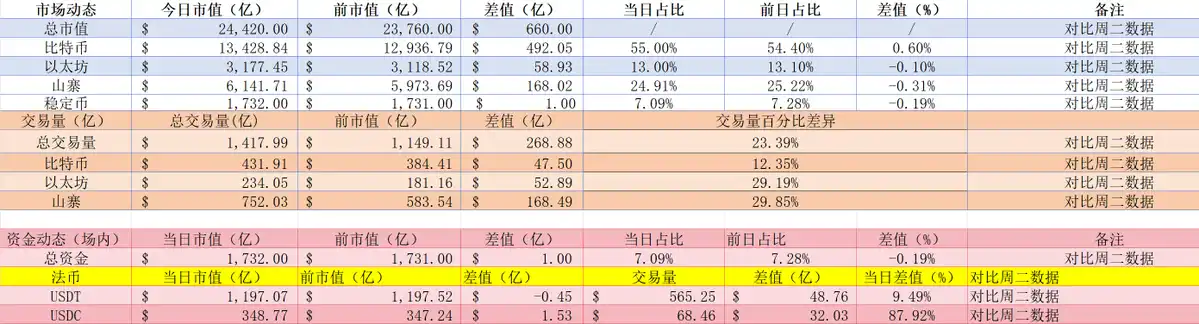
In terms of capital, the market's stablecoin market cap has increased by $100 million, currently at $173.2 billion: USDT: official data shows $119.766 billion, unchanged from yesterday. Asian and European capital has temporarily stopped flowing in, but the existing stock is still sufficient. Trading volume continues to increase, and Asian and European capital activity is good; USDC: data shows a market cap increase of $153 million, with trading volume increasing by 87.92%, clearly indicating that US capital is starting to flow back and actively participating in trading, restoring the previous active state in the US market.
@Phyrex_Ni
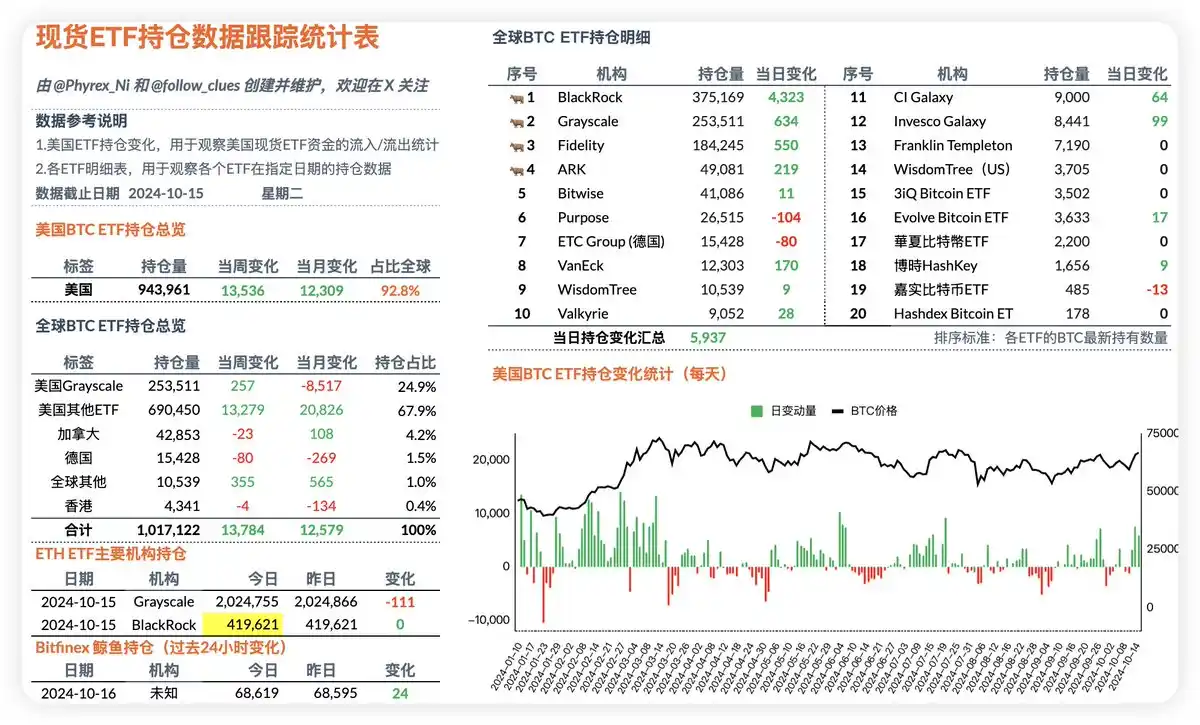
Believes that the short-term rise of BTC is strongly correlated with the purchasing power of BTC ETFs. On October 15, there was a direct net inflow of 4,323 BTC, which brought in nearly $300 million. This recent rise in BTC can be linked to BlackRock's earnings report, which has significantly boosted the purchasing power for #BTC and provided substantial support for its price.
Moreover, most institutions in the U.S. are maintaining a positive inflow status, with only three institutions remaining at zero; the other nine are experiencing positive inflows with no outflows. Even Grayscale's two ETFs have accumulated 635 BTC. Therefore, the stimulus from BlackRock is not only affecting itself; the massive funds entering BlackRock have also shown other ETF institutions a promising outlook.
Although the purchasing power from others is not very large, it is evident that users' FOMO (Fear of Missing Out) sentiment is starting to increase, which could indicate the beginning of Q4. After all, we have mentioned countless times that there are many positive factors in Q4, making it highly anticipated. Yesterday, the BTC spot ETF saw an inflow of 6,035 BTC, with more funds flowing towards BTC.
Data Analysis Group:
@CryptoPainter_X
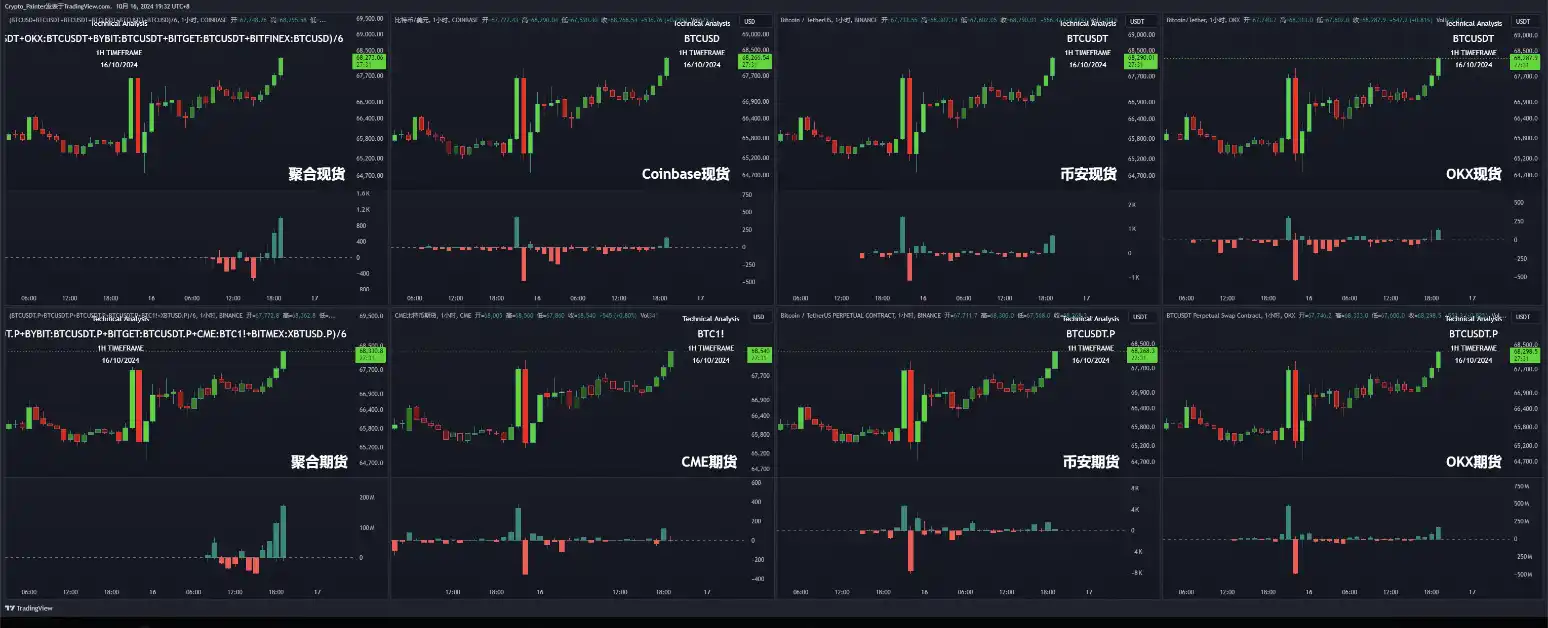
Noticed that the negative premium status of Coinbase BTCUSD spot against USDT has persisted for 16 days. It can be confirmed that: first, USDT has been in a negative premium state during these 16 days, indicating that some funds have flowed out of the stablecoin market; second, the Coinbase spot market has consistently been offloading during this period. Meanwhile, the buying pressure in the futures market has remained strong, driving the price. It is necessary to confirm whether there is follow-up buying in the spot market; a futures-led bullish trend is rapid, and it is entirely possible to quickly break through $69,000 or $70,000. However, if there is no follow-up buying in the spot market, a significant downward shadow line targeting long liquidity will eventually appear.
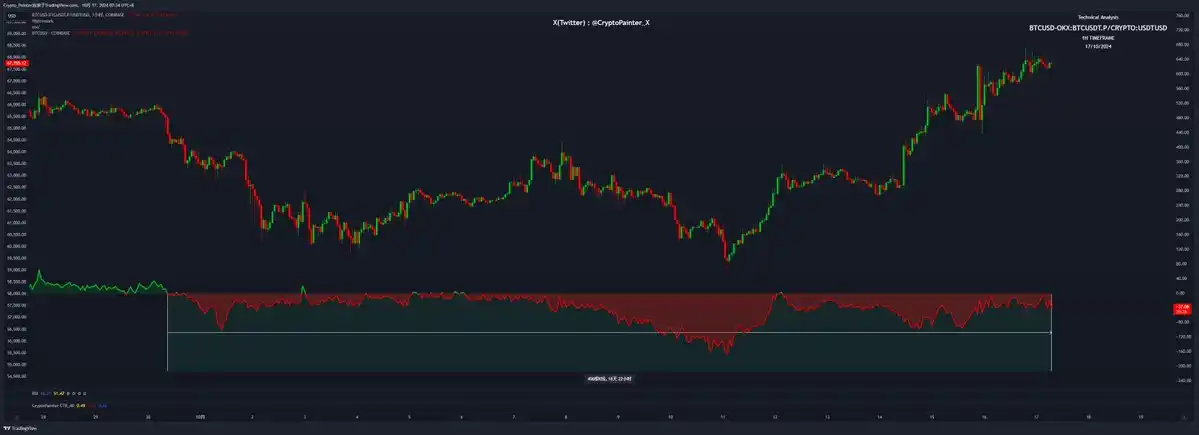
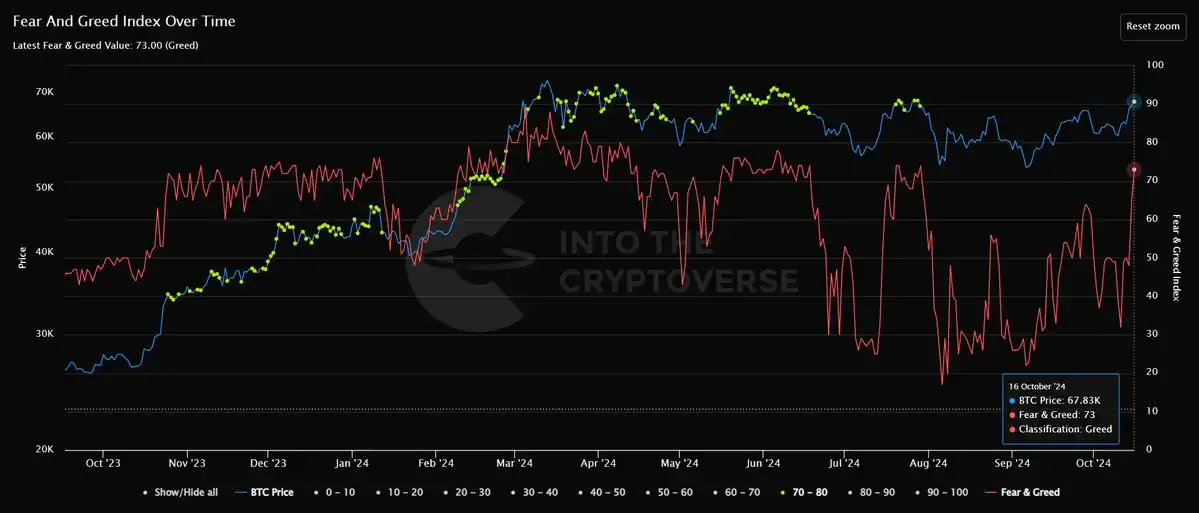
From the Fear and Greed Index perspective, the index has surpassed 70 for the first time since July 29, entering a "Greed" state.
The red curve in the chart shows the trend of the Fear and Greed Index over the past year. If we consider it similar to an RSI indicator, then each time the closing price hits a new low while the index does not, it can be seen as a divergence, which seems to be a method for judging tops and bottoms.
Previously, when the price closed at $52,000, the index did not, indicating a bottom; similarly, if the current price cannot break through $70,000 for a long time while the index reaches a new high, it may also signal some kind of top.
@Xbt886
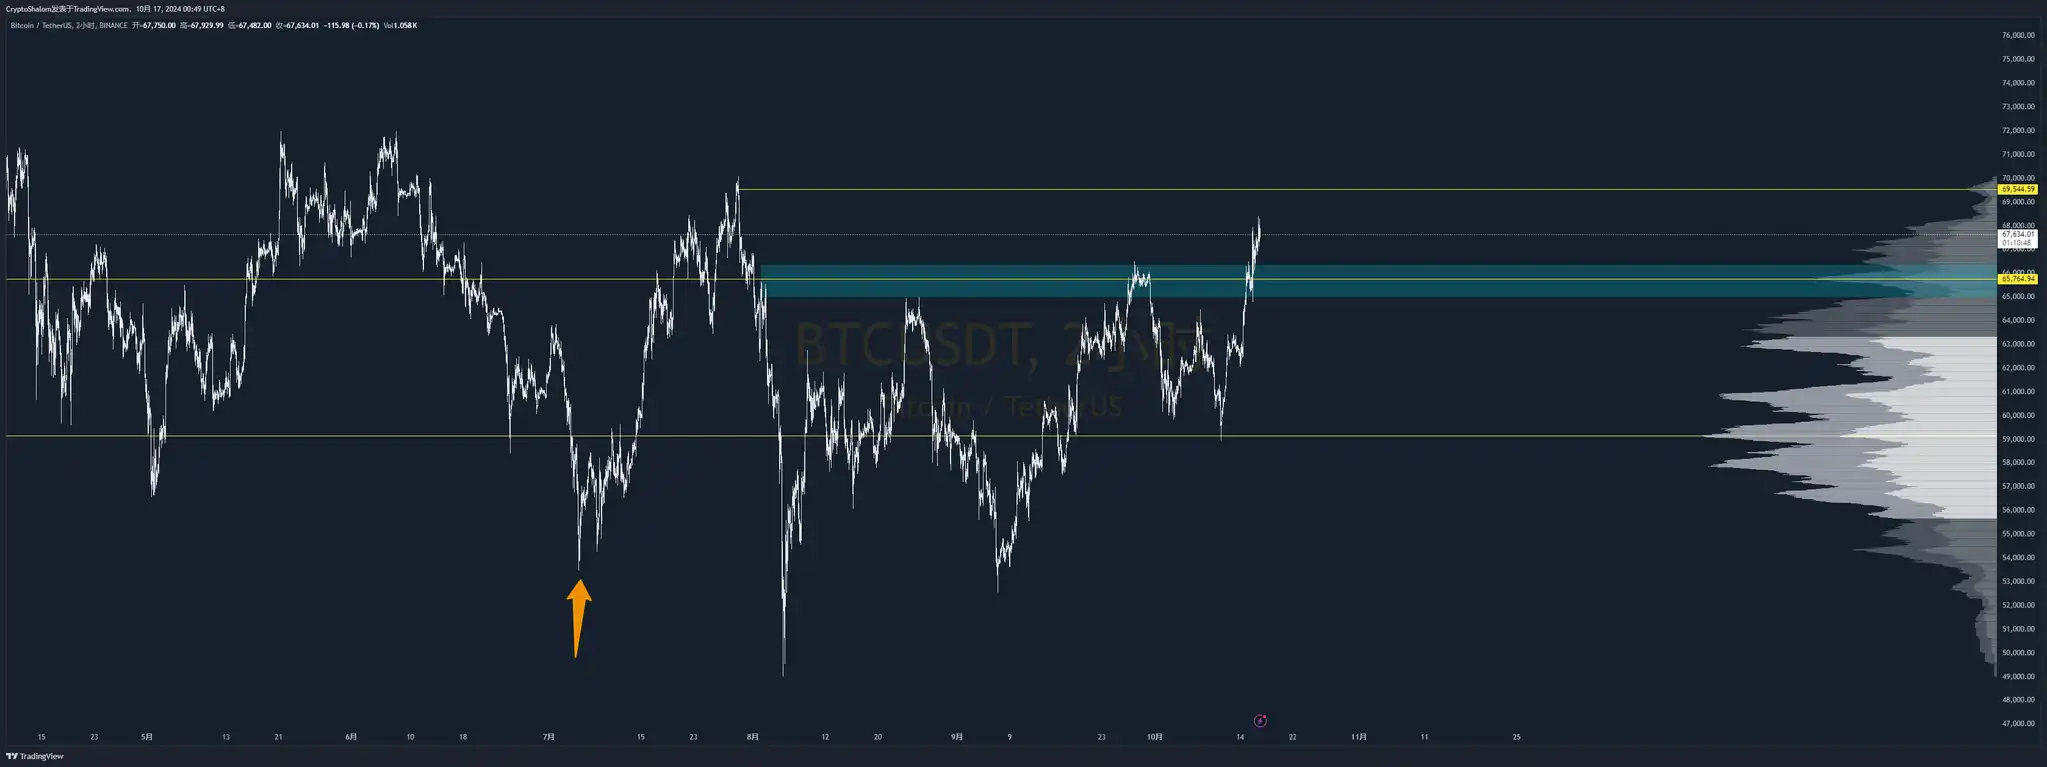
Noticed that the comparative range has broken through, so I will push the VP anchor point to the low point from the 7th to the 5th.
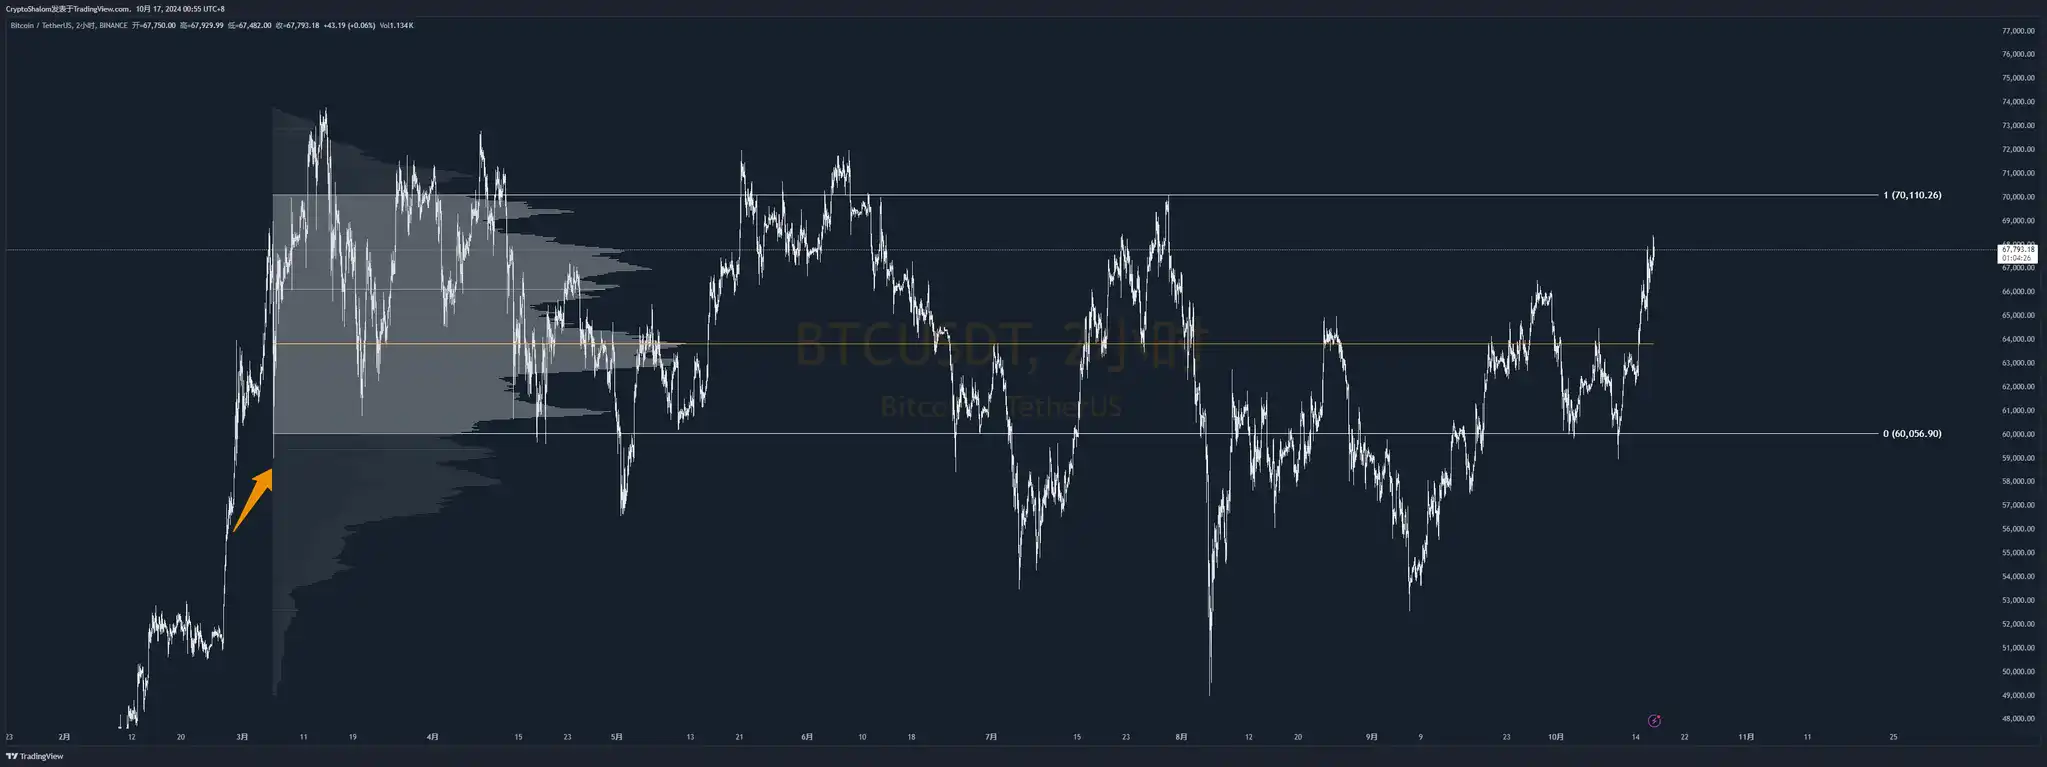
Combining with the VP from March 6 to now.
Believes that:
$65,754 is the current support; losing this level would end the current upward trend.
The upper resistance is at $69,544, a potential target; note the word "potential."
This area is not worth trading; wait for a breakout or a breakdown.
Based on the entire half-year VP, VAH is at $70,110.
@biupa
Noticed the current market situation:
TWAP buying - Binance, OK - Chinese capital
TWAP selling - Coinbase, Kraken, Bybit - Western capital
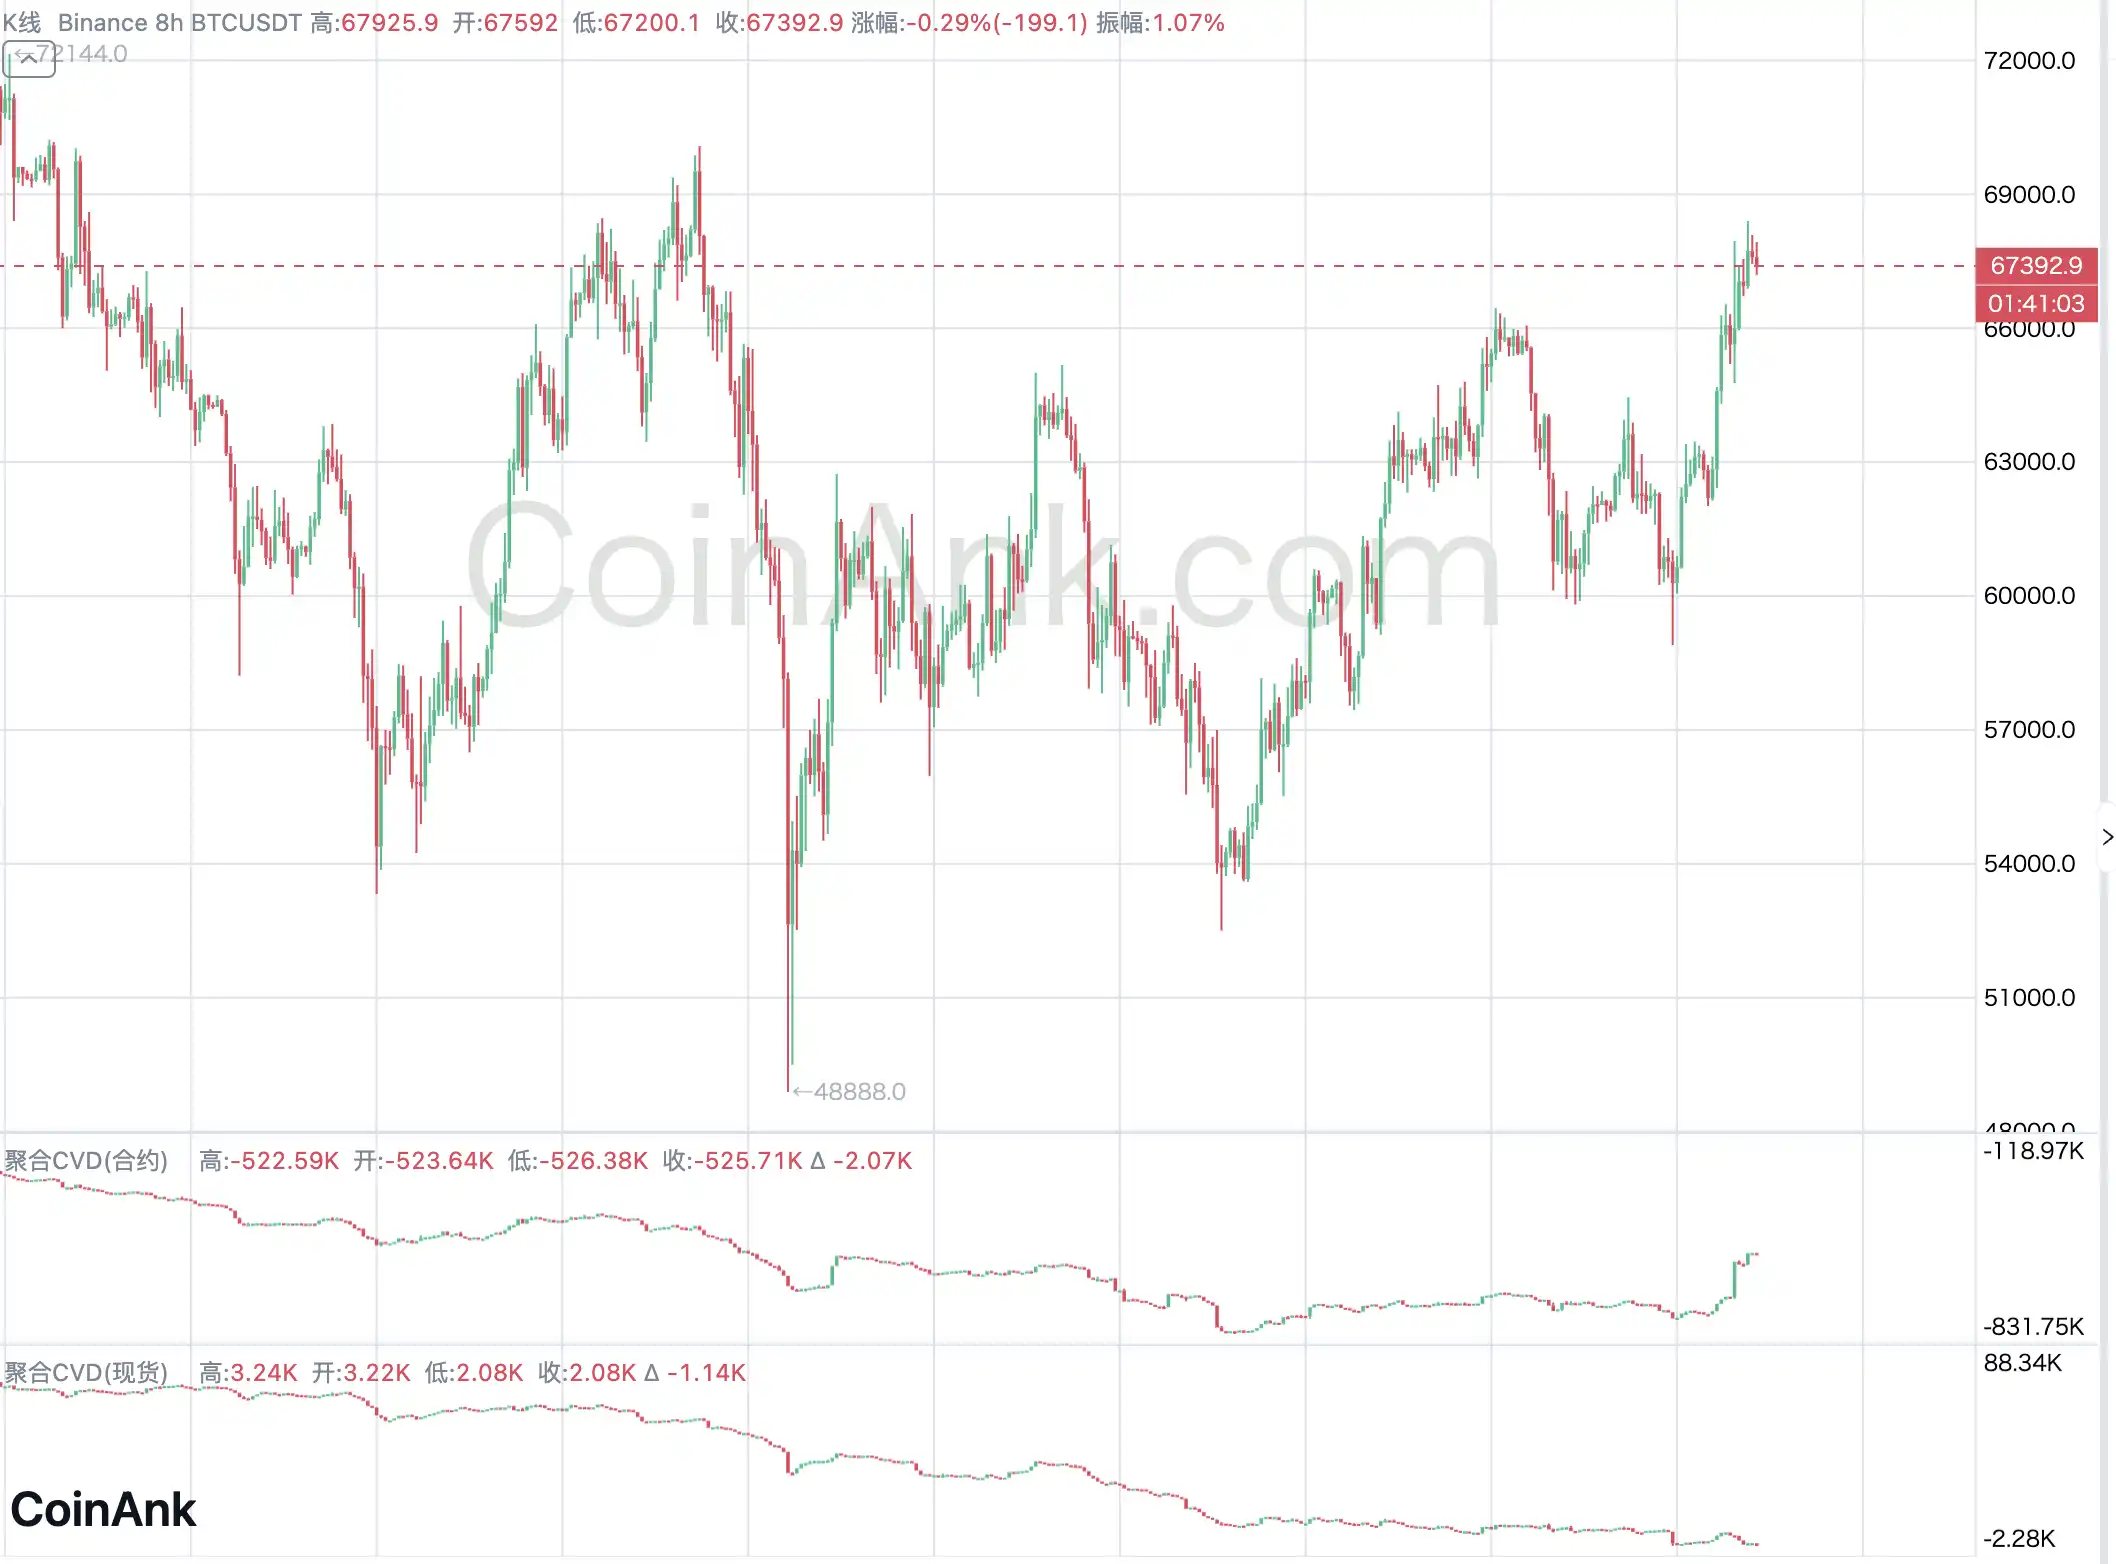
CVD is down, with active selling dominating.
However, the market is moving up, with a whale using iceberg orders to support the price, preventing CVD from dropping (active sell orders are absorbed by iceberg buy orders).
If this main force is strong enough to keep absorbing until above $70, it could support retail investors' return, leading to a bull market.
If the main force exhausts early, it will start to sell off.
免责声明:本文章仅代表作者个人观点,不代表本平台的立场和观点。本文章仅供信息分享,不构成对任何人的任何投资建议。用户与作者之间的任何争议,与本平台无关。如网页中刊载的文章或图片涉及侵权,请提供相关的权利证明和身份证明发送邮件到support@aicoin.com,本平台相关工作人员将会进行核查。


