Looking at the daily chart, Bitcoin's current bullish wave has basically reached the top of the descending trend channel, with a resistance level around 68,000. It has tested this level twice without breaking through with a solid close, so the pressure here remains very strong. Unless there is a solid close above this level on the daily chart, the bulls will not continue to push higher. A breakthrough of the previous high is just a matter of time; otherwise, it will continue to move along the descending trend channel. Overall, Ethereum's trend is relatively weaker compared to Bitcoin, currently testing the resistance around 2,700, and the major bullish counterattack signal needs to look at the 2,877 level. Therefore, after breaking through 2,700, there is still another hurdle for the bulls to restart; otherwise, it will continue to test the 2,300-2,200 range.
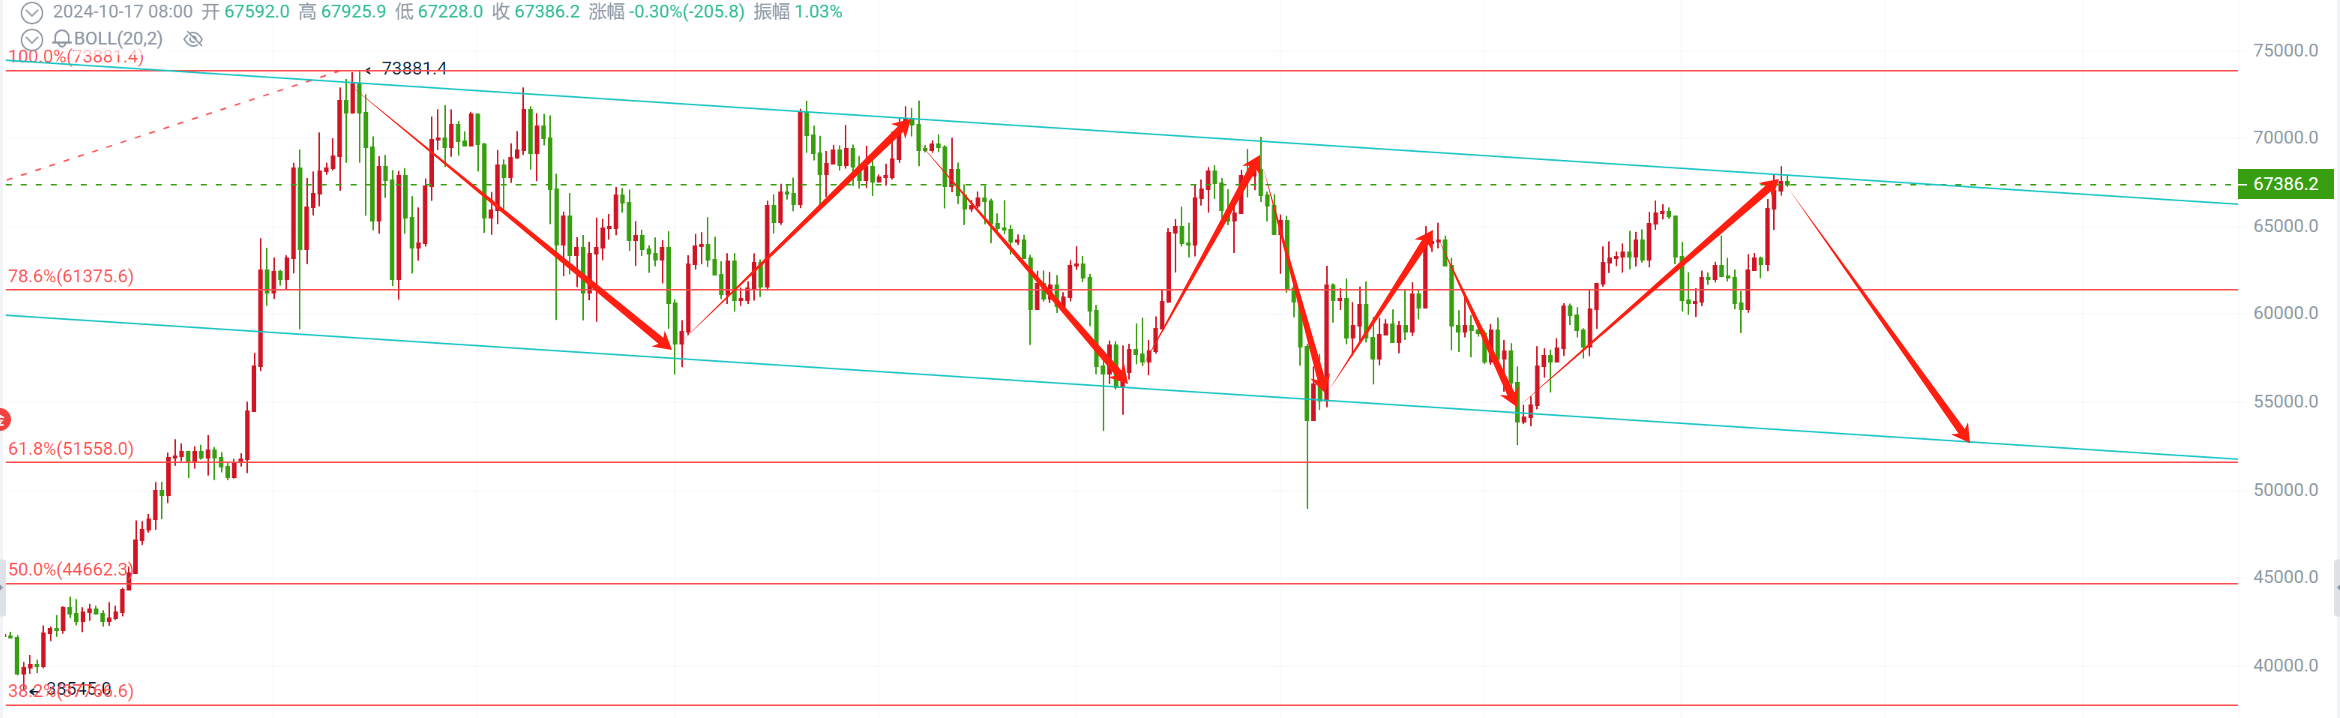
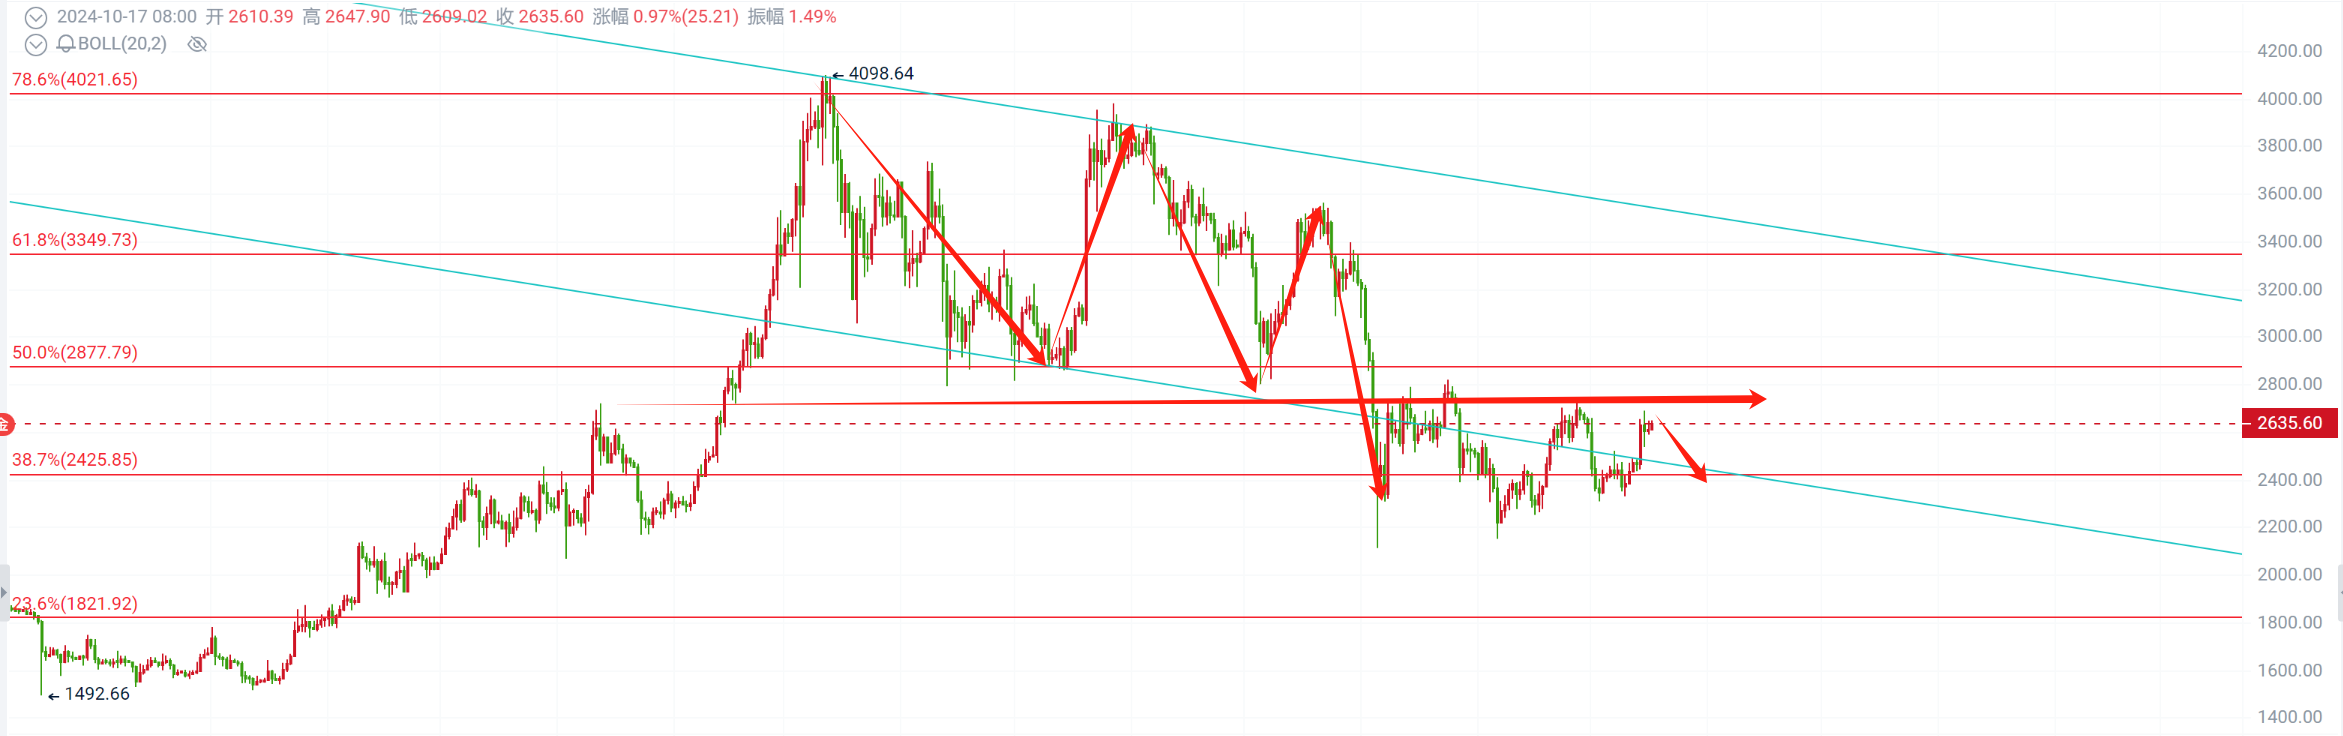
Looking at the 4-hour chart, both Bitcoin and Ethereum have seen a rise followed by a pullback, confirming the pressure above multiple times. In the short term, there is definitely a need for a correction, so this position is suitable for attempting to set up long-term short positions. Subsequent operations are recommended to focus on shorting!
Trading strategy: Short near the resistance level!
Short Bitcoin at 67,300-67,800, with a target of 66,000-55,000, and a stop loss above 68,500;
Short Ethereum at 2,630-2,650, with a target of 2,580-2,550, and a stop loss above 2,690;
The strategy is time-sensitive, and specific guidance will be provided in private real-time!
Professional team gold medal analyst Ruo Yu focuses on contract trading guidance. Follow the WeChat public account "Coin Circle Ruo Yu" to understand real-time market analysis and trading strategies!

免责声明:本文章仅代表作者个人观点,不代表本平台的立场和观点。本文章仅供信息分享,不构成对任何人的任何投资建议。用户与作者之间的任何争议,与本平台无关。如网页中刊载的文章或图片涉及侵权,请提供相关的权利证明和身份证明发送邮件到support@aicoin.com,本平台相关工作人员将会进行核查。


