Conveying the Way of Trading, Enjoying a Wise Life.
**
The price of Bitcoin has reached a high of $68,400 and has started to pull back. From the price performance over the past three days, the K-line chart shows that the first day maintained a long bullish candle, the second day had a medium bullish candle with very long wicks, and yesterday's closing line had a long wick, indicating a small bullish candle. Moreover, the size of the bullish candles is continuously shrinking, which is a sign of weakness during the upward movement. Therefore, for those who are blindly optimistic or do not know how to control their positions, there may be a risk of a washout at this stage.
From the daily chart level, we like to observe the highs and lows of the energy bars. If the subsequent energy bars are higher than the previous ones, and the price can also reach new highs, it indicates a positive correlation between the bullish momentum of the energy bars and the price. If the height of the energy bars is lower than the previous ones, or if the accumulation of energy bars is less than before, but the price reaches new highs, there is a potential risk of upward movement. Therefore, my view is to appropriately control positions and prevent the possibility of a relatively deep correction in Bitcoin.
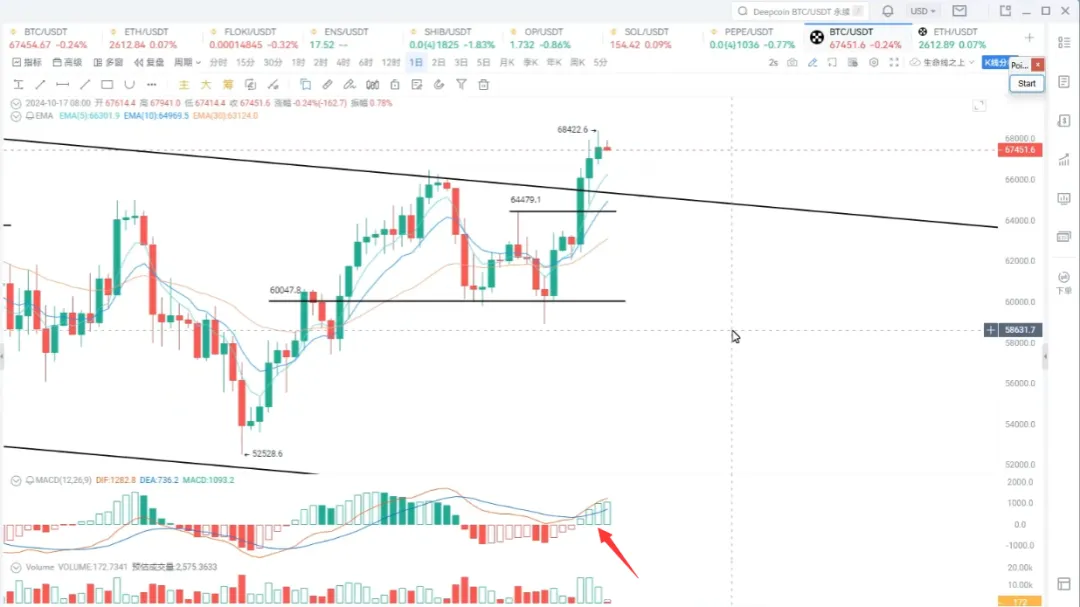
In terms of daily support levels, we can place it at the upper trend line of the downward trend, which corresponds to a price around $65,000. Currently at $67,400, is it possible for Bitcoin to break below $65,300? This point is relatively critical. If it breaks and forms a death cross again, it will face a relatively large correction. If it can find support at this level, or if it dips to $64,400 without forming a death cross, then it can continue to move upward, which is a more ideal state. Whether this can happen still depends on the market; what we can do is to manage risks well.
From the 4-hour and 6-hour levels, the price of Bitcoin has also appeared above the zero axis of the MACD indicator, and at this point, the price has created a new high. However, the energy bars at this position have gradually started to decline, and the MACD indicator may also show a death cross at this position. Therefore, a correction at the 4-hour level should be imminent.
So, is it possible for Bitcoin's price to establish a major upward trend this time? My view remains focused on whether the MACD indicator can form a golden cross at the close next Monday. If a golden cross can be formed, then the resonance of the golden cross will be established, and if it can stabilize above $66,000, the next round of Bitcoin's market will basically start, which will bring substantial returns. Of course, for most retail investors, this is also a market with extremely high risks.
Why is the risk extremely high for most retail investors during a bull market? Because the thinking of ordinary traders follows human nature; anything that aligns with human nature will make you feel happy, excited, and elated, which often leads to significant losses.
As for whether it is safer during a bull market or a bear market, my view is that it is safer during a bear market because the risks are visible, while the risks in a bull market are also visible. Therefore, a moment of awareness can turn the paradise of a bull market into heaven, while a moment of confusion can turn that paradise into hell. So, choosing between heaven and hell depends on your awareness!
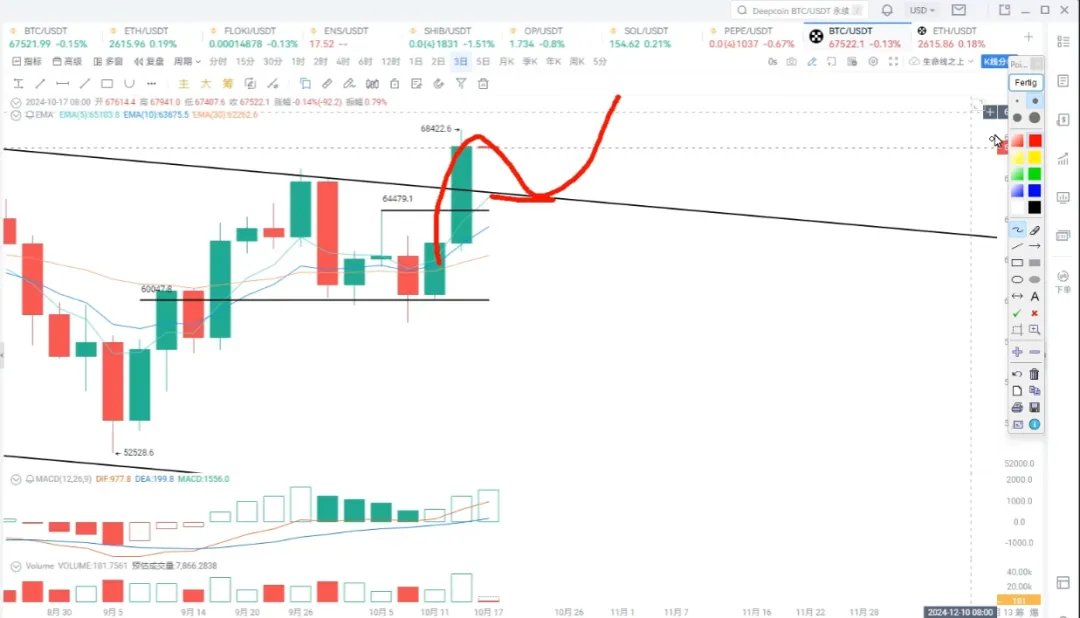
At the 3-day chart level, the price has closed with a long bullish candle, indicating an increase of 9%, which is a significant amplitude. The MACD indicator has just crossed above the zero axis, so at this position, the price of Bitcoin may pull back once, increasing the probability of a drop to around $65,500. Therefore, from the 3-day chart level, this is a positive formation because it has broken through the upper boundary of the channel. At the 5-day chart level, a golden cross has already formed, and its moving average system has started to develop upward.

The weekly level still needs a bit more momentum. If you are optimistic about the future market, just keep an eye on it and pay attention to risk control. Therefore, from the 3-day and 5-day perspectives, it is moving in the direction we expect.

Ethereum's price trend. From the 5-day chart, if the MACD indicator does not encounter any surprises and establishes a golden cross, it will also be a very good opportunity for a rebound. However, the pressure above is not small; the 30-week moving average is still pointing downward, and this position remains a significant resistance level. $2,800 is also an important resistance level for Ethereum. Above $2,800 is $2,900, and if Ethereum is to strengthen, it is best to stabilize above $2,900.
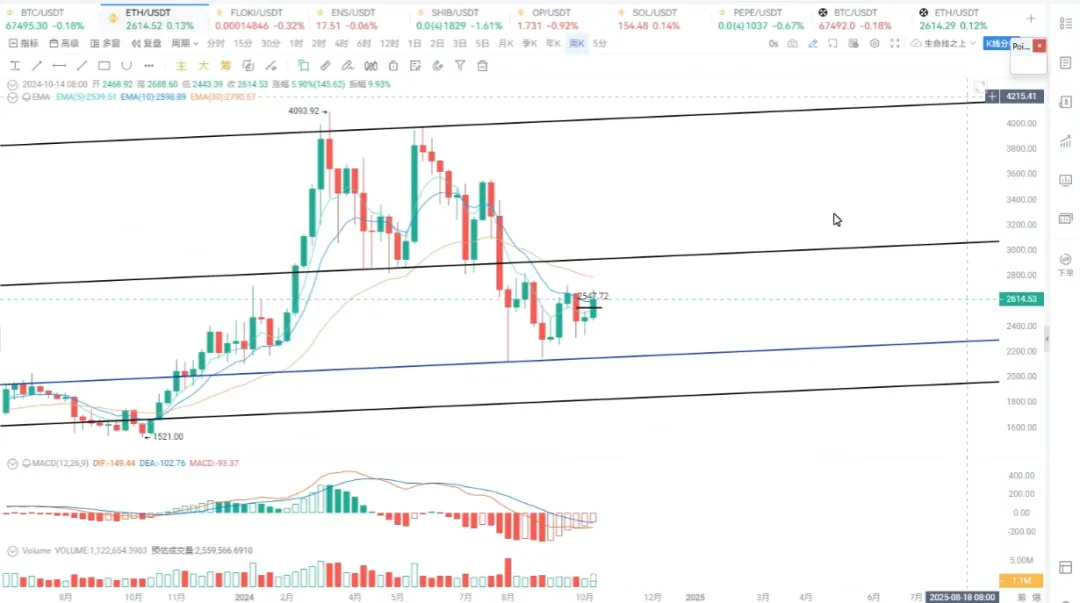
From the daily chart level, it is at $2,840, which will be an important watershed. If it can break through the 30-week moving average or the upper boundary of the channel, then a larger rebound will occur. We will not reduce our positions; instead, we will increase our positions.
Looking back at the smaller time frames, Ethereum's price has formed a long bullish candle in the past two days, which can also be understood as a golden bar. Therefore, every time it pulls back to $2,550, as long as it does not break, we can place our stop-loss above the breakout point of this K-line. After the pullback, we can re-enter in batches.
For more information, you can contact our assistant and join the VIP group.
免责声明:本文章仅代表作者个人观点,不代表本平台的立场和观点。本文章仅供信息分享,不构成对任何人的任何投资建议。用户与作者之间的任何争议,与本平台无关。如网页中刊载的文章或图片涉及侵权,请提供相关的权利证明和身份证明发送邮件到support@aicoin.com,本平台相关工作人员将会进行核查。