
The total open positions for Bitcoin contracts across the network have surpassed $38 billion, approaching historical highs. In previous instances when open contract positions reached around $70,000, the market declined after hitting historical highs. Can this time be an exception?
Gold has once again approached historical highs, while the US dollar index continues to rebound. Trump has threatened to impose a 100% tax on countries that do not use the dollar. The dollar index has been in a state of divergence; although there have been some policy measures to alleviate slow outflows, these measures are clearly a short-term fix and not a sustainable solution. The dollar index is bound to decline significantly.
This month, foreign investors have been selling Indian stocks daily, with a total value reaching $6.7 billion, and this month's sales are expected to exceed those of March 2020. The Buffett Indicator has reached a historical high of 199%, surpassing the dot-com bubble and the global financial crisis. Therefore, if the stock market experiences a downturn, the cryptocurrency market will also be affected, but medium to long-term opportunities will arise.
Bitcoin
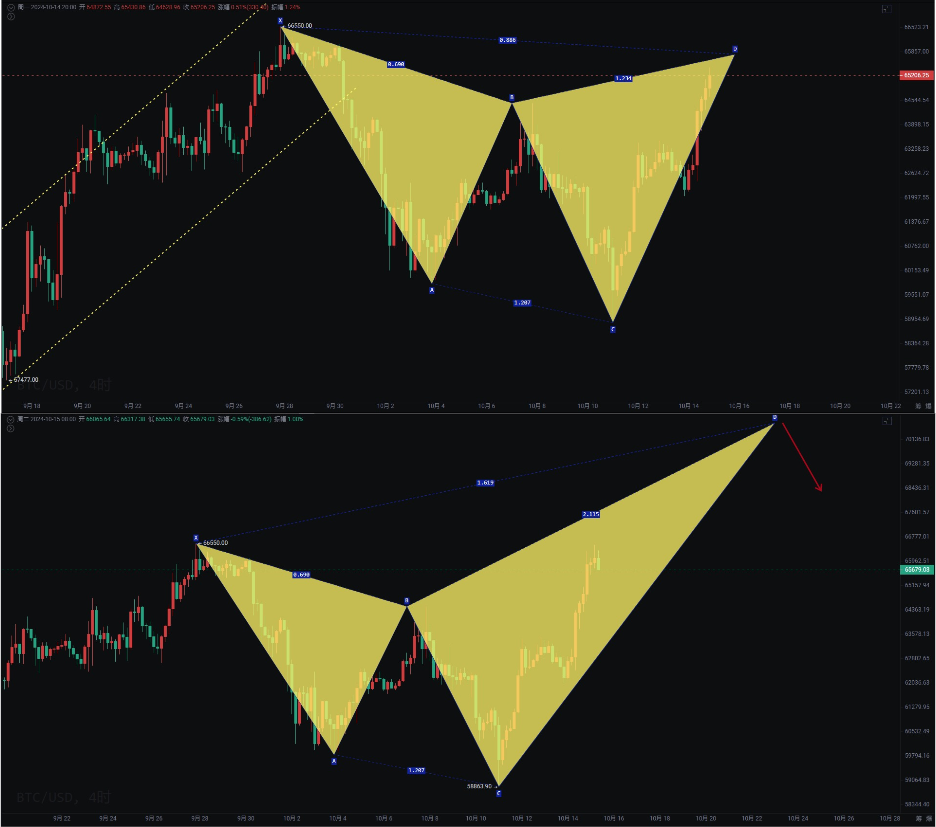
Bitcoin made another attempt to rise to 68,424, with a pullback testing the 68,500 resistance line. This is also the fourth test of the ascending flag pattern on the daily chart, increasing the probability of a breakout. Previously, the high points of 65,000 and the diagonal breakout at 66,500, along with the bottom support line, formed an ascending triangle breakout, so we should pay attention to not falling back to 67,000.
The weekly MACD shows signs of turning red, with the fast and slow lines crossing. We are waiting for this week to solidify, which will indicate a major direction.
Support:
Resistance:
Ethereum
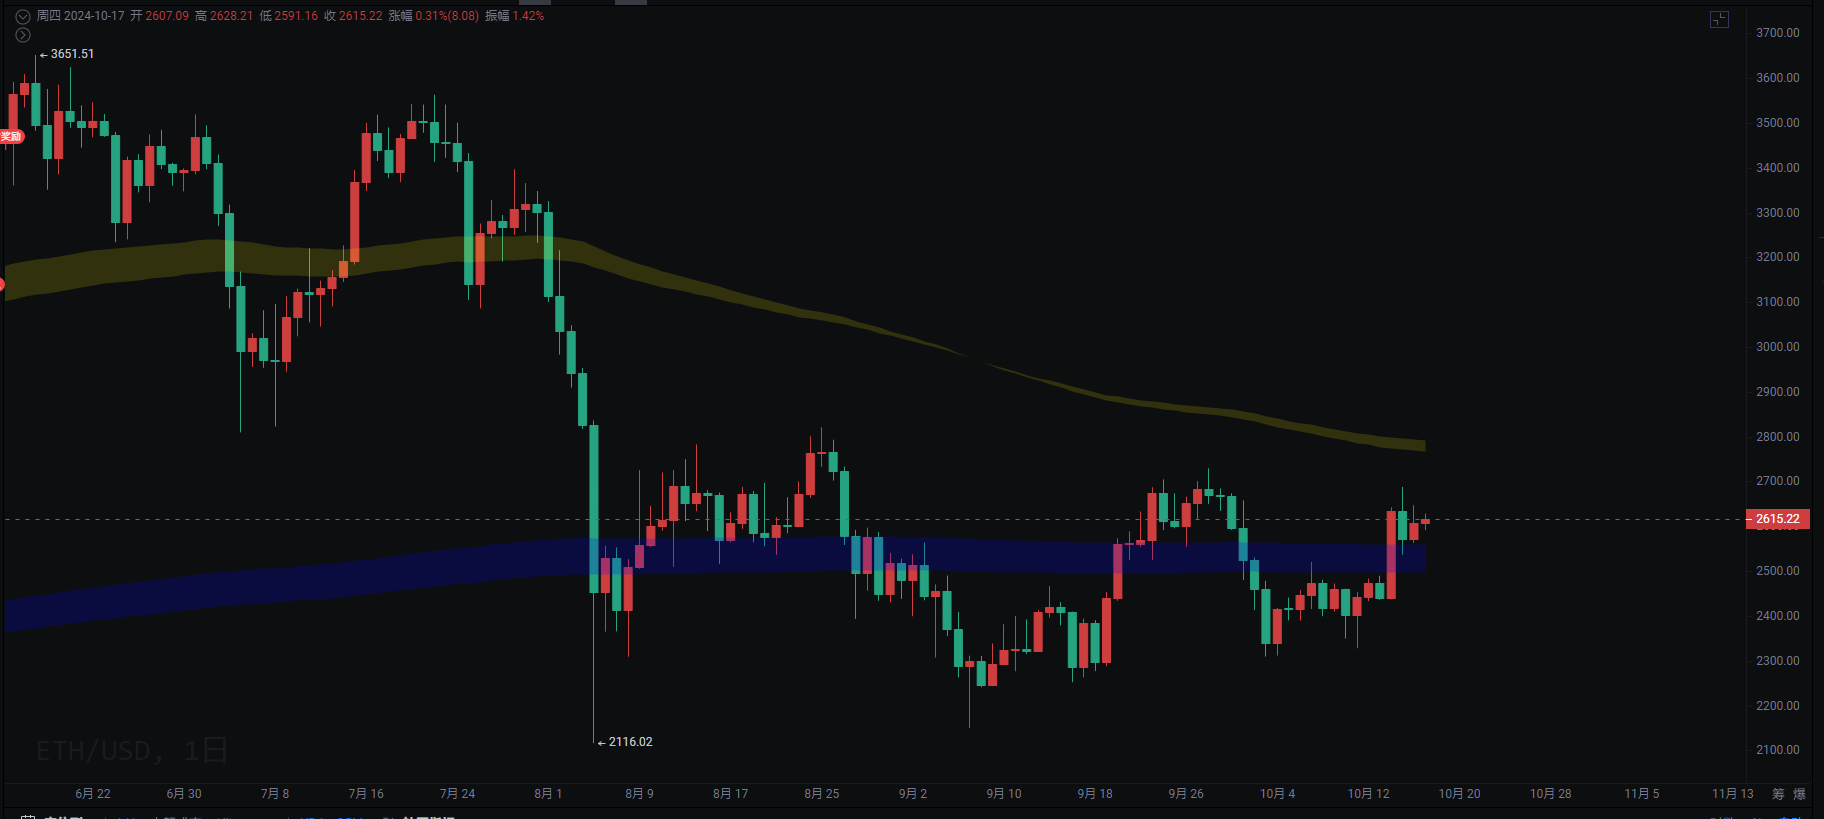
After a spike to 2,688, the price has not changed much, maintaining short-term fluctuations while also touching the upper line. Do not FOMO; it’s better to wait for a clear breakout. The daily price is above the EMA576 and EMA676 Vegas channel, but there is still some distance to the EMA144 and EMA169 channels.
Similar to the previous wave, pay attention to whether the ascending channel breaks out or breaks down. A pullback to go long is the next trend.
Support:
Support:
If you like my views, please like, comment, and share. Let's navigate through the bull and bear markets together!!!
This article is time-sensitive and for reference only; it is updated in real-time.
Focusing on K-line technical research, sharing global investment opportunities. Public account: Trading Prince Fusu

免责声明:本文章仅代表作者个人观点,不代表本平台的立场和观点。本文章仅供信息分享,不构成对任何人的任何投资建议。用户与作者之间的任何争议,与本平台无关。如网页中刊载的文章或图片涉及侵权,请提供相关的权利证明和身份证明发送邮件到support@aicoin.com,本平台相关工作人员将会进行核查。


