Data can improve the understanding of products and users by Web3 game developers, ultimately increasing the probability of the team making the right decisions.
Written by: Jake @ Antalpha Ventures, Blake @ Akedo Games, Jawker @ Cipherwave Capital
Introduction
Data is the carrier of information, and it can enhance the understanding of products and users by Web3 game developers, ultimately increasing the probability of the team making the right decisions. Data analysis can utilize appropriate statistical methods to analyze vast amounts of data, extracting useful information and forming conclusions, which can then be studied and summarized in detail. Since the development of games is influenced by various factors, along with randomness and chance, conducting multiple rounds of closed beta testing and internal testing for Web3 games in advance can evaluate and analyze the development status of Web3 games from multiple aspects, providing a certain psychological expectation for future public testing of Web3 games. From the perspective of investors, testing and operational data can prepare for post-investment management.
Source: Public market information
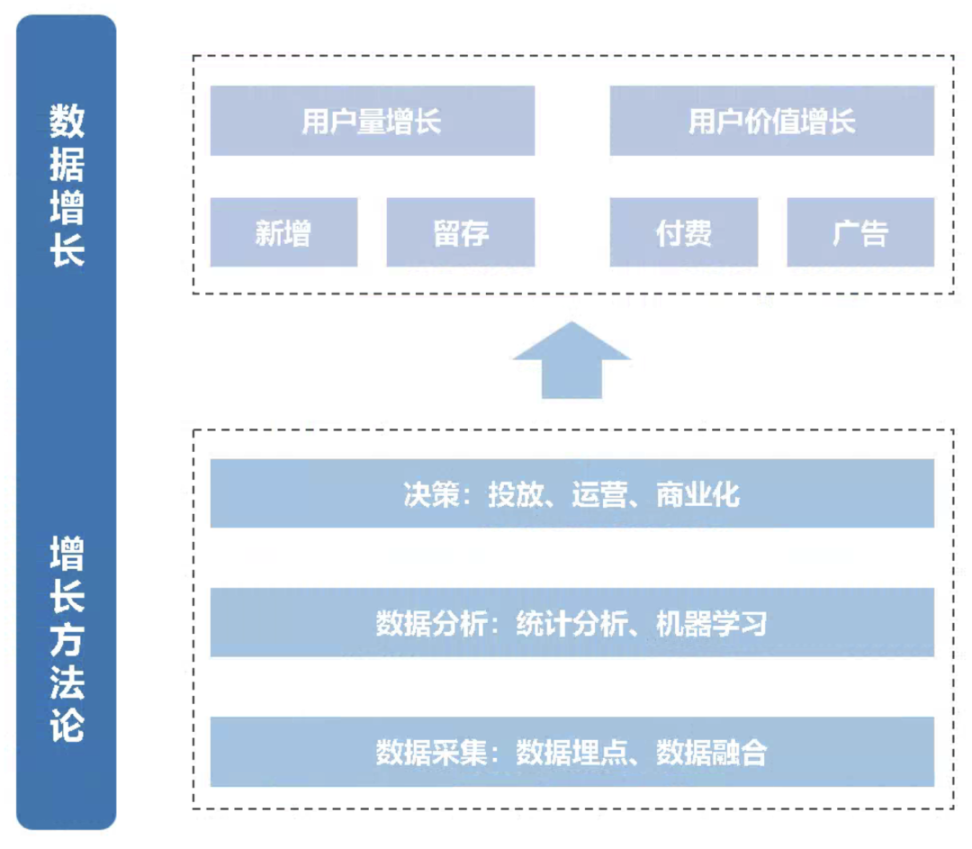
Based on the above analysis of Web3 Gaming, the final paying users of Web3 games are still consumer-oriented players, rather than investment and profit-seeking users. Therefore, Web3 games need to be delivered through multiple channels to real consumer-level users, and the operators of Web3 games need to conduct data testing and analysis on real consumer users and products. The revenue growth of games can be analyzed mainly from the growth of user numbers and the increase in user value. The growth of user numbers can be broken down into new users and retained users; the increase in user value can be broken down into in-game payments and external advertising revenue, etc. The ultimate goal of game growth is to enhance the number of users and the value generated by users in the game. For Web3 games, based on the closeness of data to the game, data testing and analysis can be conducted from the following four dimensions.
- Business routine data: Mainly covers the most basic data, such as usernames, passwords, arena rankings, information in the backpack, etc. Business routine data is the most important data for the business; any issues that arise will affect the normal operation of the Web3 game after public testing.
- User behavior data: The system records the user's behavioral trajectory in the game, such as recharges, level completions, upgrades, etc. User behavior data has a wide range of dimensions, the largest data volume, and is the most valuable part for mining. From a commercialization perspective, it can deeply explore the behavior of consumer users, clarify their behavioral preferences, and the balance of values within the Web3 game, laying a good numerical foundation for balancing user behavior during public testing.
- Product operation data: Data abstracted from some user behavior data, such as new user numbers, activity rates, retention rates, payment rates, etc.; this article will analyze this part in detail later.
- User feedback data: In most cases, feedback and evaluation data are generated outside the game product, such as evaluation data from Web3 game users on forums, App Store, and other platforms, providing another perspective and value for data analysis.
At the same time, since Web3 games will promote different activities at different times, such as sign-ins, holiday events, monthly events, etc., game operators need to enhance their project management, data analysis, and user research capabilities in Web3 games to match and analyze target user groups, extract massive data for analysis, and summarize key conclusions, providing feasible quantitative reference standards for decision-making and promoting executable planning and progress management. Therefore, the capabilities and levels of operators can be improved from the following multiple angles:
- User research and analysis: Identify target user groups and formulate product strategies, deeply understand the market situation and product characteristics of Web3 games; participate in daily community operations to meet the needs of different levels of users, and predict the real user behavior of Web3 games through detailed user research and behavior analysis; proactively feedback planning needs, and advise product development and promotion strategies to closely revolve around user needs.
- Data analysis and summarization: Complete data analysis and summarization work, deeply participate in product decision-making, establish models and indicator systems, and apply algorithms to improve product quality and optimize user experience. Through data analysis, the Web3 game project team can better understand user needs and make data-driven decisions.
- Project management: Establish an ecosystem of target user activities for Web3 games, refine user management and community operations to meet the needs of different levels of users, and effectively predict user behavior and public opinion trends; deeply understand product characteristics, participate in version planning, and apply insights to project planning and execution to respond to the needs of specific user groups and meet market demands.
In addition, if Web3 game operations can continuously explore in-game payment points, manage the overall Web3 game operation plan and implementation, and improve user activity and payment situations through methods such as points and levels, even planning resource allocation and consumer user management from a long-term perspective to achieve multi-faceted operational growth in attracting new users, promoting activity, retention, and payment conversion, this Web3 game operation can achieve an enhanced operational effect for the game. The following will provide a detailed analysis of specific game operation indicators and data analysis situations.
Source: Public market information
Data Analysis Indicators and Methods
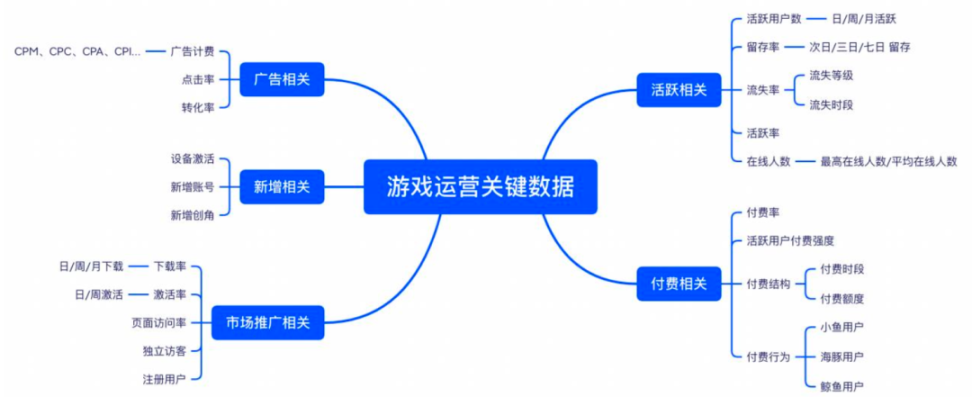
To seek rapid and high-quality game growth targets, data analysis can be used to improve the accuracy of analysis and decision-making. Starting from the advertising end, operation end, and commercialization end, integrate and analyze data both inside and outside the game, including cost conversion data from the advertising end, user source data from the attribution side, and in-game advertising monetization data, among others, to support precise decision-making in advertising, planning, and operations. The following diagram shows the key indicators and data dimensions that need to be analyzed in game operations, including advertising-related, new user account-related, market promotion-related, user activity-related, and payment-related. In actual operations, each type of Web3 game has different focuses on game operation data and indicators, so Web3 game developers can choose the operational indicators they focus on based on their own situation.
Source: Public market information
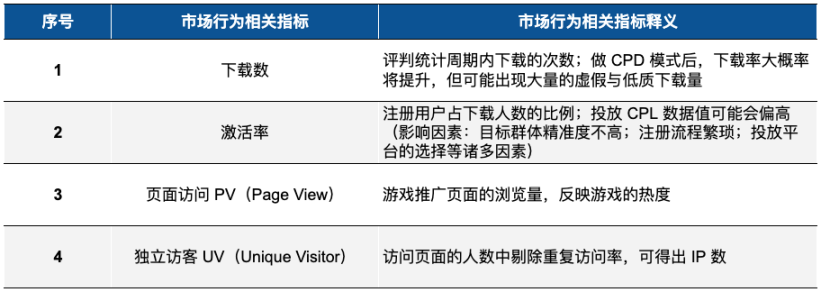
Regarding new users, the sources of new users mainly consist of two parts: application markets and paid acquisition. Among them, paid acquisition mainly involves running information flow ads, which can rapidly increase numbers in a short time, but due to the lifecycle of games, it is necessary to continue developing the next Web3 game after the lifecycle ends. In expanding new users, several factors influence the addition of new users to Web3 games:
- New conversion rate: The level of the new conversion rate directly affects customer acquisition costs. Analyzing the process, from the user clicking the ICON and browsing the details page, clicking the download button, completing the download, installing, to the user opening the Web3 game interface and registering, any link with a conversion rate that is too low will affect the final conversion. Due to limitations from the channel side and other factors, operations need to test the process to avoid situations where the conversion rate is too low.
- Resource position recommendations: Resource position recommendations can increase product exposure and download volume. Through Android and iOS channels, benefits and resource exchanges can be provided, and the new data after obtaining recommended positions often shows significant growth. Since some games are recommended based on revenue sharing, from the perspective of channel operations, to maximize the revenue from advertising positions, channels will also recommend the most attractive and profitable Web3 games. If a Web3 game is attractive in terms of revenue and user acquisition, even without spending extra money to enhance the recommendation position, channels will still place it in a higher recommended position.
- Natural cycles: The addition of new users in Web3 games exhibits cyclical phenomena, with the curve of new users steeply increasing during holidays, summer and winter breaks, weekends, etc.; at the same time, Web3 game developers can compare data from the same period last year to detect issues with the Web3 game, and the marginal growth rate can reveal whether the problem lies with the game itself or is cyclical.
- External promotion: The financing ability, capital strength, and creativity of Web3 game developers will all impact their external promotion. If there is insufficient funding, advertising cannot be placed; if there is a lack of creativity, the advertising cannot be converted into actual user growth. It is worth noting that the biggest drawback of external promotion is the inability to accurately assess effectiveness. In some cases, it is difficult for Web3 game operations to precisely identify this part of the user source, such as channel promotions, advertisements, etc.
- Product sharing: One of the lowest-cost and highest-quality ways to acquire new users. User-side referrals and traffic can more accurately assist Web3 games in expanding new users. Through inducement methods, the customer acquisition cost is far lower than the cost of paid acquisition.
New users are the foundation of all operational work and the guarantee of continuous profitability. In the Web3 world, Web3 game developers still need to invest funds to attract users. As the utility that games bring to Web3 users gradually declines, users will gradually churn, and the number of active users will stabilize after a period. As the lifecycle ends, the daily active user count will sharply decline, ultimately falling into a trough. When discussing payment issues, it is inevitable to mention the user lifetime value (LTV). If a user stops generating payment behavior after 60 to 90 days, then without new users joining, the product's profitability will continue to decline, and the payment contributions from old users will also stagnate. Therefore, Web3 games must continuously acquire new users to maintain profitability.
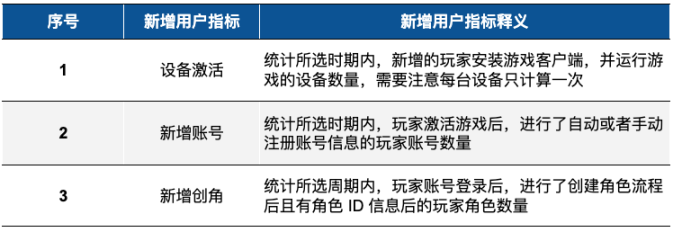
Due to the diversity of mobile device configurations (such as memory, storage space, system version, and network status), Web3 games may have certain configuration requirements to present better artistic effects to players. This may lead to some devices being unable to install, launch, or run the game application smoothly due to not meeting the minimum configuration requirements. Moreover, many third-party services currently provide convenient login methods, such as email verification codes, on-chain identity verification, wallet identity verification, and third-party accounts (such as exchange identity verification, Apple ID, etc.) for quick login, which greatly simplifies the user account registration and character creation process. The following are commonly used data indicators for new user analysis:
Source: Public market information
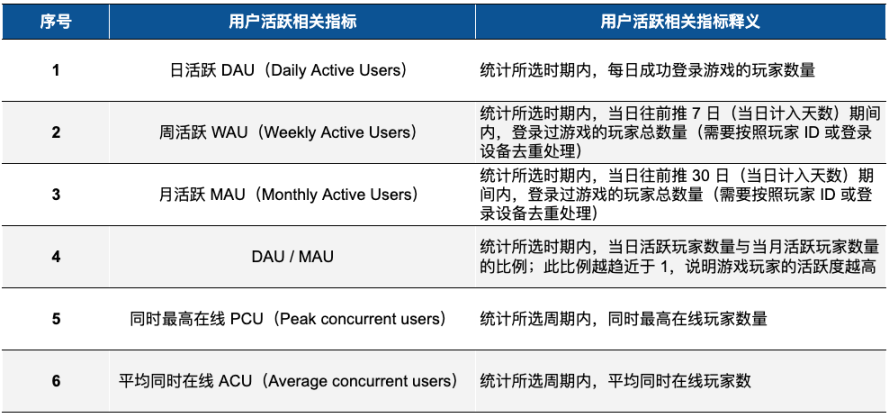
In terms of user activity, the number of active users and related metrics can be analyzed to assess player engagement within the game. The number of players who launched and logged into the game during the selected statistical period directly reflects the current user base of the game product. Active players include both returning players and new players, with returning players being those who logged in again after initially joining. Regarding activity, in addition to the inherent appeal of the gameplay itself (core elements), some auxiliary activities (such as sign-ins, login rewards, daily and weekly tasks, etc.) can effectively encourage players to log in again and remain active. For certain mid-core and hardcore Web3 games, social features can enhance interaction and communication among consumer-level users, increasing user stickiness, such as friends, mentors, families, factions, and guilds, which can enhance the social attributes and atmosphere of the game. The following are commonly used metrics for user activity in Web3 game operations:
Source: Public market information
Using data analysis tools and metrics such as Google Analytics, Mixpanel, and Flurry can assist Web3 game operations in analyzing metrics like user retention rate, payment rate, and churn rate to identify potential issues and conditions. Overall, mid-core and hardcore games tend to have longer user lifecycles and higher ARPU, so user churn significantly impacts the growth of Web3 games; the longer the churn time, the lower the return visit rate. Decision-makers need to analyze the reasons for user churn based on multidimensional user data to avoid greater losses. For example, the marginal curve of user churn over a unit of time can be derived (f(x)=△x/△t), analyzing various factors affecting user retention and churn, such as game content, core game mechanics, progress bugs, task guidance, level and rank settings, etc., and using emails, SMS, in-game private messages, airdrops, etc., to recall lost users.
For the social activity of mid-core and hardcore Web3 games, analysis can be conducted from three dimensions: penetration rate, conversion rate, and conversion cycle. In terms of penetration rate, metrics include the first-day friend penetration rate (the penetration rate of new players completing the friend-adding step on the first day), average chat frequency, average number of friends added, and average number of chatting friends; regarding conversion rate, it is necessary to measure the conversion rate at each step of establishing social relationships, such as from account registration to successful matching, to following friends, adding friends, and chatting; in terms of conversion cycle, the conversion cycle from a user adding their first friend to their first chat can be analyzed to measure the demand for social interaction among Web3 game players.
Additionally, tools like SurveyMonkey and Typeform can be used to further investigate user needs and feedback, collecting user opinions to better align core gameplay mechanics and art with user demands. In marketing, tools like Hootsuite, Buffer, and Sprout Social can facilitate quick content publishing, user interaction, and social media account management; furthermore, Web3 game operations can utilize appropriate automation tools to send emails through email automation tools, publish content through social media automation tools, and run ads through advertising automation tools, improving work efficiency and accuracy while reducing the workload of operators. In the process of collaboration between Web3 game planning and operations, it is essential to continuously monitor changes in user needs and behaviors, as well as competitor dynamics, to optimize and improve operational strategies, thereby enhancing user retention and activity. Therefore, during execution, attention can be focused on the following aspects to increase user activity and stickiness in Web3 games.
- Update game content: Updating game content is key to maintaining user activity. For Web3 games, some players may experience most of the game content in a short time, and if there are no updates for an extended period, player interest will gradually wane. Therefore, the operations and planning teams of Web3 games need to continuously introduce new content, such as new levels, storylines, or items, to meet player demands and stimulate their long-term interest in the game.
- Rewards and events: Rewards and events are important means to attract players to participate in the game. The continuous pleasure and immersion that Web3 games can provide to users are key to increasing user activity. Therefore, Web3 game operations can regularly launch various forms of rewards and events to enhance users' sense of achievement, such as daily sign-ins, holiday events, limited-time sales, and check-in challenges, to boost player participation and retention. Additionally, operators can provide corresponding rewards based on players' game performance, such as in-game currency, items, titles, etc., further incentivizing active participation.
- Optimize game experience: Game experience is one of the key factors affecting player activity. Web3 game operations should continuously optimize the game experience based on player feedback and needs. Specifically, optimization can be achieved through improving visual quality, enriching sound effects, enhancing operational smoothness, and reducing loading times, thereby comprehensively enhancing players' immersion and satisfaction. This ongoing optimization not only helps improve player loyalty to the game but also effectively extends the game's lifecycle.
- Improve game quality: Game quality is one of the core elements affecting player activity. Game operators should ensure high quality and stability of the game, avoiding technical issues such as lag and crashes. At the same time, it is necessary to strengthen the game's security and anti-cheat mechanisms to ensure a fair competitive environment, thereby enhancing the game's playability and user experience. By ensuring quality and security, game developers can effectively retain existing players and attract more new users, increasing overall activity.
- Social interaction among users: For mid-core and hardcore games, a well-developed social interaction platform can promote communication, interaction, competition, and sharing among Web3 players, thereby enhancing connections between players and increasing users' sense of belonging and loyalty. Specifically, features such as chat rooms, community forums, friend systems, and leaderboards can be added to create a more convenient and diverse interactive experience, further deepening players' social bonds and enhancing overall user stickiness and activity.
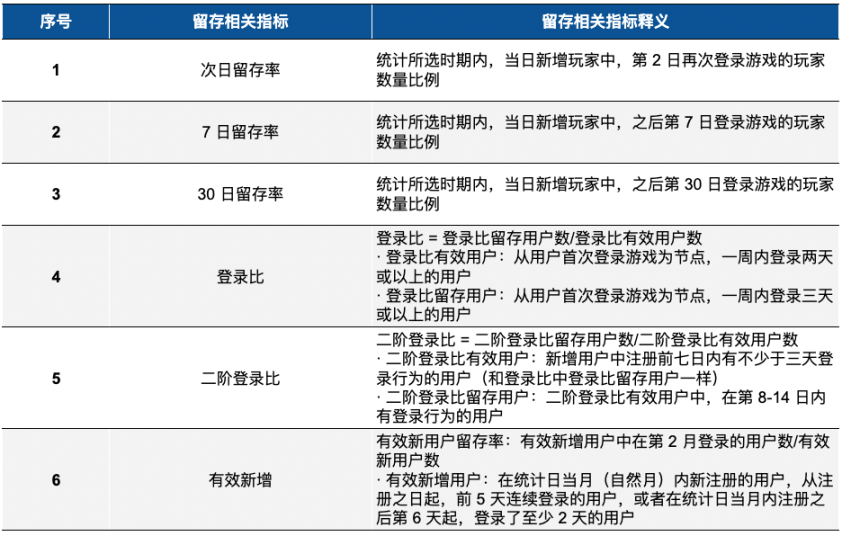
In terms of user retention, retention refers to the proportion of new users who log in again on subsequent dates. A higher retention rate reflects the product's quality and its ability to retain users, thereby indicating greater monetization potential. When directly viewing retention rates, comparisons are made for each consecutive date after new user registration. For example, if a user registers and experiences the game but does not log in on Day 1 for some reason, but logs in almost every day starting from Day 2, this situation will not count towards the next day's retention (Day 2 retention). Therefore, focusing solely on Day 2 retention may lead to biases, and a more comprehensive data analysis is needed. The following are metrics for user retention that Web3 game operations can refer to, such as login ratios, second-stage login ratios, and effective new users. Generally, a Day 2 retention rate of 40% is considered excellent; a seven-day retention rate of 20% is regarded as a good game; and a monthly retention rate of 10% is considered high for a game (excluding bot and witch attack scenarios).
Source: Public market information
Through user retention-related metrics, the post-monetization potential of Web3 games can be effectively assessed and analyzed. If the target user group of Web3 games is positioned as the consumer group of the game, and the advertising channels are aimed at consumer users rather than investment-seeking groups, then based on Bayesian conditional assumptions, it is usually necessary to evaluate the first-day retention, first-week retention, and first-month retention of the game user group. Taking the DAU/MAU ratio as an example, a ratio below 10% is considered poor performance, while a ratio exceeding 30% can be regarded as a relatively immersive game (i.e., 33% of players log in daily). The following is a detailed analysis of retention-related data.
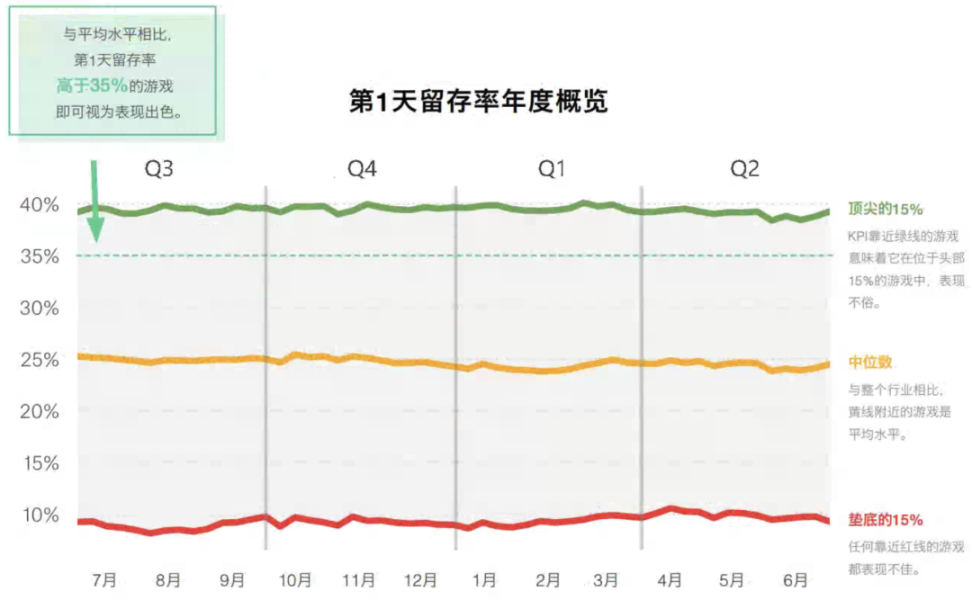
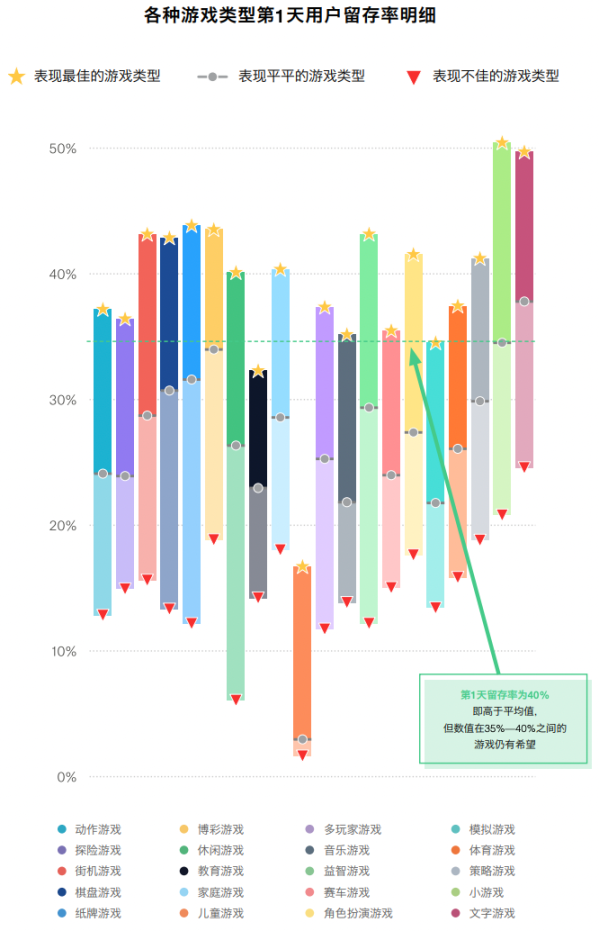
For Day 1 retention, the evaluation standard for game retention rates typically falls between 15%-40%. If the Day 1 retention rate is too low, a thorough overhaul of the game is necessary. Some game studios may choose to delist poorly performing games (sometimes even abandoning any project with a retention rate below 35%). In certain cases, cutting losses and moving on to the next project may be a wiser strategy. In most cases, games with retention rates below 20%-30% are unlikely to have significant long-term economic benefits. The percentile level chart of game retention and the Day 1 retention rates of different types of games can be referenced in the following two charts.
Source: Public market information
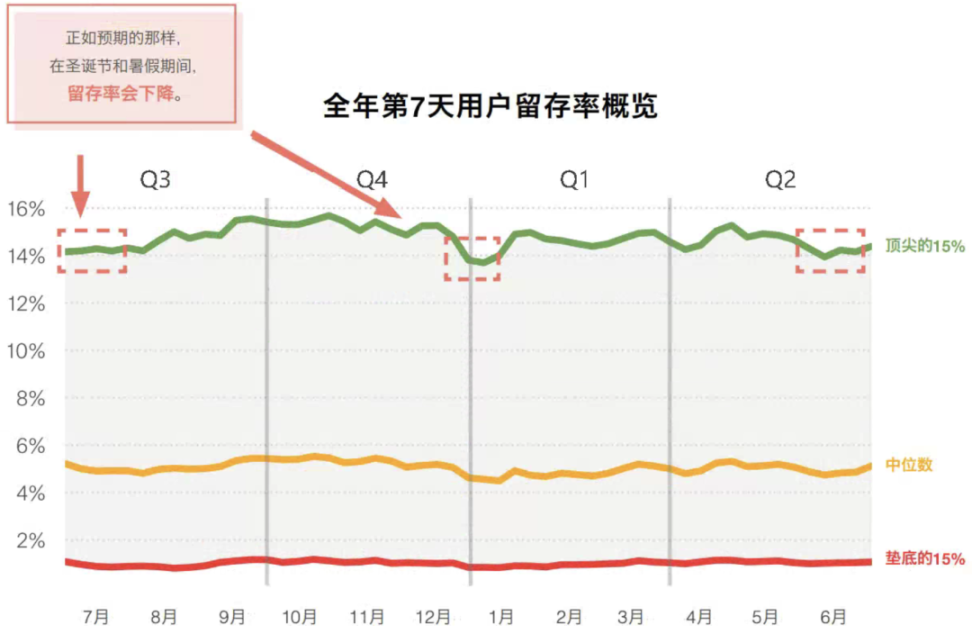
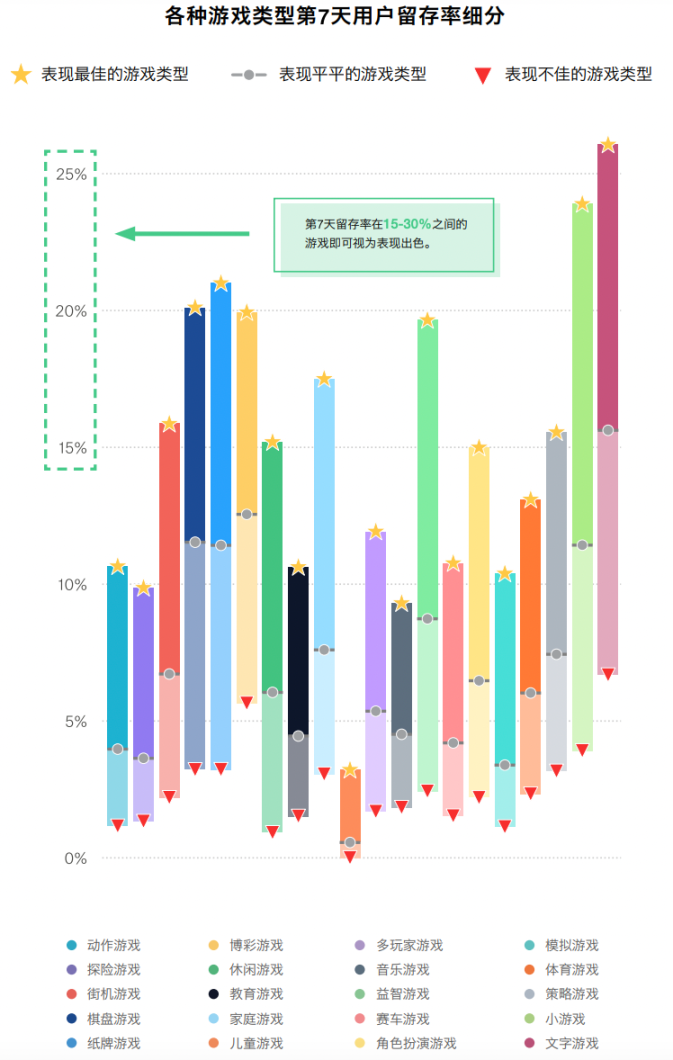
Regarding the retention rate of consumers in the first week, since the marginal benefits and enjoyment that the same Web3 game provides to users gradually decrease, players are likely to lose interest in repetitive content, leading to a downward trend in user retention rates during the first week. Therefore, game planning and operations must ensure that players can continuously unlock new content—whether it be items, areas, or levels—when designing the repetitive experience of core gameplay. By introducing novel elements and avoiding monotony, long-term player engagement and retention can be effectively enhanced. It is worth noting that user retention in Web3 games is significantly influenced by seasons, holidays, and vacations; at the same time, the first-week user retention rates can vary greatly among different types of Web3 games. The percentile level chart of game retention and the first-week retention rates of different types of games can be referenced in the following two charts.
Source: Public market information
Source: Public market information
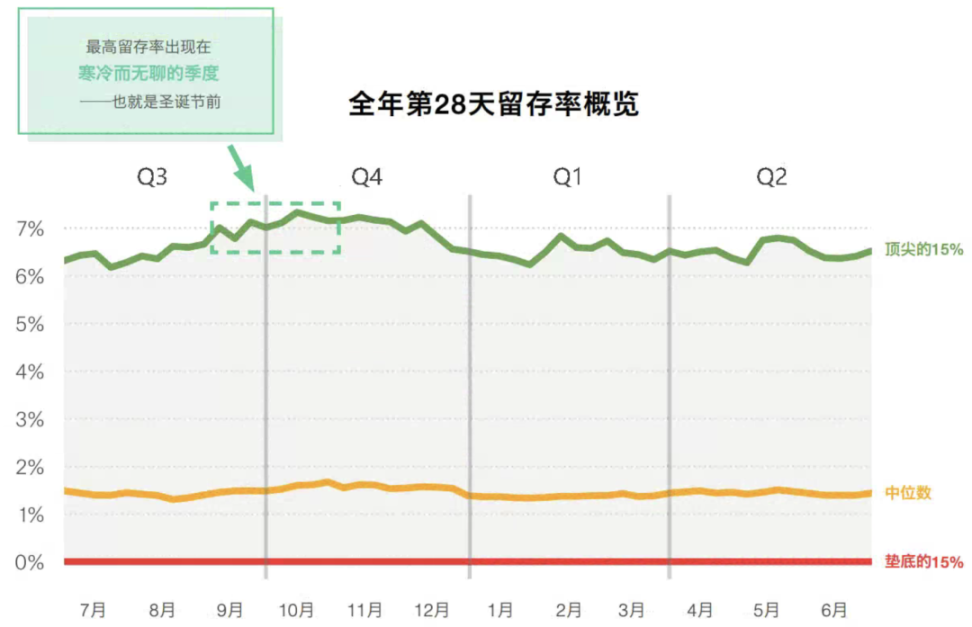
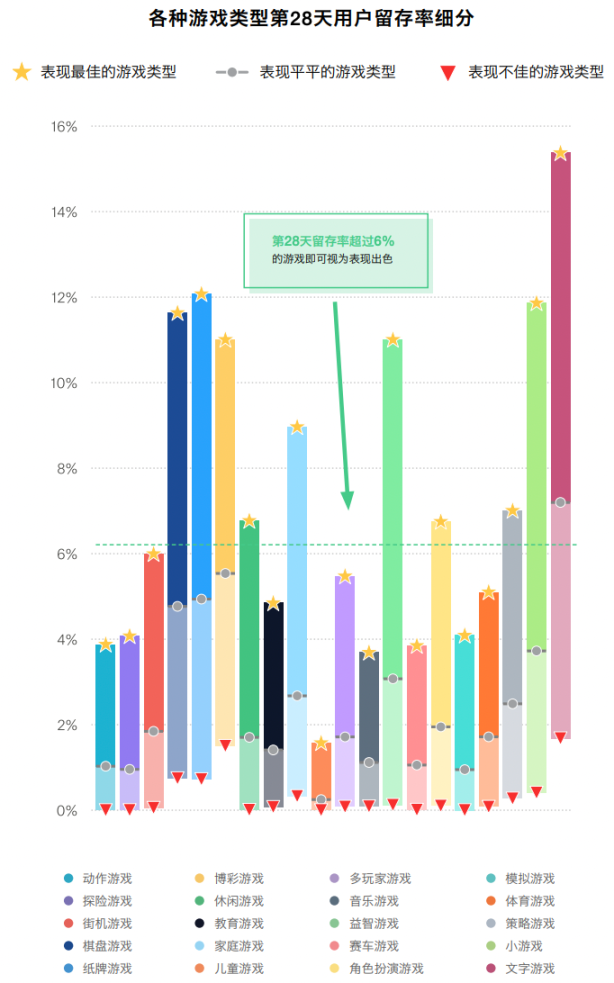
For the first-month user retention rate, users who remain active after 28 days can be considered loyal players of the game. The design of the game's core mechanics is crucial for retaining players; although designing an excellent ending can be challenging, it allows users to continue enjoying the core gameplay. Introducing player-versus-player modes, daily challenges, and leaderboards are effective means to maintain users' enjoyment and sense of achievement. It is important to note that even the best-performing games have a Day 28 retention rate of only 6%; while the bottom 15% of games have a Day 28 retention rate of 0%, highlighting the difficulty of retaining players for a month and the necessity for Web3 games to continuously invest in different channels. The highest retention rates typically occur in Q4, around Christmas. The percentile level chart of game retention and the first-month retention rates of different types of games can be referenced in the following two charts.
Source: Public market information
Source: Public market information
In terms of user payments, the various data metrics generated by payment behavior directly reflect the revenue capacity of the product. Players pay not only to obtain a higher quality gaming experience but also out of love and support for the game. For different user groups (classified based on payment ability and habits), the operations team can design differentiated commercialization plans to effectively drive the growth of related payment metrics, further enhancing the overall revenue of the product. Generally, the planning and operations teams can design core gameplay mechanics from the emotional and psychological perspective to increase users' willingness to pay. The reasons for game users' top-ups can be summarized as follows:
- Psychological inducement in game design: Limited-time events, rare items, discount packages, and other designs in Web3 games leverage the human psychology of "scarcity," creating a sense of urgency and FOMO (fear of missing out) among players, prompting Web3 game users to top up to avoid missing potential advantages or opportunities.
- Sense of satisfaction and reward mechanisms: Stimulating Web3 players' emotions through immediate feedback reward mechanisms allows players to quickly obtain items, equipment, or privileges after topping up, providing instant satisfaction. Immediate rewards enhance players' positive emotions, making Web3 game users willing to invest more continuously.
- Comparison and competitive psychology: In multiplayer online games, competition and social interaction among Web3 players are significant factors driving users to top up. By topping up to acquire better equipment or abilities, players can gain an advantage in competition, thereby earning social recognition and respect. Additionally, seeing friends or rivals obtain superior equipment can trigger comparison psychology, further prompting them to top up.
- Sense of achievement and self-identity: Designs in the game related to levels, rankings, and task completions stimulate players' sense of achievement, especially when players enhance their sense of achievement through topping up, making them more likely to choose to pay to reach their goals. A sense of achievement not only strengthens players' self-recognition but also stimulates their ongoing investment in the game.
- Emotional attachment: For some players, topping up can enhance their status and experience in the virtual world, thereby boosting their confidence and sense of control within the game. This emotional attachment makes them willing to top up for a deeper immersive experience.
Furthermore, to manage users more finely, user tagging and stratification can be implemented to distinguish information such as user stickiness, spending ability, and potential churn risk, allowing for the monitoring of user data changes and transitions under different tags. It is important to note that while it is possible to manage paying users finely during game operations and personalize the push of related NFTs or other assets, one must never adjust in-game probabilities, matching mechanisms, or differentiated service mechanisms based on the profiles of paying users. Implementing price discrimination mechanisms for users of different spending levels, regions, and profiles would directly violate consumer and personal information protection laws. For example, in the United States, if a Web3 game project lowers the probability of obtaining equipment for paying users to "encourage" them to continue spending, it would directly violate multiple laws and regulations within the U.S. Based on the nature of Web3 game products, organizations such as the Federal Trade Commission (FTC) and the Consumer Financial Protection Bureau (CFPB) directly protect the rights of paying users; applicable laws include, but are not limited to, the Federal Trade Commission Act (FTC Act), the Dodd-Frank Wall Street Reform and Consumer Protection Act (Dodd-Frank Act), the Gramm-Leach-Bliley Act (GLB Act), the Truth in Lending Act (TILA), the Fair Credit Reporting Act (FCRA), the Fair Debt Collection Practices Act (FDCPA), the Equal Credit Opportunity Act (ECOA), the Identity Theft and Assumption Deterrence Act, the Children’s Online Privacy Protection Act (COPPA), the Telephone Consumer Protection Act (TCPA), the Video Privacy Protection Act (VPPA), the Federal Tort Claims Act (FTCA), the Consumer Product Safety Act (CPSA), the Federal Food, Drug and Cosmetic Act (FDCA), the Magnuson Moss Warranty Act, the Lanham Act, and the Securities Exchange Act of 1934 (SEC Act), among others. Similarly, other countries have similar applicable laws to protect consumers and investors.
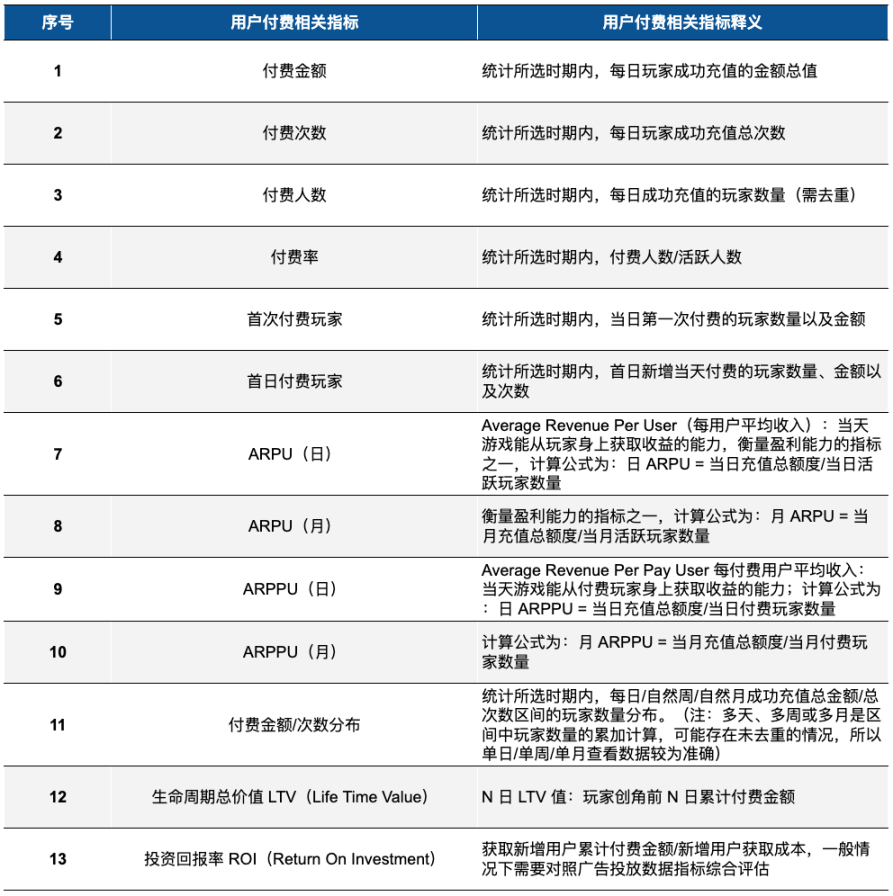
All Web3 consumer-level users' payments will go through the stages of "non-payment - first payment - repeat payment - non-payment and churn," so in this payment conversion process, game operations need to perceive users' psychological states of "breaking the ice payment - repurchase - loss of recognition." According to statistics, the average conversion rate for paying players is 1.5% per month, with an average daily conversion rate of 0.3%; the top 10% of spenders typically account for 50% of game revenue. In measuring user payment levels and product revenue, Web3 game operations can refer to the following metrics in the table, including but not limited to the number of paying users, payment amounts, ARPU, and other related metrics.
Source: Public market information
Based on the statistical analysis of user payments, game operations can analyze users' psychological stages of "non-payment - first payment - repeat payment - non-payment and churn" through multiple metrics. Therefore, based on the analysis results, all players can be stratified or tagged to obtain the payment habits of players with different spending abilities, and personalized pushes or refined operations can be carried out accordingly. Some reference case metrics are as follows:
- Ice-breaking phase: Analyze the distribution of ice-breaking payments to gain insights into which payment nodes help players complete their first payment, providing precise evidence for future optimization and enhancement.
- Player preferences: Analyze whether players prefer cosmetic items or power-enhancing items or goods based on all players' payment nodes and token consumption data, to better grasp player needs; at the same time, the rationality of the related data can be analyzed to better set the game's balance.
- Level dimension: Assess the correlation between user levels and payment conversion rates to determine whether players' payment behaviors occur at appropriate payment nodes, thereby evaluating the rationality of payment design.
- Activity analysis: Evaluate the impact of activities on payments. For example, analyze the player data of those who completed specific activities through retention models to understand whether their payment rates show significant improvement, thereby clarifying player preferences for certain activities.
When evaluating user payments, based on first-day payment penetration rates and first-day ROI data, Web3 game operations can determine whether the core mechanisms and levels of the game are set reasonably according to users' payment preferences and payment points. If the pass rate of a certain level in the game is higher than that of other levels, it indicates that the payment point is ineffective; by comparing the actual output with the expected output over a unit of time, one can discover overproduction or underproduction, allowing for adjustments to the ineffective payment point's previously excessive payment points or output reward values, such as adjusting the daily dungeon limit, weekly or monthly card reward values, arena attempts, enhancement material values, etc. After adjusting the values, one can find that the output curve becomes smoother and closer to the expected revenue curve, and the anticipated payment points will emerge.
In terms of advertising, due to the short user activity duration and poor user payment situations, some Web3 games need to generate additional revenue from advertising to monetize while avoiding issuing assets for extra income. For Web3 games, using the minting rights of on-chain assets is akin to drinking poison to quench thirst, and excessive asset issuance should be avoided. All Web3 games must use the minting and issuance rights of assets cautiously; unanchored arbitrary asset issuance can lead to credit bankruptcy. Generally, game advertising types are mainly divided into three categories: banner ads, interstitial ads, and rewarded video ads. Traditionally, advertising monetization is more suitable for light games, but in recent years, with the development of Web3 games and the growth of the advertising industry, advertising has gradually become one of the monetization avenues for mid-core and hardcore games. Mid-core and hardcore games have relatively rich gameplay, and the payment scenarios within the game are abundant, leading to a strong sense of immersion in the gaming experience. In this context, interstitial ads and banner ads often severely disrupt users' gaming experiences; therefore, rewarded video ads are usually regarded as the best solution for mid-core and hardcore games. Moreover, in the vast majority of games, rewarded videos are considered the best overall experience and the most efficient form of monetization, as users can choose whether to watch them and receive corresponding rewards afterward. Especially for Web3 games with short user lifecycles and low retention rates, which heavily rely on advertising and user acquisition to expand their user base, advertising revenue is one of the ways to quickly supplement revenue. It is worth noting that for Web3 games primarily focused on advertising monetization, if IAA (In-App Advertising) cannot be measured, then advertising recovery cannot be assessed. In most cases, optimizers can only judge subsequent optimization strategies based on CPI and retention conditions.
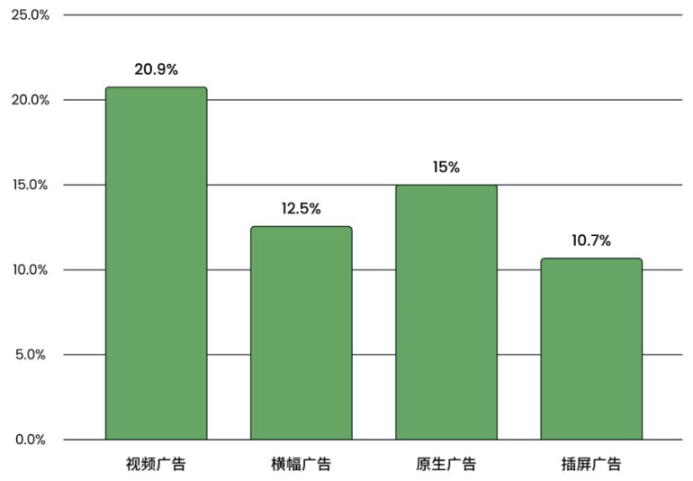
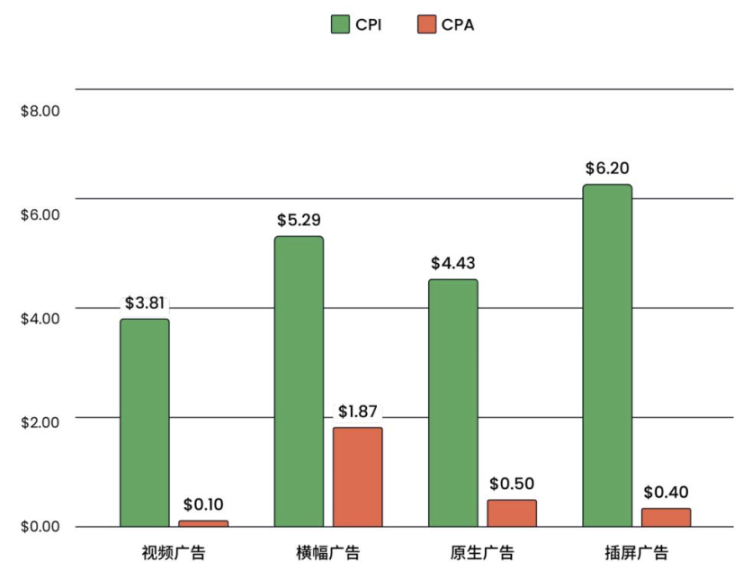
In terms of advertising investment and returns, the lowest revenue is generated from banner ads at $0.005, while the highest can reach $1. As of Q2 2024, statistics show that video ads provide the highest return based on a 7-day return on investment, exceeding 20%, while other ad types have return rates between 10% and 15%. The click-through rate for banner ads ranges from 0.25% to 0.75%, while interest ads have a click-through rate of 5% to 10% (from users who clicked unexpectedly). The CPI and CPA for video ads are lower, approximately $3.81 and $0.1, respectively, indicating that this type of ad is more effective; interstitial ads have a higher CPI and are the hardest to trigger user installations; banner ads have a higher CPA, 18 times that of video ads, suggesting that users pay less attention to this type of ad.
Source: Public market information
Source: Public market information
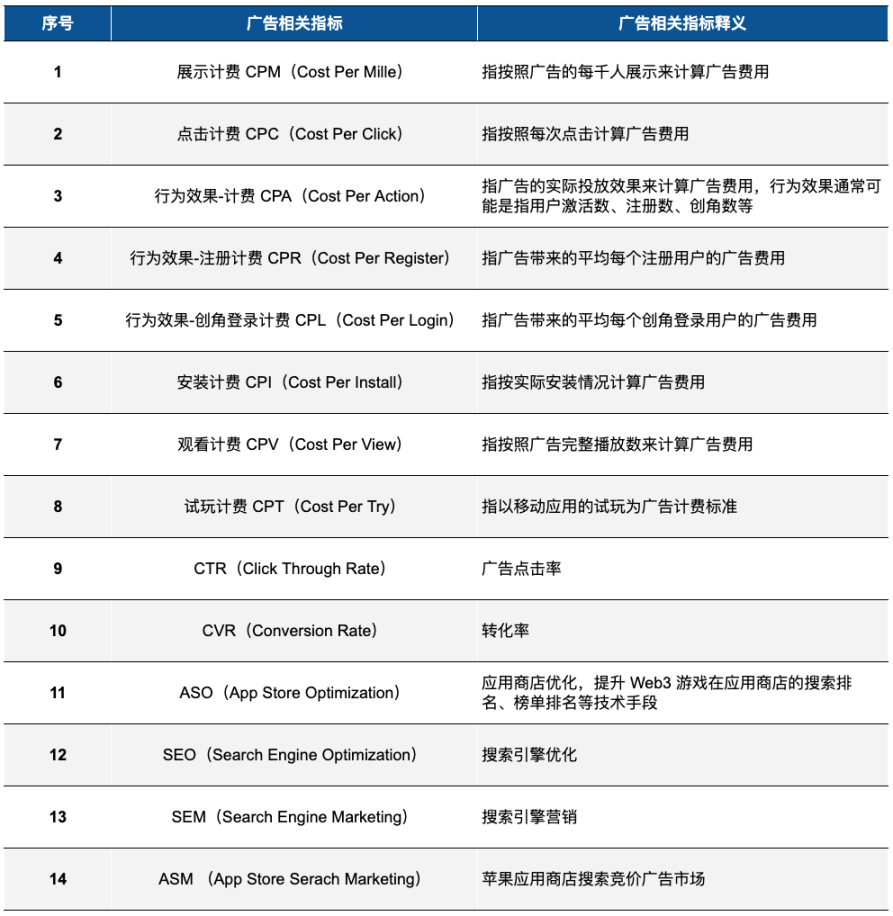
However, it is worth noting that due to the diversity of game types, advertising mechanisms cannot be generalized. Advertising is not an exclusive weapon for monetizing light games; mid-core and hardcore games can also achieve ad monetization. However, caution should be exercised in the advertising setup mechanism; mid-core and hardcore Web3 game developers should avoid pursuing short-term, minimal profits while also avoiding the inclusion of highly disruptive ads in mid-core games. Developers should focus on long-term revenue and user experience, conducting multiple A/B tests to provide benefits and conveniences to players while incentivizing players with weaker in-app purchase intentions to watch ads for rewards, thereby enhancing game stickiness and retention, and generating revenue for the game. Some evaluative metrics for Web3 game advertising can refer to the following table:
Source: Public market information
The business model of Web3 games includes various methods such as one-time paid downloads, advertising, and in-app purchases. For the above commercialization models, Web3 games can adopt not just one but a mixed monetization model, such as a "in-app purchase + advertising" commercialization path. Different types of games can adopt different models; for example, casual light games are more suited to a monetization path primarily based on advertising, supplemented by in-app purchases. For mid-core and hardcore Web3 games, diversified commercialization paths require further expansion in levels, dungeons, and other aspects. Currently, there are few advertising entry points within Web3 games, and the advertising scenarios are deep, leading to low per capita ad displays and a single advertising platform, which is significantly affected by fluctuations in single-platform advertising budgets. Therefore, it is necessary to reasonably plan game advertising entry points, allowing Web3 players to actively trigger ad displays based on game progress, aiming to increase advertising revenue while enhancing user experience, increasing user stickiness, and even feeding back into in-app purchases. In terms of advertising revenue share, heavy strategy games account for 0%, mid-core strategy games and simulation games typically account for 10-15%; gambling games can reach up to 50%, card and board games usually account for 25-30%, and casual games typically exceed 50%. Of course, the mixed monetization business model requires support from the platform's ability to provide detailed user demographic tags, and it also needs to integrate product gameplay, development, and content scenarios. This integration is not simply changing payment points to incentivized videos or replacing incentivized video ad slots with payment points; it must be combined with in-depth gameplay. Currently, mid-core products are more suitable. Regardless of whether it is the lightweight development of mid-core projects or the mid-core gameplay of ultra-casual projects, the goal still revolves around game value growth content and operational ideas based on low CPI.
Source: Public market information
LTV is very important for light games primarily monetized through advertising and heavy games primarily monetized through in-app purchases. When acquiring users, LTV generally determines the ceiling for user acquisition pricing, i.e., LTV = IAP. If considering LTV revenue, i.e., LTV = in-app purchases + advertising monetization, it will raise the bidding limit during user acquisition. LTV determines the scale of the product. Therefore, when investing in user acquisition, it is necessary to consider the degree of functionality openness of the advertising platform itself, especially for heavy game publishers who are concerned about the appearance of competing ads within the game, which need to be resolved through platform-side functionalities. The LTV (in-app purchases + advertising) fluctuations in mainstream countries are significant; the average for heavy game players can reach $20, while well-performing gambling games can reach $10; poorly performing games may even generate no revenue at all. When considering advertising alone, the minimum is only $0.1, while the maximum can reach $1.5. In terms of paid in-app purchases, heavy strategy games average $500, gambling games typically range from $200 to $300, and match-3 casual games can reach up to $150, but usually fall between $50 and $100.
Web3 games have different investment methods at different stages. Additionally, the promotion and investment of Web3 games are not solely reliant on advertising or video channels to generate downloads; Web3 game operations and testing also need to understand the game's stage and test relevant data, such as testing CPI, testing gameplay, and testing recovery, etc. Influenced by factors such as language, culture, and gaming preferences, Web3 games need to consider regional differences when investing and promoting, thus requiring the formulation of different regional investment strategies, material strategies, and advertising investment strategies. When formulating advertising investment strategies, it is essential to consider factors such as channels, advertising structure, budget, and advertising investment rhythm to better reach and convert users. After the game is launched, if there is no paid promotion, the data performance relies more on the game's own IP, gameplay, and previous promotional efforts. Commonly used market behavior analysis metrics can refer to the following table:
Source: Public market information
Different types of games and Web3 game project parties use different metrics. Taking casual games as an example, common data dimensions include development cycle, product lifecycle, player online duration, and LTV to make comprehensive judgments. Generally, the development cycle of a game exceeds six months. However, for ultra-casual games, the cycle from development to launch usually does not exceed three months. Some ultra-casual games adopt a "release and improve" strategy to capture trends and avoid plagiarism, pushing unfinished works to the top of the rankings and gradually optimizing and refining them afterward. For mid-core and hardcore games, the connections and interactions between users are very important, and the relationships of cooperation and competition will affect the immersion of Web3 game players.
Market Investment and Testing
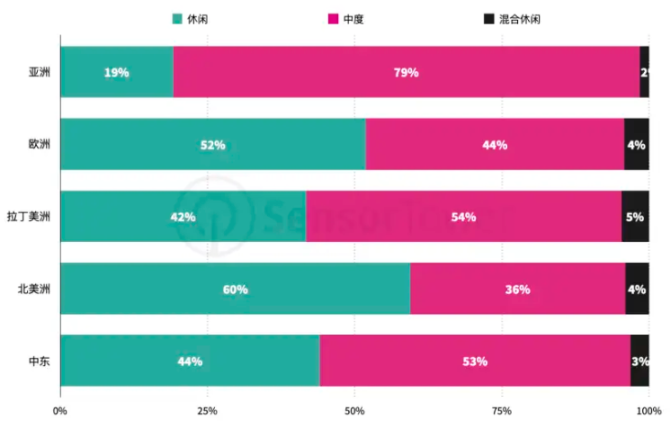
According to statistics from Sensor Tower, mobile game players in Europe and North America show a preference for casual games, while in the Asian market, mid-core games account for 79% of spending. In the Middle East and Latin America, mid-core games account for about 53% of total spending, providing growth opportunities for Web3 mid-core games.
Source: Public market information
Before investing in leading countries, product completeness is crucial; otherwise, testing a semi-finished product in leading countries will leave a negative impression on advertising platforms and Web3 game consumers, increasing the difficulty and cost of later promotions. Even if it is necessary to test data from semi-finished Web3 game products, it is advisable to prioritize countries and regions with large populations, low user acquisition costs, and low quality requirements for games, such as Thailand, Brazil, and Indonesia. If uncertain about regional choices, websites like App Growing can be used to reference similar competing products' investments, as their data can provide some reference and guidance for investment regions and channels. It is important to note that factors such as content depth, quality, and the completeness of the game product will all affect the effectiveness of investment and user acquisition. Different stages of product testing have different goals and focuses. For testing and operations at different stages, the following goals can be referenced:
- Early testing: CPI testing and art style testing. In the early stages of game development, it is necessary to promote the subsequent development of the game based on a reasonable range of CPI. For ultra-casual games, due to factors such as relatively simple gameplay, low user LTV, and limited ROI reserve space, testing CPI is even more critical to drive subsequent development and commercialization;
- Mid-term testing: Level testing, user data testing, and monetization testing. As the game enters the mid-term stage, some levels and mechanisms have gradually been improved and formed, so more consumer-level users need to join the game. The game's operations and testing personnel can more conveniently observe user data performance and recovery within the game, providing more data support for subsequent adjustments to game design and monetization design;
- Late testing: Financial aspects such as ROI. By the late stage, the game is basically developed, and the game's investment recovery model has matured. Therefore, Web3 game operations need to scale up user acquisition to generate profits.
When selecting material for investment, reference can be made to similar popular materials to plan the direction and content of the investment, which should also be influenced by regional culture, gaming preferences, religious beliefs, and other factors. The materials need to be localized to cater to regional preferences, thereby better promoting the localization process of the game. When selecting and iterating materials, regardless of the advertising platform, the materials used for investment have a certain lifecycle, so it is necessary to continuously iterate the content of the materials. Based on the estimated time cycle, periodically output materials to maintain the heat and discussion around the Web3 game; at the same time, materials related to trending content will decline quickly, with click-through rates and conversion rates dropping rapidly, so it is necessary to accelerate material iteration and supplement new materials for trending content. In terms of channels, suitable material investments should be selected based on channel characteristics; for example, TikTok is a content-oriented platform, thus requiring high content and quality standards for materials; Meta has high social attributes, necessitating the selection of shareable materials; while Google’s advertising investment is relatively stable, with lower click costs, allowing for rapid brand awareness expansion. Below are commonly used channels for investment and user acquisition, such as Meta, Google Ads, TikTok, Search Ads, Snapchat, X (Twitter), and others:

Source: Public market information
When selecting target countries for advertising and user acquisition, the advertising and operations personnel can refer to user preferences and investment cost information from the channels. Since users in different regions have different preferences and the users reached by channels vary, caution is needed in choosing advertising channels for target countries in game launches. Some channels have user acquisition costs reaching $10 (for SLG-type games), with a minimum of $2 (for casual games). By statistically analyzing the behavior of acquired users, the lifetime value (LTV) per user can be calculated. If the user acquisition cost (CPI) is higher than the LTV, the game is profitable at the time of calculation. If the retention rate, recovery cost, and user acquisition cost during the testing period remain stable, and the ROI value continues to be above 1 (note that the impact of app store commissions on expenses and income must also be considered), then user acquisition can be scaled. However, if the revenue generated by users is insufficient to cover user acquisition expenses, the game and user acquisition strategy need to be optimized until the ROI turns positive. For a Web3 mobile game with above-average performance (i.e., day 1, day 7, and month retention rates reaching 40%, 20%, and 10% respectively), the user acquisition return rate in the first week is 12%. For mobile games with lower retention rates, the return rate in the first week needs to be close to 20% to break even. (It is important to note that Web3 game project parties issuing tokens or NFT-type on-chain assets arbitrarily due to lack of funds is akin to drinking poison to quench thirst, ultimately leading to credit bankruptcy.)
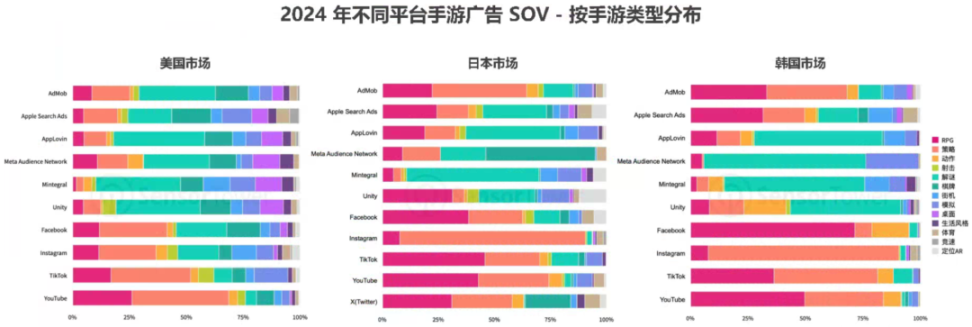
The following is the advertising situation in three representative countries: the United States, Japan, and South Korea. In the mobile game markets of the United States, Japan, and South Korea, light casual games such as puzzle and board games prefer advertising platforms like AppLovin, Mintegral, and Meta Audience Network. In contrast, mid-core and hardcore mobile games such as RPGs and strategy games favor platforms like YouTube, TikTok, and Meta. In the Japanese and South Korean mobile game markets, the share of voice (SOV) for mid-core mobile game ads is significantly higher than that for casual mobile games. In the Japanese market, the combined SOV for strategy and RPG mobile games on YouTube and Instagram reaches 74% and 90%, respectively. In the South Korean market, the SOV for RPG mobile games on Facebook is close to 72%, while the SOV for strategy mobile games on Instagram reaches as high as 80%. It is important to note that for Web3 users, relying solely on X (formerly Twitter) or collaborating with Web3 KOLs for promotion will significantly limit the reach of users, and there can be considerable differences in user profiles between some Web3 users and consumer-level users.
Source: Sensor Tower
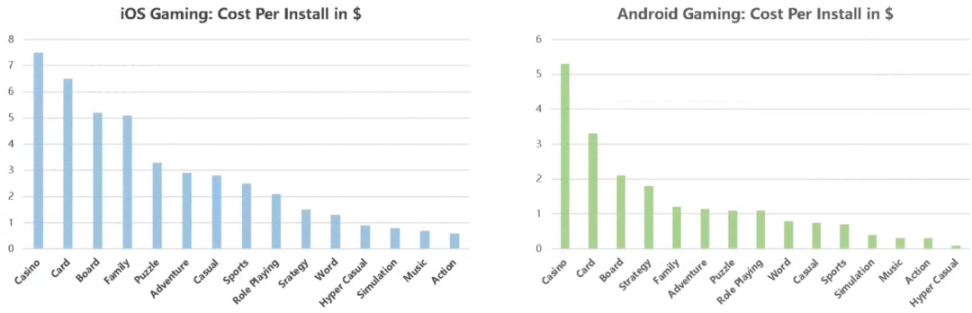
The costs of user acquisition and advertising differ across various channels, and the costs of advertising and conversion for different game categories on the same channel also vary. The following chart shows the average cost per installation for different types of games. As of Q2 2024, global average CPI for Android mobile games is $0.73, an increase of $0.12 month-on-month; the average click-through rate is 3.23%, a year-on-year decrease of 0.58 percentage points; the global average IPM is 3.54, a month-on-month decrease of 1.55; the global average CPI for iOS platforms is $2.74, an increase of $0.51 month-on-month; the global average click-through rate is 4.08%, and the global average IPM is 0.8. According to Branchmetrics statistics, the conversion rate from click to installation on the iOS platform is 11.9%, while on the Android platform it is 13.5%, with the U.S. region having an even lower rate of only 6%.
Source: AppsFlyer
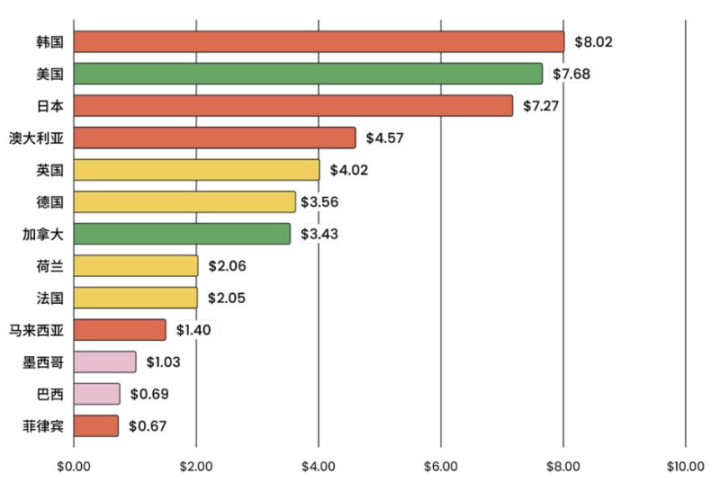
At the same time, as of Q2 2024, the North American market is more competitive, with user acquisition costs for Android and iOS being 12 times and 7 times that of Latin America, respectively. By specific market, the top three regions with the highest user acquisition costs are South Korea, the United States, and Japan, while the lowest are Mexico, Brazil, and the Philippines, with the highest user acquisition costs differing by 12 times. Although the ROI for different games varies greatly, overall, the 7-day advertising investment return rate is higher in the European, Middle Eastern, and African markets, while the North American market has a lower return rate.
Comparison of Average CPI for Mobile Games in Different Regions
Source: Public market information
Comparison of Average CPI for Mobile Games in Different Countries
Source: Public market information
Driven by the influence of Telegram and the Ton ecosystem in social aspects, casual Web3 games are closely linked with Telegram, especially through mini-programs (TMA) or H5 pages to simplify the process of game participation and improve conversion efficiency. Users can start their applications from keyboard buttons, inline buttons, bot menu buttons, inline mode, direct links—even from attachment menus, significantly lowering the user entry barrier. Therefore, some Web3 game project parties actively invest in user acquisition and advertising on Telegram and build an ecosystem belonging to Telegram.
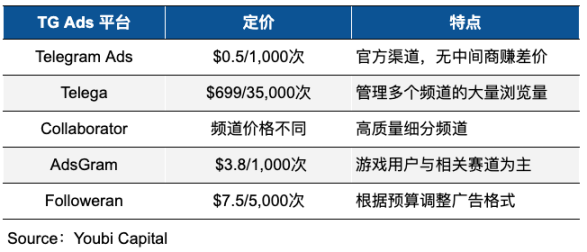
Due to the influence of channels and suppliers, the user acquisition, click-through rate, and conversion rate for project parties vary. According to statistics, the average cost per user currently ranges from $0.02 to $0.1, and specific details such as content, advertising time, advertising channels (channels), feeding time, and user click limits are adjusted based on the budget of Web3 game project parties. In cases of bot and witch attacks, the click conversion rate through Telegram's built-in task redirection is about 30-70%, with weekly retention around 50-85%. Excellent channels can achieve monthly retention rates of 60-75%. The following table compares the pricing and characteristics of advertising on Telegram:
Source: Youbi Capital
Taking Telega as an example, suitable channels for advertising and user acquisition can be filtered based on channel size, views, pricing, click-through rates, and other data. Specific horizontal comparison information can refer to the analysis section of Telegram Analytics. Web3 game project parties can choose suitable channels for advertising based on channel characteristics and view data. The following diagram is a reference illustration for channel analysis by Telega:
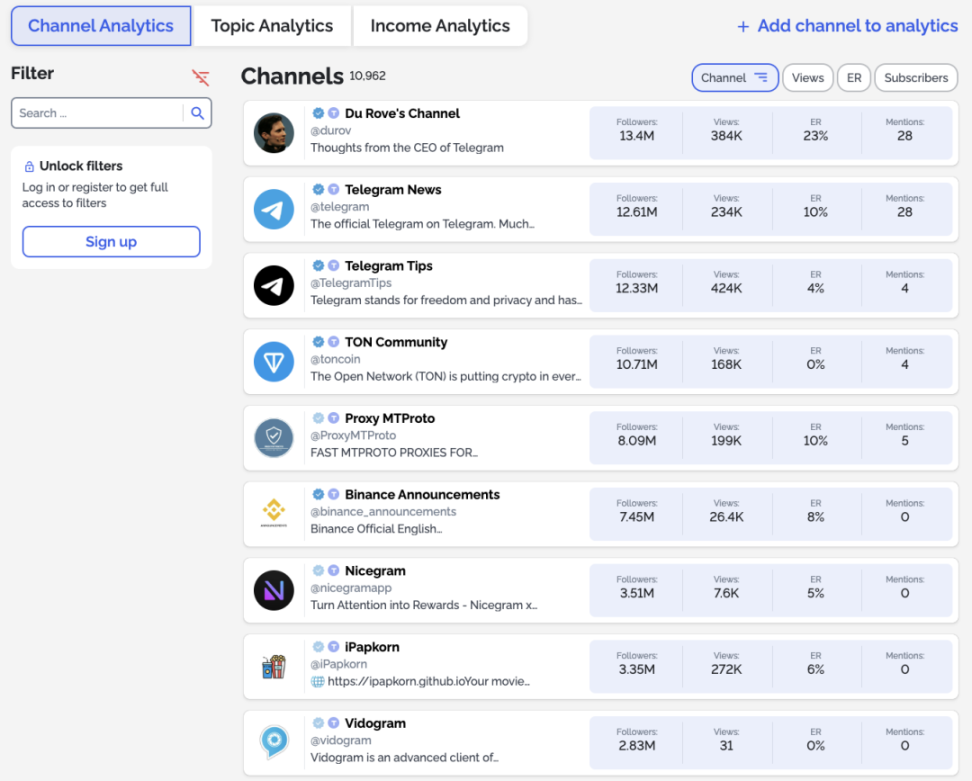
Source: Telega
Generally, after user acquisition advertising is launched, A/B testing or formal launch, commonly used analysis and evaluation data metrics include revenue (first-day revenue, first-month revenue), retention (day 1 retention, day 3 retention, day 7 retention), and user activity (daily active users, monthly active users, etc.). For user feedback, common metrics include rankings and ratings, which need to evaluate and analyze the ranking situation on iOS and Google stores (free and best-seller lists). Additionally, game rating websites, forums, game communities, and public comments from player users can all serve as reference metrics for evaluation and analysis. Based on user feedback, subsequent core mechanisms and gameplay can be further adjusted to better acquire users and monetize. Based on the above user data and revenue situation, the game's investment recovery model can be calculated and adjusted to determine and modify future game planning and direction. (At the same time, refer to the first part of this series: Tokens and Economic Systems)
免责声明:本文章仅代表作者个人观点,不代表本平台的立场和观点。本文章仅供信息分享,不构成对任何人的任何投资建议。用户与作者之间的任何争议,与本平台无关。如网页中刊载的文章或图片涉及侵权,请提供相关的权利证明和身份证明发送邮件到support@aicoin.com,本平台相关工作人员将会进行核查。


