Recently, with the global geopolitical situation becoming tense, especially with the upcoming U.S. presidential election, various investors have begun to seek safe-haven assets to combat economic uncertainty. Bitcoin and gold are the main beneficiaries, as they are seen as assets against the depreciation of the dollar and are considered to have "store of value" characteristics.
Last night around 21:30, Bitcoin quickly surged to nearly $68,000. However, due to setbacks in the U.S. stock market opening or profit-taking by investors, a large amount of selling pressure emerged, causing Bitcoin's price to plummet over $3,000 within an hour, reaching a low of $64,781. Just when investors thought the downward trend was beginning, Bitcoin reversed sharply back to $67,000. The "N" shaped price fluctuation led to a double kill for both bulls and bears. As of the time of writing, Bitcoin is quoted at $67,751, up about 2.01% in the last 24 hours.
Bitcoin 4-Hour Chart
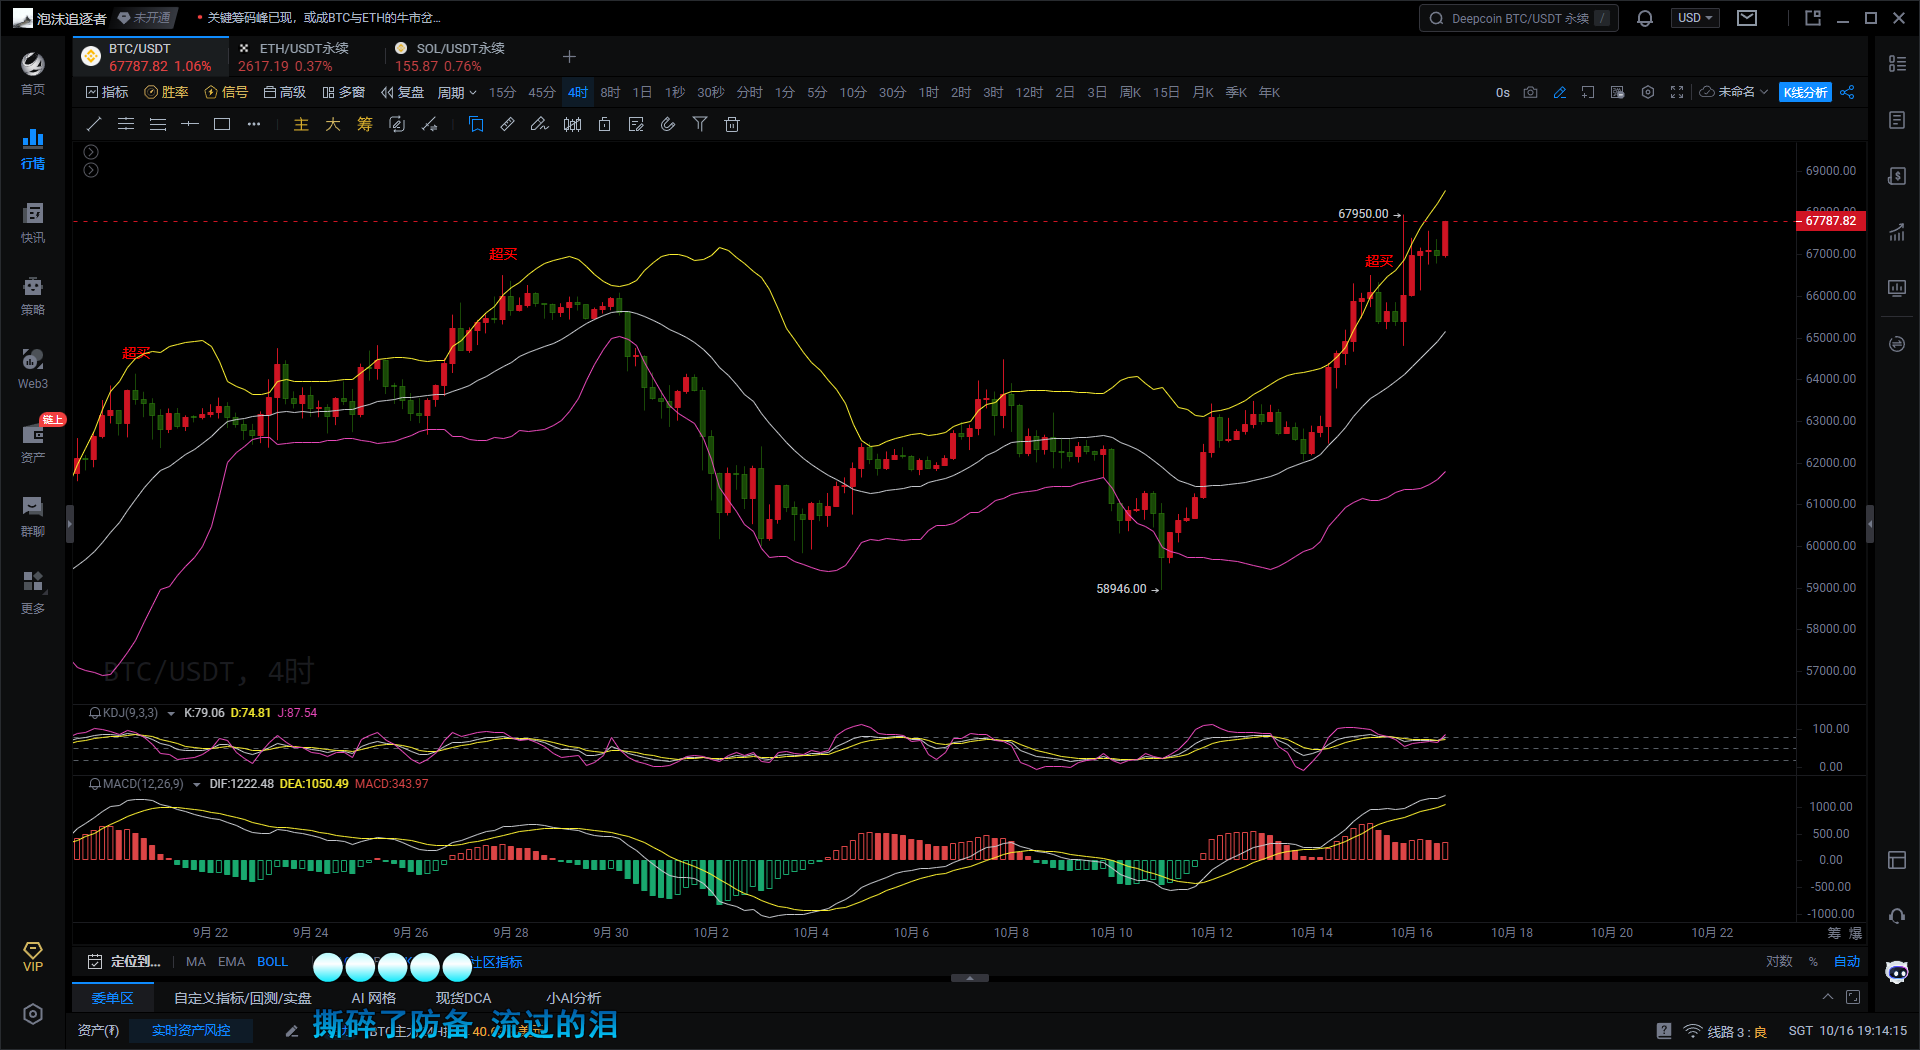
First, according to the Bollinger Bands indicator on the 4H Bitcoin chart, the current price is operating near the upper band, indicating that the market is in a strong upward trend but also in an overbought position, necessitating caution for a potential pullback in the short term. The Bollinger Bands are in an opening state, suggesting that subsequent volatility will be relatively strong.
Second, based on the KDJ indicator on the 4H Bitcoin chart, both the K and D line values are in the overbought area, with the J line value severely in the overbought region. As the market is in an overbought state, there may be a risk of a technical pullback in Bitcoin's price in the short term.
Finally, according to the MACD indicator on the 4H Bitcoin chart, the DIF line is clearly above the DEA line and is also running above the 0 axis, indicating that bullish forces still dominate. The MACD histogram is also red, further confirming that the market is in a bullish trend.
Bitcoin 1-Hour Chart
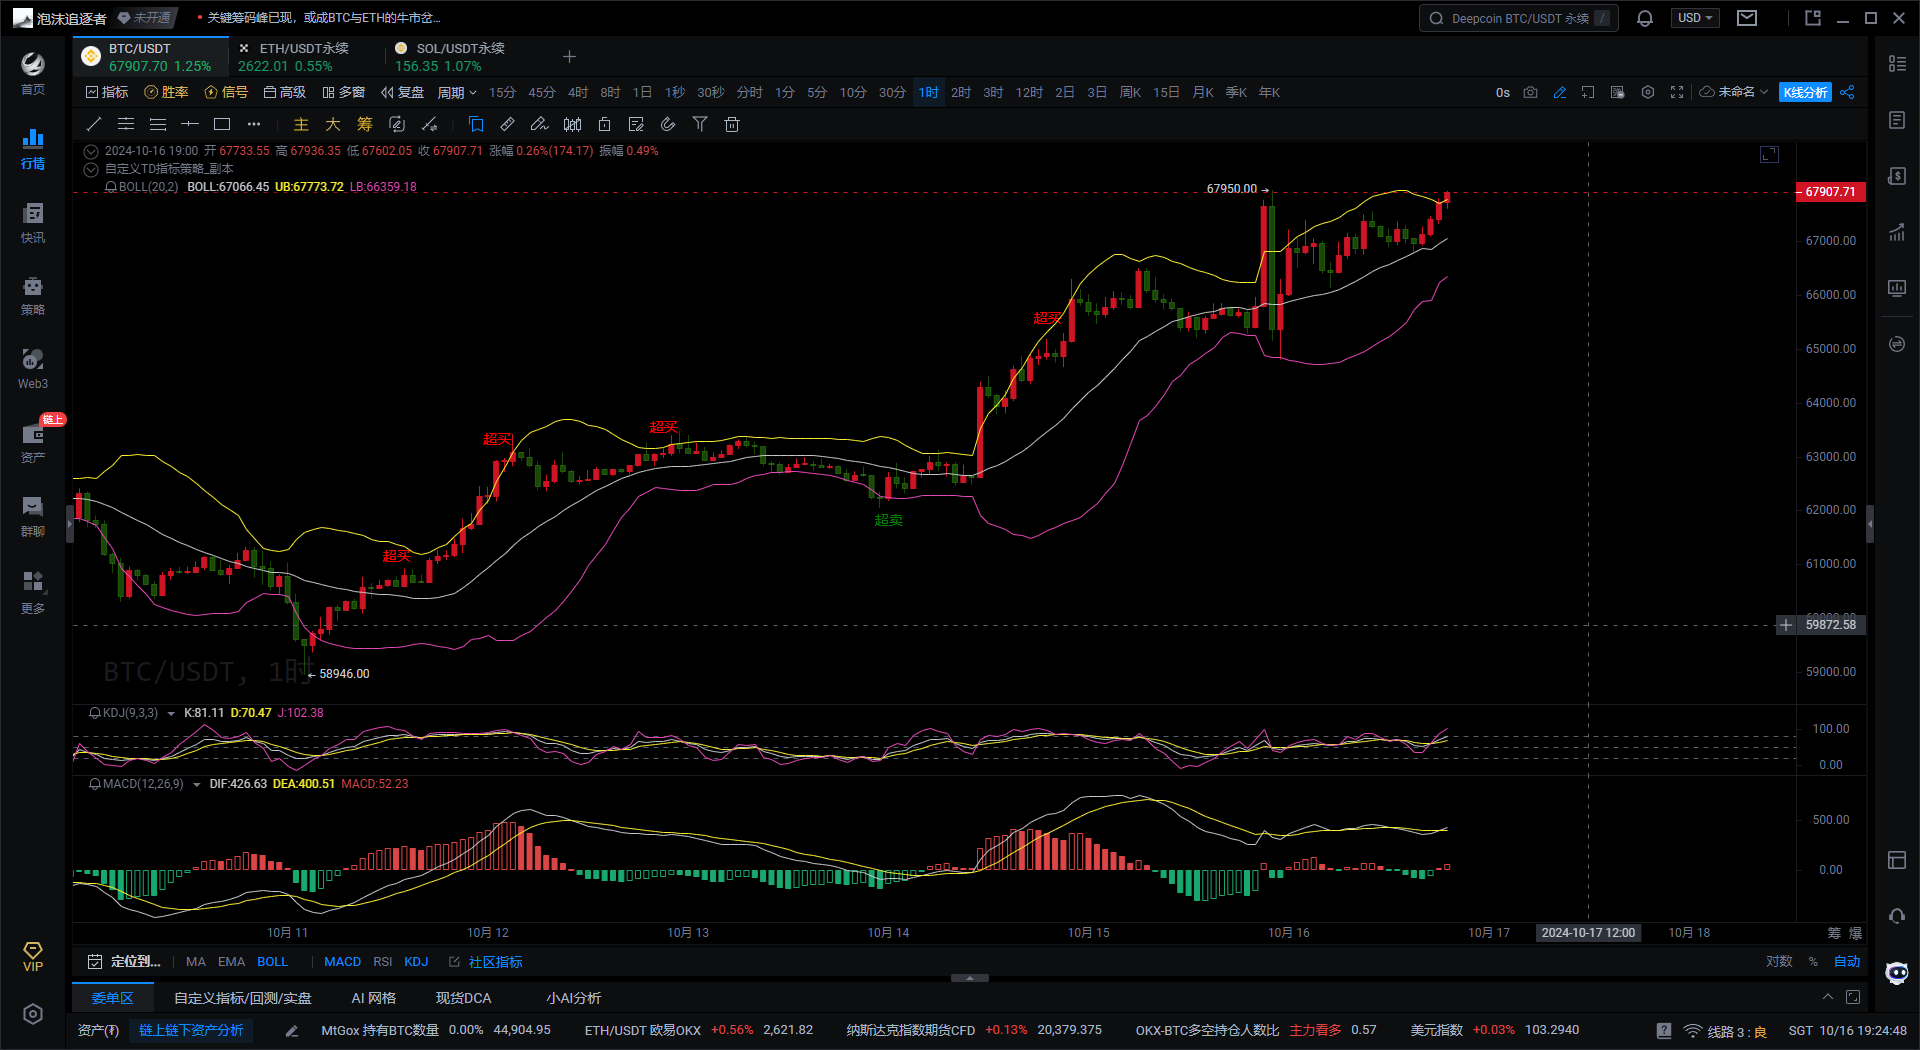
First, according to the Bollinger Bands indicator on the 1H Bitcoin chart, the current Bitcoin price is operating near the upper band, showing a strong upward trend in the short term. The continuous upward expansion of the upper band reflects strong market momentum. However, as the price approaches the upper band, it also means that there may be overbought pressure in the market, with risks of a pullback or consolidation in the short term.
Second, based on the KDJ indicator on the 1H Bitcoin chart, both the K and D line values are above 80, while the J line value is at 100, indicating that Bitcoin's price is in an overbought state. There may be pressure for a pullback in the market in the short term. If the KDJ three-line values turn downward, it will further confirm the pullback signal.
Finally, according to the MACD indicator on the 1H Bitcoin chart, the DIF line is above the DEA line, and the MACD red histogram is also red, indicating that the market is in a bullish trend, with upward momentum still continuing. However, the MACD red histogram has started to gradually shorten, indicating that the upward momentum is about to weaken. Attention should be paid to whether the DIF line can cross below the DEA line to form a death cross; if a death cross forms, the price will likely decline in the short term.
Comprehensive analysis shows that according to the 4H Bitcoin chart, the upper Bollinger Band is still expanding, indicating that there is still some upward space in the market, but the KDJ is currently in the overbought area, with a possibility of a pullback in the short term. According to the 1H Bitcoin chart, the Bollinger Bands show strong upward momentum in the market, but both KDJ and MACD indicate signals of overbought and weakening upward momentum. In the short term, attention should be paid to whether MACD and KDJ will turn downward to form a death cross to confirm the depth of the pullback.
In summary, the following suggestions are provided for reference:
Buy Bitcoin on a pullback to $66,800-$67,000, targeting $68,000-$68,500, with a stop loss at $66,400.
Giving you a 100% accurate suggestion is not as good as providing you with the right mindset and trend. After all, teaching someone to fish is better than giving them fish. The suggestion is to earn for a moment, but learning the mindset will earn for a lifetime! What matters is the mindset, grasping the trend, and planning the market layout and position. What I can do is use my practical experience to help everyone, guiding your investment decisions and management in the right direction.
Writing time: (2024-10-16, 19:00)

(Written by - Master Coin) Disclaimer: Online publication has delays, and the above suggestions are for reference only. The author is dedicated to research and analysis in the fields of Bitcoin, Ethereum, altcoins, forex, stocks, etc., having been involved in the financial market for many years and possessing rich practical operation experience. Investment carries risks; proceed with caution. For more real-time market analysis, please follow the official account Master Coin for discussion and exchange.
免责声明:本文章仅代表作者个人观点,不代表本平台的立场和观点。本文章仅供信息分享,不构成对任何人的任何投资建议。用户与作者之间的任何争议,与本平台无关。如网页中刊载的文章或图片涉及侵权,请提供相关的权利证明和身份证明发送邮件到support@aicoin.com,本平台相关工作人员将会进行核查。


