Increased Volatility! Is This Surge Inevitable?
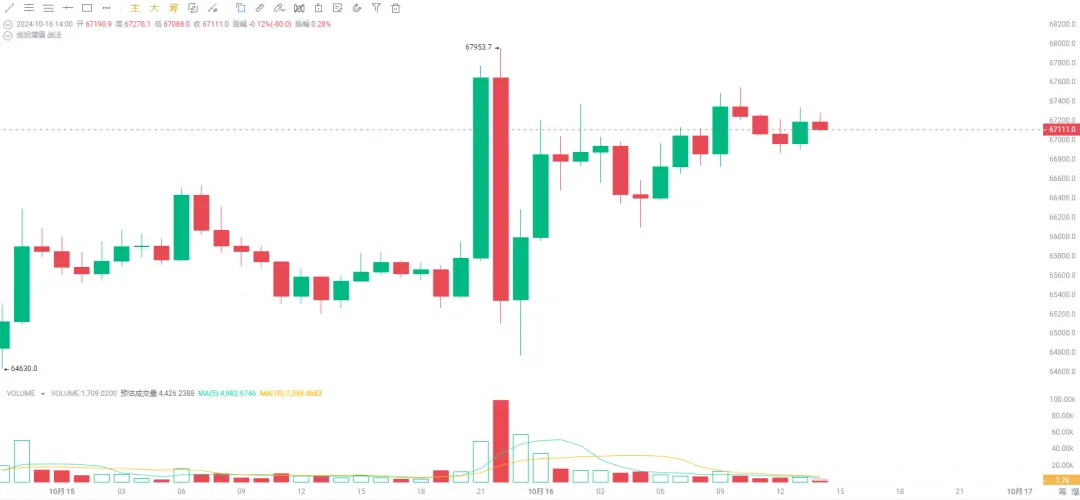
Recently, volatility has intensified. Last night (15th) around 21:30, the price quickly surged to nearly $68,000, but whether it was due to the U.S. stock market starting to plunge or investors taking profits is unclear. A significant sell-off led to BTC plummeting over $3,000 in just one hour, hitting a low of $64,781.
However, just when investors thought the downturn was beginning, Bitcoin reversed sharply back to $67,000. The price fluctuations in this "N-shaped grand rally" can be described as a double whammy for both bulls and bears! As of the time of writing, it is reported at $67,111, up 2.4% in the last 24 hours.
All Major Data Indicators Are Bullish!
1. Bitcoin Open Interest Reaches All-Time High
The weighted perpetual futures funding rate for Bitcoin open interest (OI) has reached its highest point in months, indicating that bullish sentiment in the market may persist in the short term.
According to CoinGlass data, the current weighted funding rate for Bitcoin open interest is 0.0136%, a level last seen on June 7, when Bitcoin briefly reached $71,950. A positive funding rate typically reflects bullish market sentiment, but given the volatility of the crypto market, these data should be interpreted with caution.

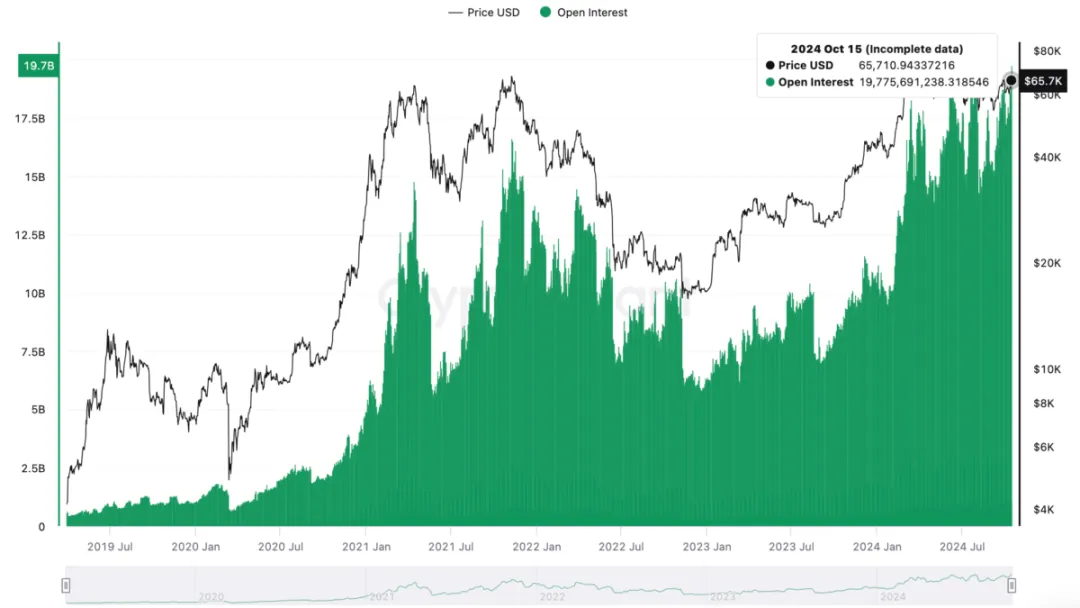
Data from CryptoQuant shows that as of October 15, the total open interest for Bitcoin reached an all-time high of $19.7 billion, indicating that with more capital flowing into the market, there may be more price fluctuations in the future.
2. Bitcoin Exchange Supply Continues to Decline
According to CryptoQuant data, the supply of Bitcoin on exchanges has significantly decreased, reaching near its lowest level in five years.
As of October 15, the amount of Bitcoin held by centralized cryptocurrency exchanges was approximately 2.68 million, down 20% from the historical high of 3.37 million in July 2021. This coincides with Bitcoin's price increase of 55% year-to-date.
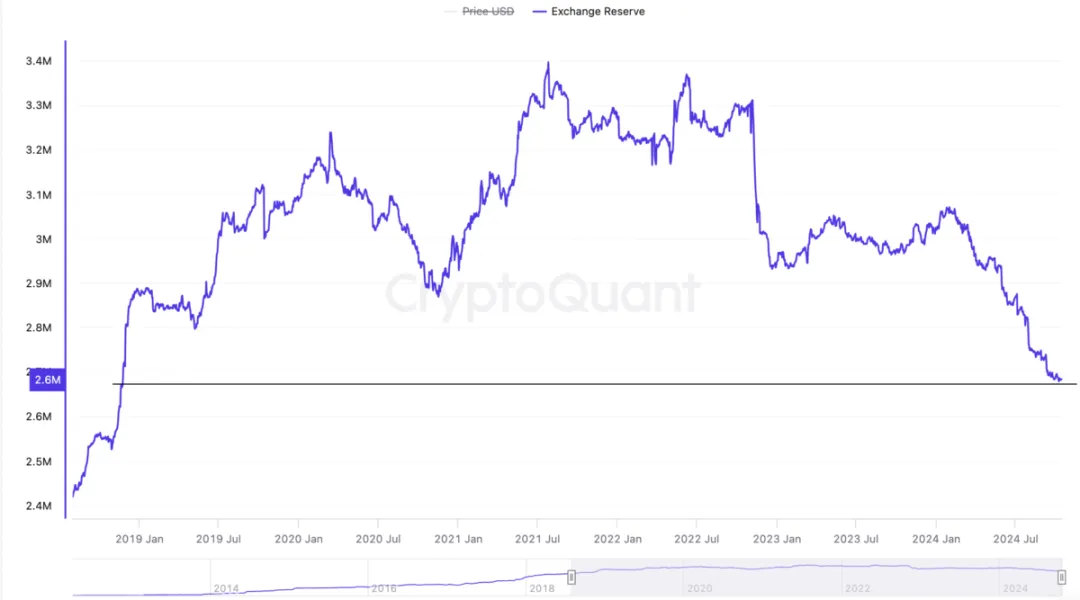
The decrease in exchange supply indicates that traders are more inclined to hold Bitcoin rather than sell it for fiat currency or other digital assets. This also enhances Bitcoin's potential to continue its bull market into 2024.
3. Rising Demand for Spot Bitcoin ETFs
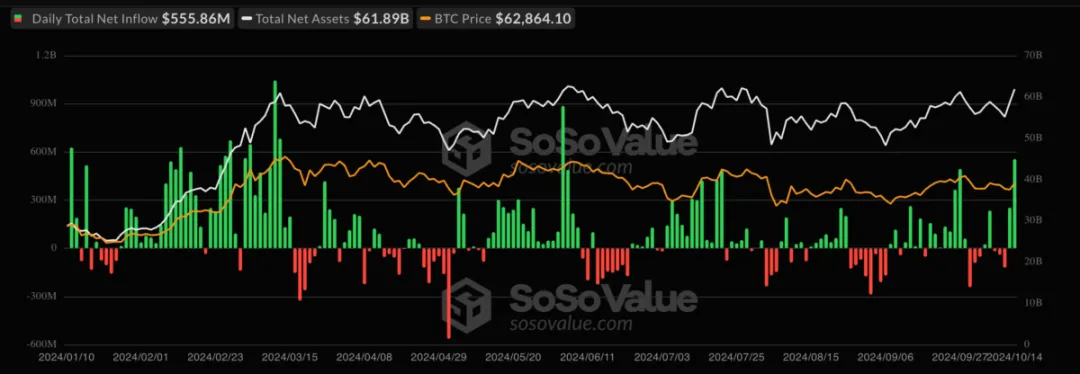
Demand from institutional investors continues to drive Bitcoin prices as they consistently invest capital into Bitcoin spot ETFs. According to SoSoValue Investors data, U.S. Bitcoin spot ETFs recorded net inflows on four out of the last seven trading days, indicating that institutional interest in these investment products is still growing.
On October 14, these investment products achieved the highest single-day net inflow since June 4, with inflows exceeding $555.8 million.
"This reflects the ongoing adoption process by investment advisors and institutional investors."
4. Bitcoin Strongly Supported Above the 200-Day SMA
On October 14, Bitcoin's price broke through a key technical level, the 200-day simple moving average (SMA), currently at $63,335, which propelled a comprehensive market recovery.
Recent attempts to reclaim this level have not triggered a larger price uptrend. Notably, after Bitcoin's price broke the 200-day SMA three times in the past, it experienced parabolic rises. At the time of writing, Bitcoin's price has stabilized above this key technical support.
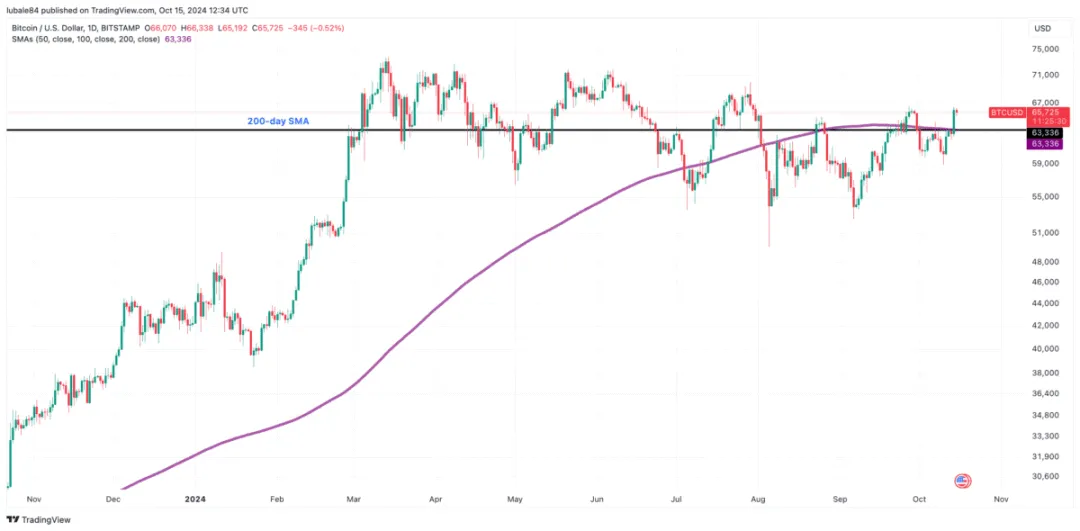
Data from IntoTheBlock shows that the 200-day SMA is within a demand range between $61,770 and $63,728, where approximately 2.5 million addresses purchased about 1.1 million BTC.

Charts also indicate that Bitcoin currently has strong support, while the resistance on its recovery path is relatively weak, suggesting minimal resistance on Bitcoin's upward trajectory.
This article is time-sensitive and for reference only; real-time updates are available.
Focusing on K-line technical research, sharing global investment opportunities via the public account: Crypto悟饭
免责声明:本文章仅代表作者个人观点,不代表本平台的立场和观点。本文章仅供信息分享,不构成对任何人的任何投资建议。用户与作者之间的任何争议,与本平台无关。如网页中刊载的文章或图片涉及侵权,请提供相关的权利证明和身份证明发送邮件到support@aicoin.com,本平台相关工作人员将会进行核查。


