Wishing my fans financial freedom in 2024, let's work hard together!
The current price of Bitcoin is 65900. It is now 10:30 AM Beijing time. Let's review: In yesterday's Monday article, I clearly mentioned that after the weekly candle closed bullish, there were signs of a trend reversal from bearish to bullish. The upper resistance level to watch is 63600; once it breaks, we can go long. Within 24 hours, it surged to a high of 66500, providing over 3000 points of opportunity. The one-sided market has formed a butterfly pattern, and this wave of the pattern has not yet completely played out; there will be another pullback before the next stretch.
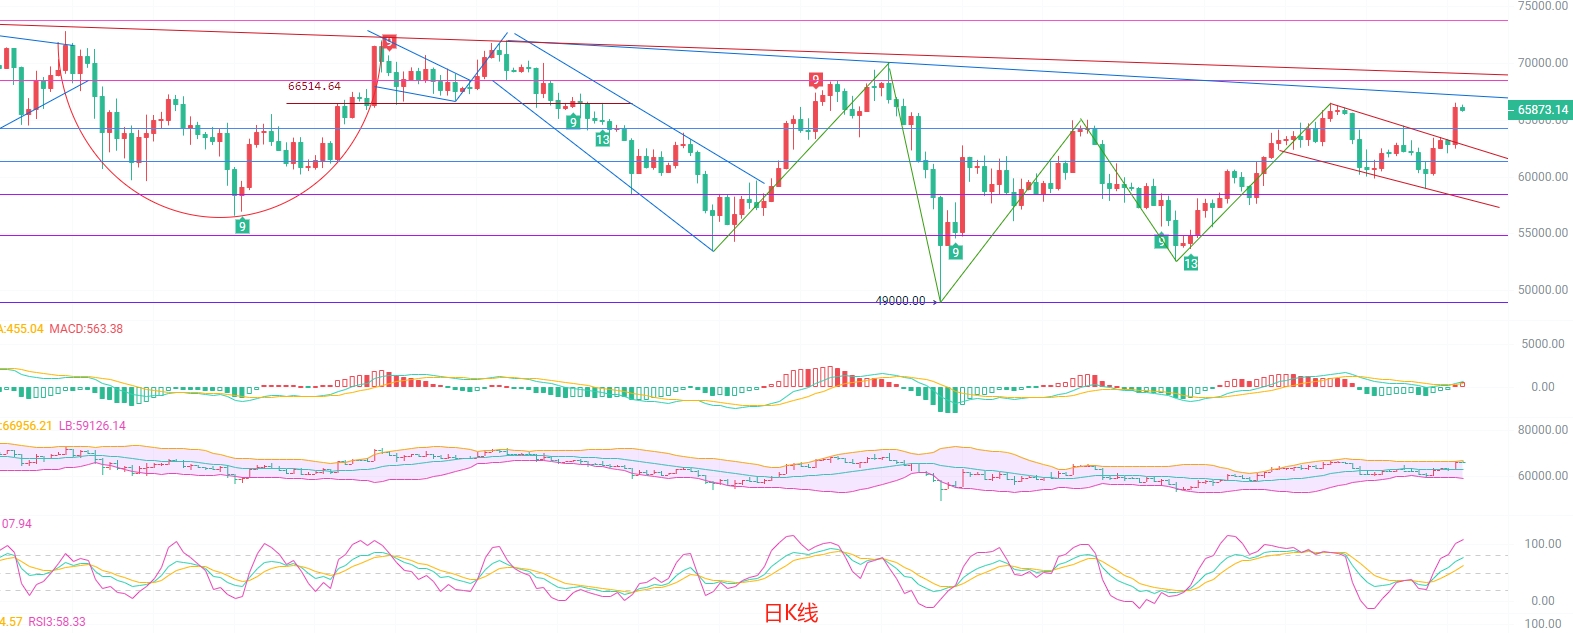
Looking at the daily chart, after opening, it broke below 66000 and started to pull back. The EMA trend indicator's support point is still accelerating upwards, with EMA15 at 63100. It is expected to stretch further before a clear support point can be established. After the MACD volume increases, the DIF and DEA formed a golden cross above the zero line. The upper resistance of the Bollinger Bands at 66900 is very strong; even if it breaks the resistance level in the short term, it won't go too far and will likely return below the upper band. Therefore, we can wait to set up a short position after breaking the resistance level.
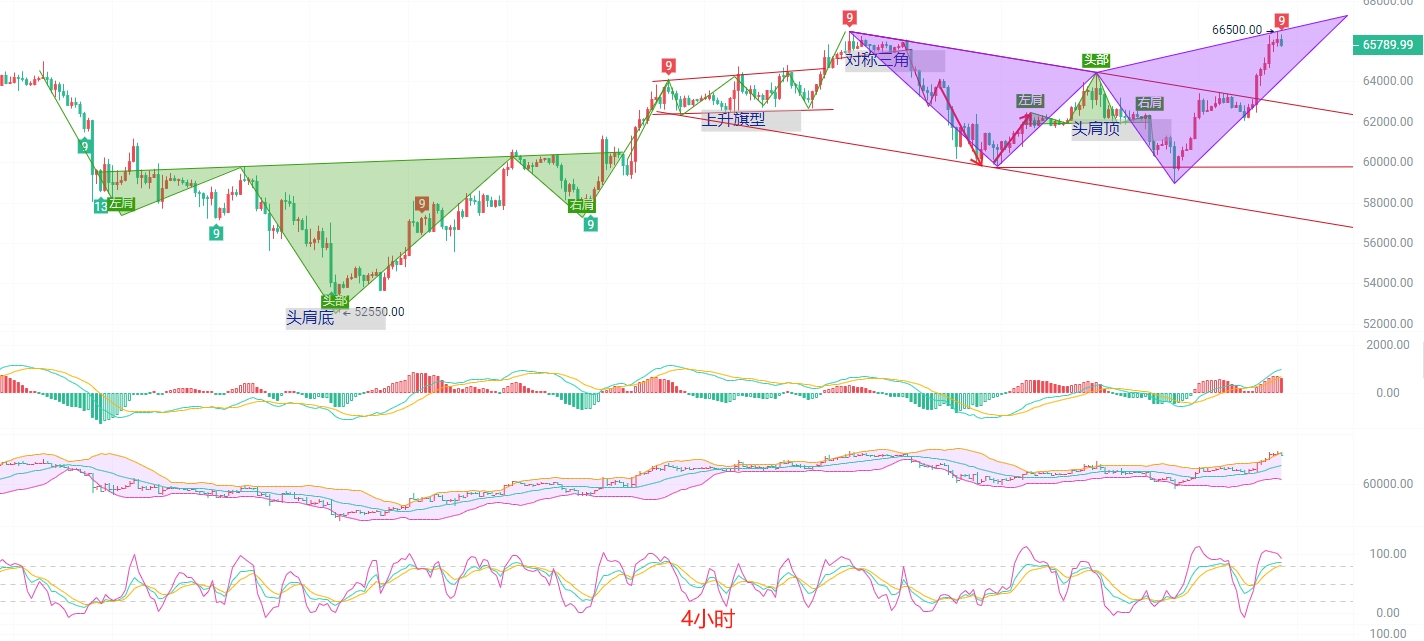
The four-hour K-line is currently holding the 66500 resistance level, showing a clear pullback trend. The EMA trend indicator's upward mesh alternation has ended, and now only the stretch remains. The EMA15 support point has reached 64300, which can serve as an entry point for long positions. The MACD volume is decreasing, and the DIF and DEA are starting to fall back after being blocked at high levels. A short-term bearish trend is emerging; it is advisable to observe. The K-line is crawling around the upper Bollinger Band at 66300 before starting to return to the Bollinger channel. The middle of the Bollinger Bands is at 63700. The KDJ is contracting downwards, and the short bearish trend is evident. Those who are steady should wait for a pullback to support to go long, while aggressive traders can short, aiming for a profit within 1000 points.
Short-term strategy reference: The market is never 100% certain, so always set stop-losses. Safety first; small losses and big gains are the goal.
Aggressive traders can short at the current price, targeting 65000 to 64500, with a stop-loss of 300 points.
For the upper range of 66900 to 67200, short with a stop-loss of 500 points, targeting 66300 to 65300, and if it breaks, look for 64500.
For the lower range of 64500 to 64000, go long, defending at 63600 to add to the position, with a stop-loss of 300 points, targeting 65500 to 66600, and if it breaks, look for 67000.
Specific operations should be based on real-time market data. For more information, you can consult the author. The article may have a delay in publication; it is recommended for reference only, and risks are to be borne by the reader.

Friendly reminder: The above content is solely created by the author of the public account. The advertisements at the end of the article and in the comments section are unrelated to the author. Please discern carefully. Thank you for reading.
免责声明:本文章仅代表作者个人观点,不代表本平台的立场和观点。本文章仅供信息分享,不构成对任何人的任何投资建议。用户与作者之间的任何争议,与本平台无关。如网页中刊载的文章或图片涉及侵权,请提供相关的权利证明和身份证明发送邮件到support@aicoin.com,本平台相关工作人员将会进行核查。


