Click the link to watch the video: https://www.bilibili.com/video/BV1ram5YNEMi/
Just this morning, Bitcoin has recovered and returned to the opening price of October. Many fans have been asking me how the subsequent trend will run. In today's video analysis, I will share my views on the market.
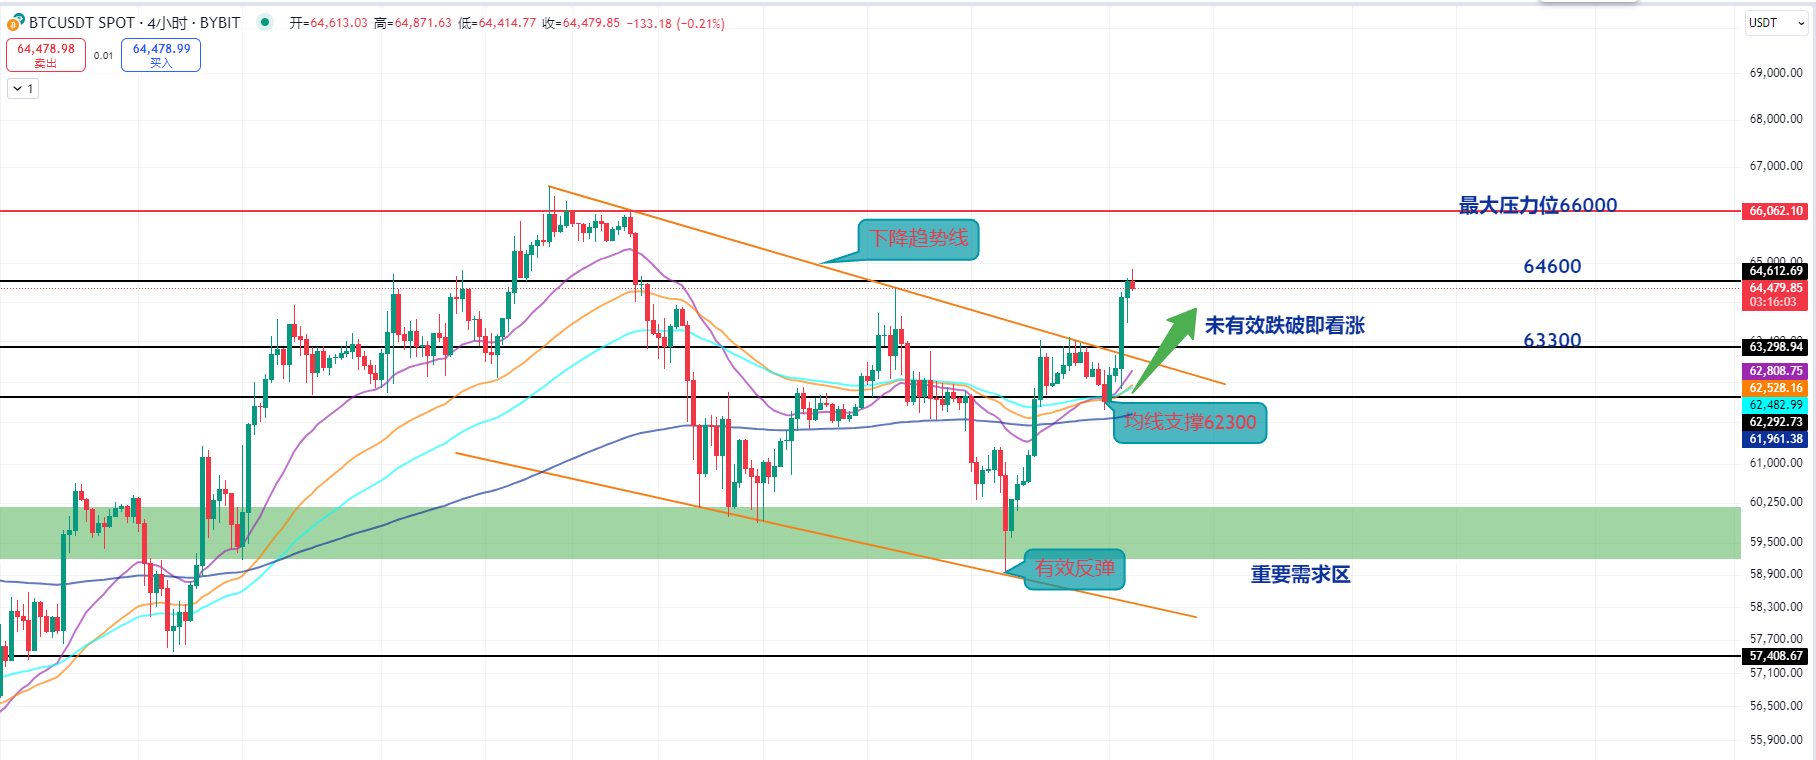
We can see the 4-hour chart of Bitcoin. The important demand zone below has not been broken, and there was a rapid effective rebound around last Friday. Currently, it has broken through our downward trend line. Additionally, the support of the moving averages is around the 62300 area.
At this point, it has been pulled back again. If it does not break down effectively after this pullback, it will basically be bullish, and it has also recovered to our October opening price.
Next, we just need to see if Bitcoin can maintain a range of around 63300 to 64600 for a consolidation run. If it can consolidate in this range and the moving averages gradually correct upwards,
as long as it does not break down, we will look to go long and take profits at the top. The upper pressure currently is around the 66000 area, which is our biggest resistance. If Bitcoin can successfully break through 66000, it will basically form a breakout of an upward trend.
So, we will focus on the range of 63300 to 64600 for the intraday market to see how it consolidates.
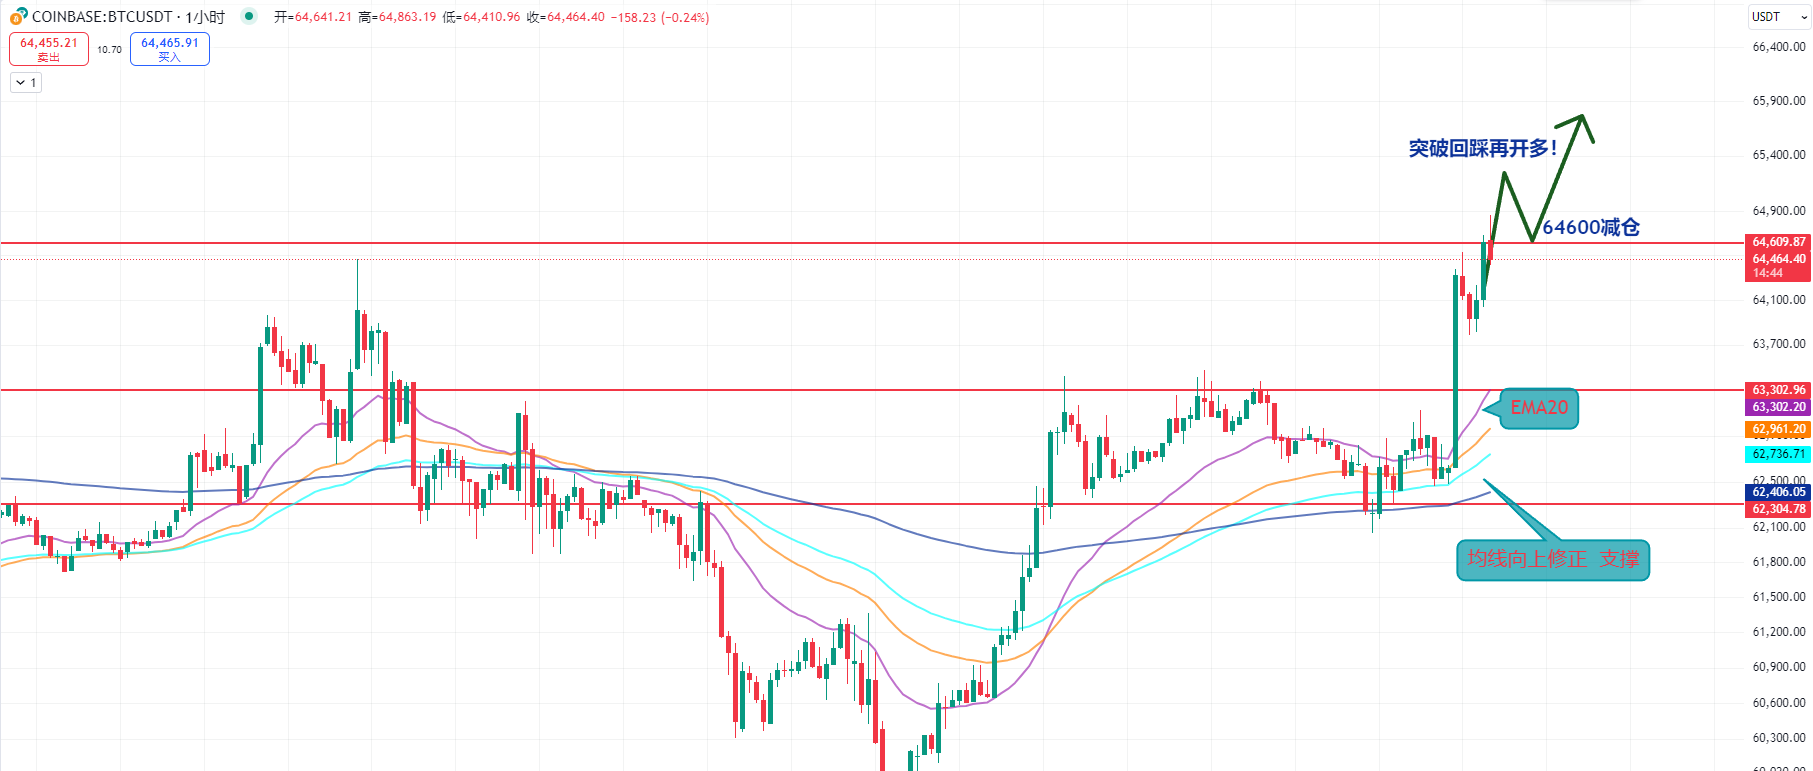
We can also switch to the 1-hour chart. We can see that our moving averages are effectively correcting upwards, which allows our moving averages to serve as support, while the upper pressure is at 64600.
At this point, we can take profits. If Bitcoin successfully breaks through 64600 and then retests, this 64600 will be another opportunity for us to go long.
So we can also pay attention to whether it effectively breaks through and retests during the day. This will also be a long opportunity for everyone on the right side. Currently, after the initial surge, it needs more consolidation, and during this consolidation, it is best not to fall back below the October opening price.
Otherwise, I believe this breakout may also indicate a false breakout. Therefore, we hope to consolidate at a high level here, with the moving averages correcting upwards. Next, we can focus on the EMA20 to reduce positions and take profits on our long positions.
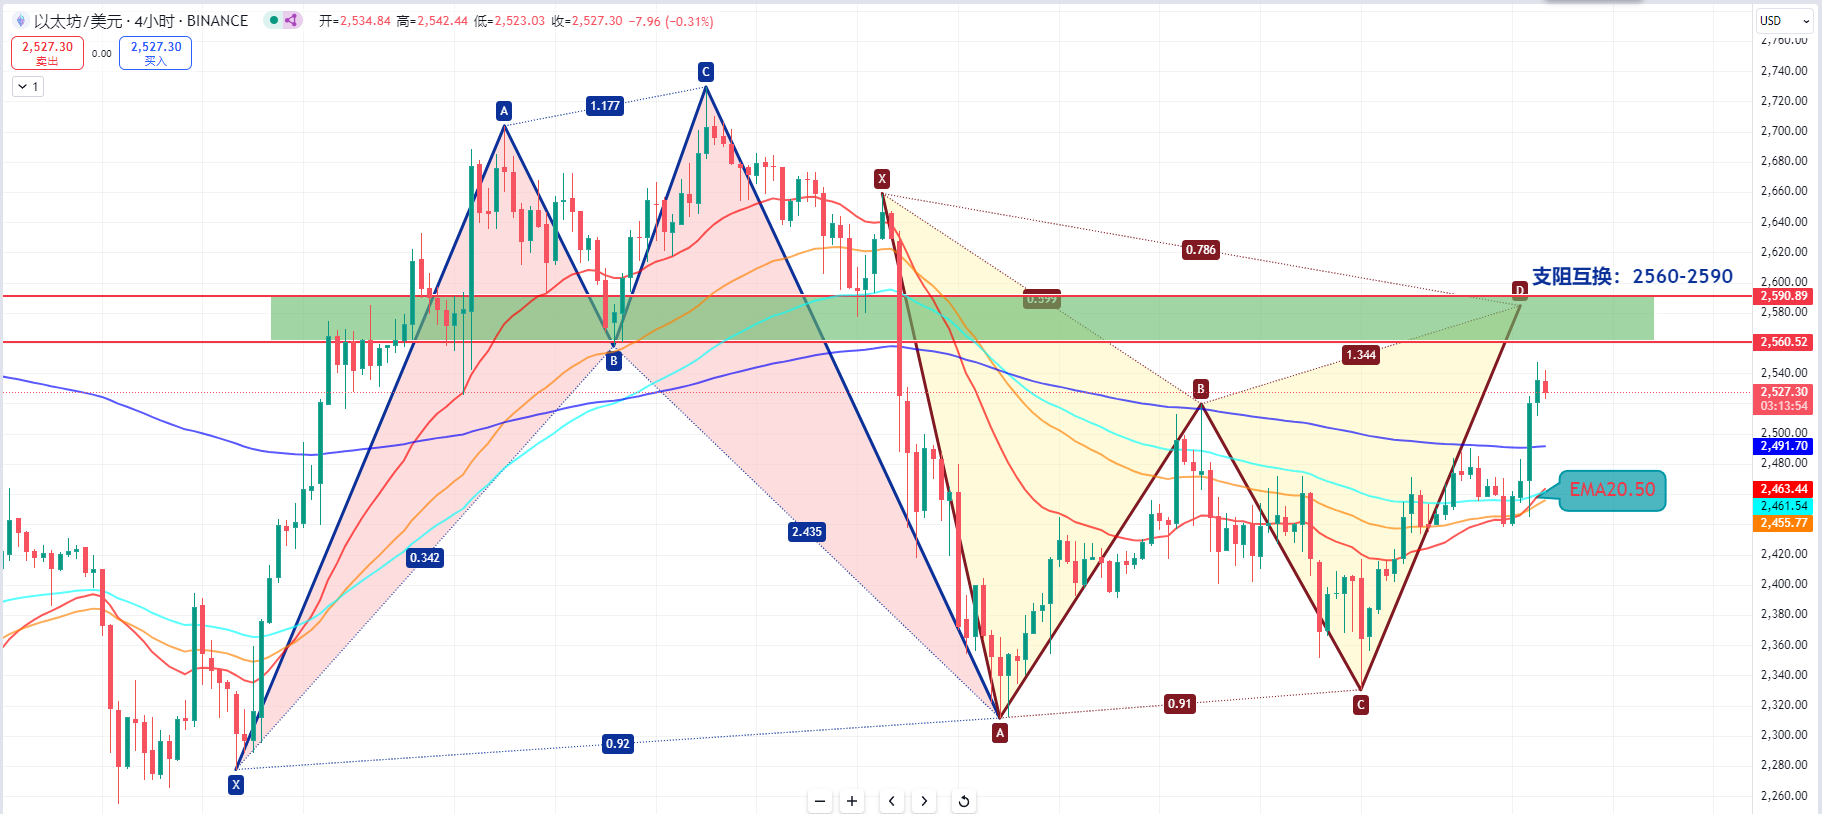
Now let's take a look at the 4-hour chart of Ethereum. We can see that the wedge on the left has quickly approached our resistance level, which is around 2560 to 2590. This position is also where support and resistance switch.
So at this position, long positions can take profits. Currently, on the right side, there is a small reversal pattern, which is from the position where support and resistance switch on the left. Therefore, for fans who want to go long on a smaller scale, they can also take profits at the top.
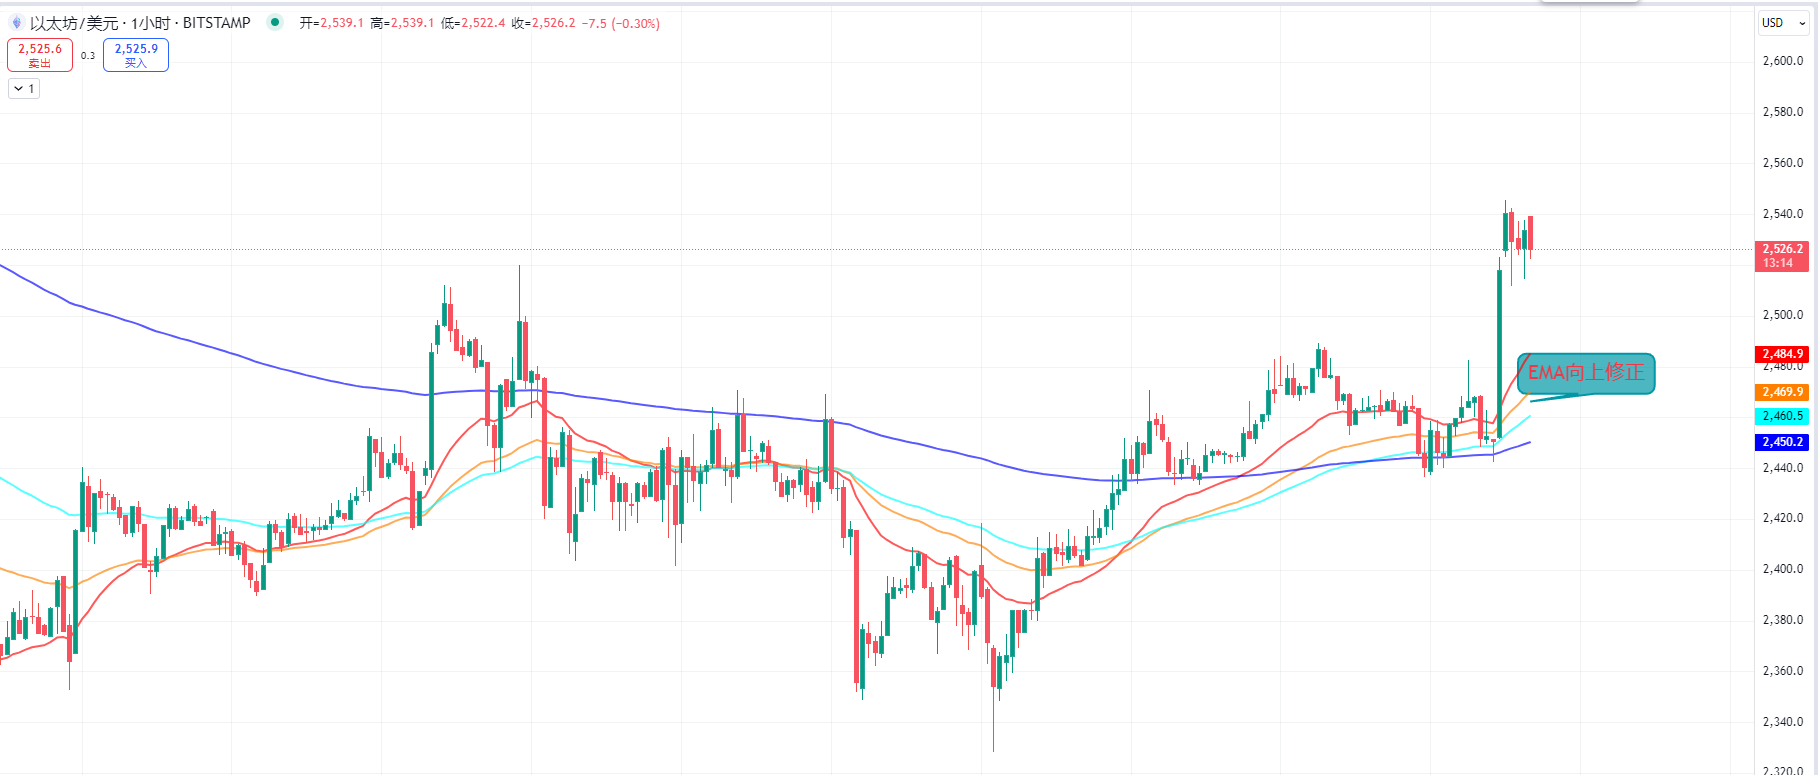
Alternatively, if the EMA moving average on the 1-hour chart is correcting upwards, as long as it does not break down during the retest, we can also open long positions to take profits at the top. Many friends will definitely ask if they can short.
We can look at the 4-hour chart to see if the upper resistance and support switch position will continue to be blocked. If so, we can also short. This is a short-term short. We can see that we can take profits near the EMA20 and 50 moving averages below.
So for today, we will first focus on the lower side. If friends are going long, they can take profits at the upper support and resistance conversion point.
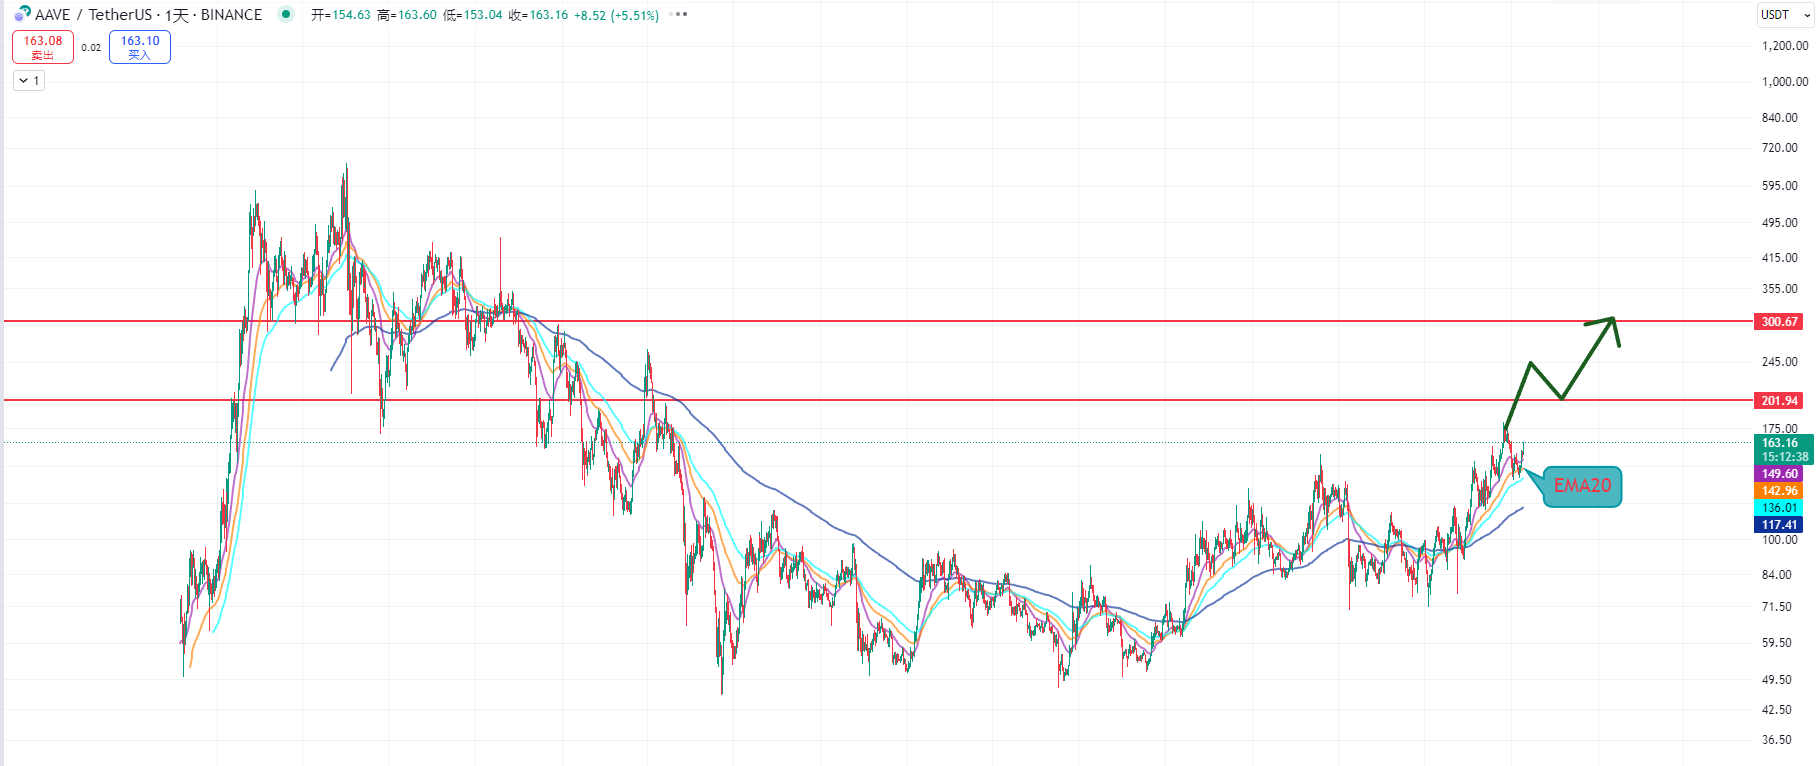
At the request of many fans, I will also talk about the AAVE cryptocurrency in today's video. In fact, this cryptocurrency is rarely focused on. Currently, on the daily chart, it has just retested our EMA20 moving average.
On the hourly chart, you can also look for opportunities to enter on a retest of the EMA on the 4-hour chart below. Because from a larger perspective,
I believe it is about to show a trending market, and the target should be around the previous high of 200 dollars without any problem. I believe it can go up to around 300 for taking profits. But currently, this can only be done in spot trading, as trading small cryptocurrencies in contracts is very easy to get washed out.
This article is exclusively planned and published by Master Chen (public account: Coin God Master Chen). If you want to learn more about real-time investment strategies, solutions, spot contract trading techniques, operational skills, and knowledge about candlesticks, you can add Master Chen for learning and communication. I hope it can help you find what you want in the cryptocurrency world. Focusing on BTC, ETH, and altcoin spot contracts for many years, there is no 100% method, only 100% following the trend; daily updates of macro analysis articles across the network, mainstream coins, and altcoin technical indicator analysis, as well as spot medium to long-term price prediction videos.

Warm reminder: This article is only written by the official account (above) of Master Chen. Other advertisements at the end of the article and in the comments section are unrelated to the author!! Please be cautious in distinguishing between true and false, thank you for reading.
免责声明:本文章仅代表作者个人观点,不代表本平台的立场和观点。本文章仅供信息分享,不构成对任何人的任何投资建议。用户与作者之间的任何争议,与本平台无关。如网页中刊载的文章或图片涉及侵权,请提供相关的权利证明和身份证明发送邮件到support@aicoin.com,本平台相关工作人员将会进行核查。


