Do not worry about having no friends on the road ahead; there are like-minded individuals on the investment journey. Good afternoon, everyone! I am the King of Coins from the Coin Victory Group. Thank you all for coming here to watch the articles and videos from the King. I also hope that the brothers who have been following the King will return.
Click the link to watch the video:https://www.bilibili.com/video/BV15922YjEXk/

First, let's review the trading ideas presented in the articles and videos released by the Coin Victory Group yesterday. For Bitcoin, I suggested entering around 61200, with a target of 60000. Opening the chart, it is clear that an entry opportunity was provided, and we successfully took profits. The subsequent long position had a stop loss of 200 points, resulting in an overall profit of over 1000 points for Bitcoin. Now, let's take a look at the Ethereum strategy from yesterday, which can be considered legendary. The idea was to short at 2420 and go long at 2330~2340, with a stop loss of 15 points. Yesterday, both long and short positions had entry opportunities. The short position yielded a profit of 90 points, and the long position has also reached a profit of 90 points so far, totaling a combined profit of over 180 points, capturing all the profits from Ethereum's fluctuations yesterday. Congratulations to those who followed the ideas from the Coin Victory Group's articles and videos.

Next, let's take a look at the CPI data released last night, which directly led to this significant drop in the market. The previous value was 2.5%, the expectation was 2.3%, and the actual published value was 2.4%. We can see that the overall data is relatively in line with expectations, but why did the market experience such large fluctuations? It is clear that the current capital market does not trust the authenticity of the data released by the Federal Reserve. The simple truth is that capital only votes with its feet; the bottom line determines the mindset. In the current situation of interest rate cuts by the Federal Reserve combined with escalating geopolitical conflicts, international oil prices are skyrocketing, making it impossible for inflation to maintain the previous value or even decrease. The data shows that even if there are issues, they only dare to report slightly below the previous value, reflecting that real inflation is already on the verge of being out of control. When the data is corrected and published, it will inevitably lead to a significant market retreat. Therefore, capital institutions voting with their feet led to selling pressure, causing the market to break below 60,000. This is the reality of the capital market; lies are everywhere.
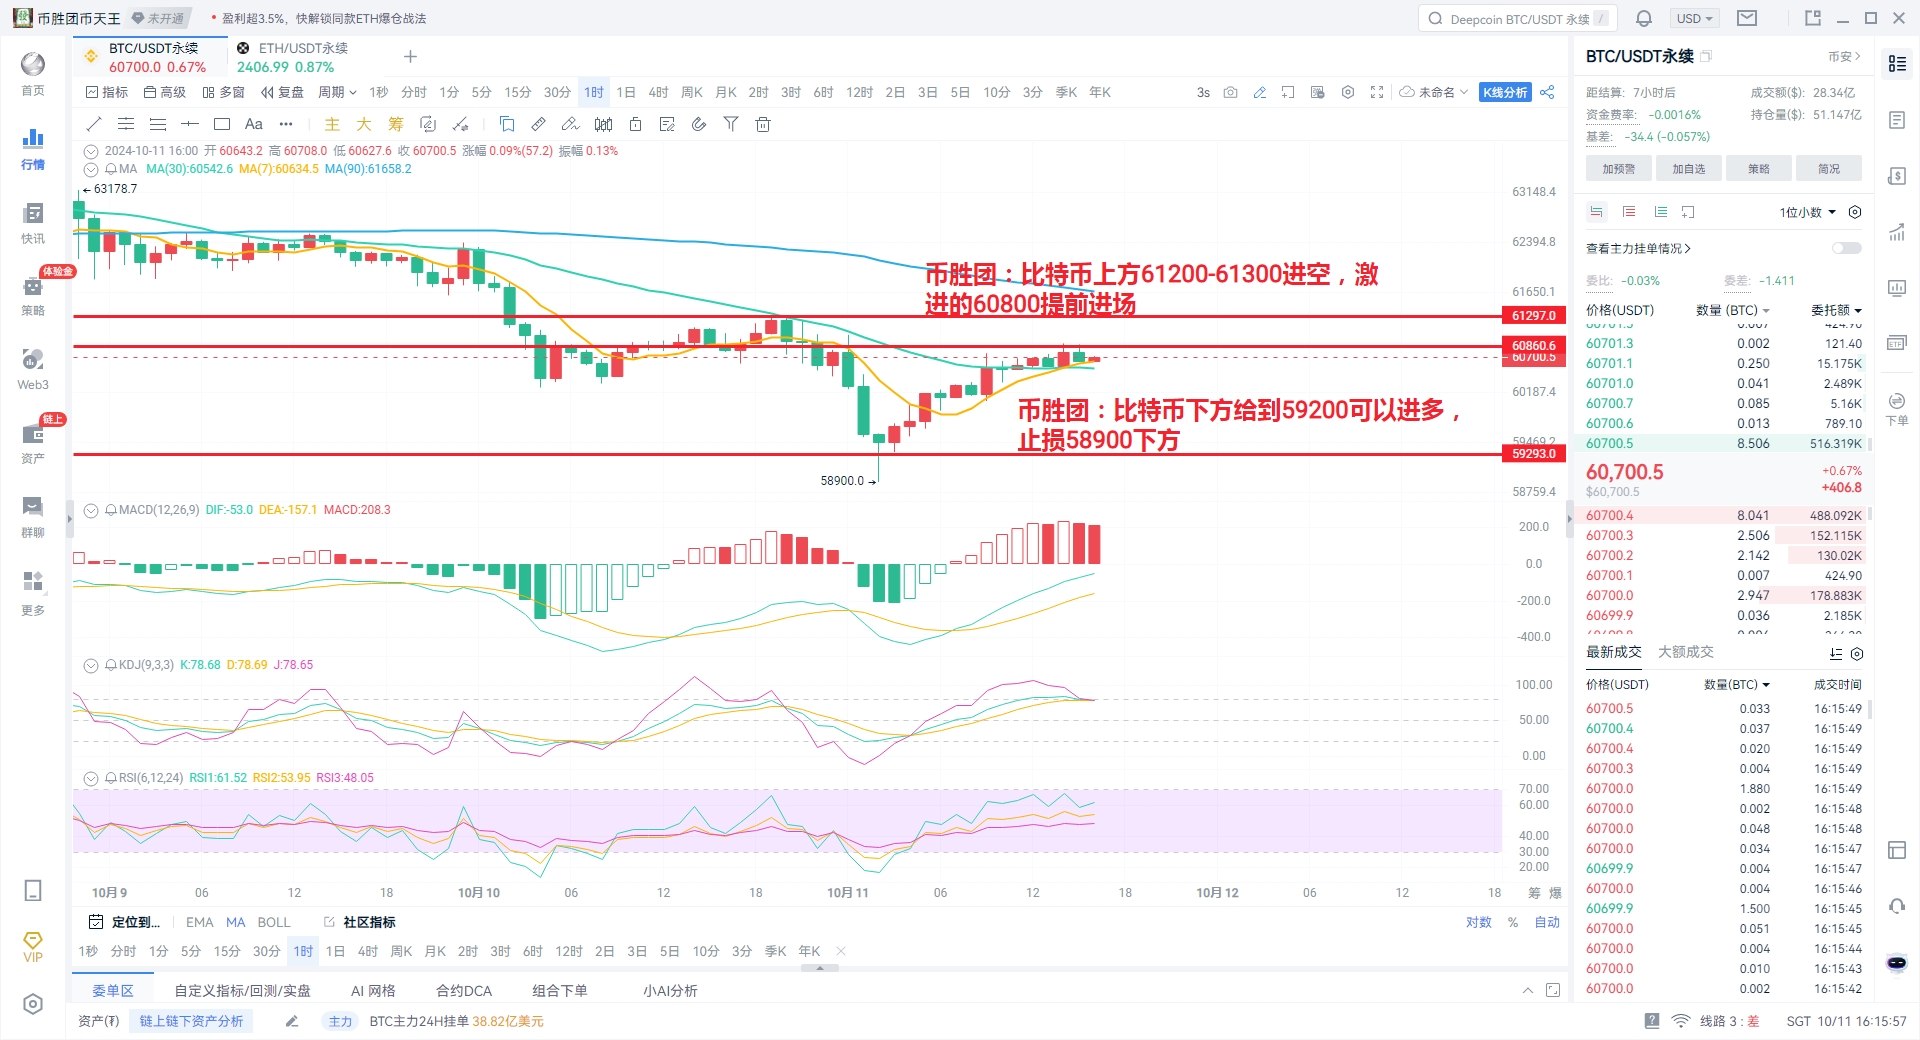
Now, let's take a look at the specific movements of Bitcoin. As usual, let's first open the daily chart to see the overall direction. Currently, the daily chart has shown four consecutive bearish candles, but yesterday it closed with a bearish candle that had long shadows on both sides, indicating a bearish outlook. However, due to the data release yesterday, there was a significant pullback, resulting in an oversold condition, so the market is expected to rebound to fill the gap. Today, barring any surprises, the market will likely continue to close bearish but will not break below yesterday's low. Therefore, we can look for entry opportunities on the hourly chart. The upper range of 61200~61300 can be chosen for short positions, as this level has shown strong resistance after yesterday's market test. If you are aggressive, you can enter with a small position around the current price of 60800. The lower range to focus on is around 59200, where you can choose to enter long positions with a stop loss just below 58900, slightly lower than yesterday's new low. Because the King mentioned that today I personally do not expect a new low to be broken, this is today's Bitcoin market. If there are friends with positions stuck, feel free to reach out to the Coin Victory Group, and I will help you resolve the issues.
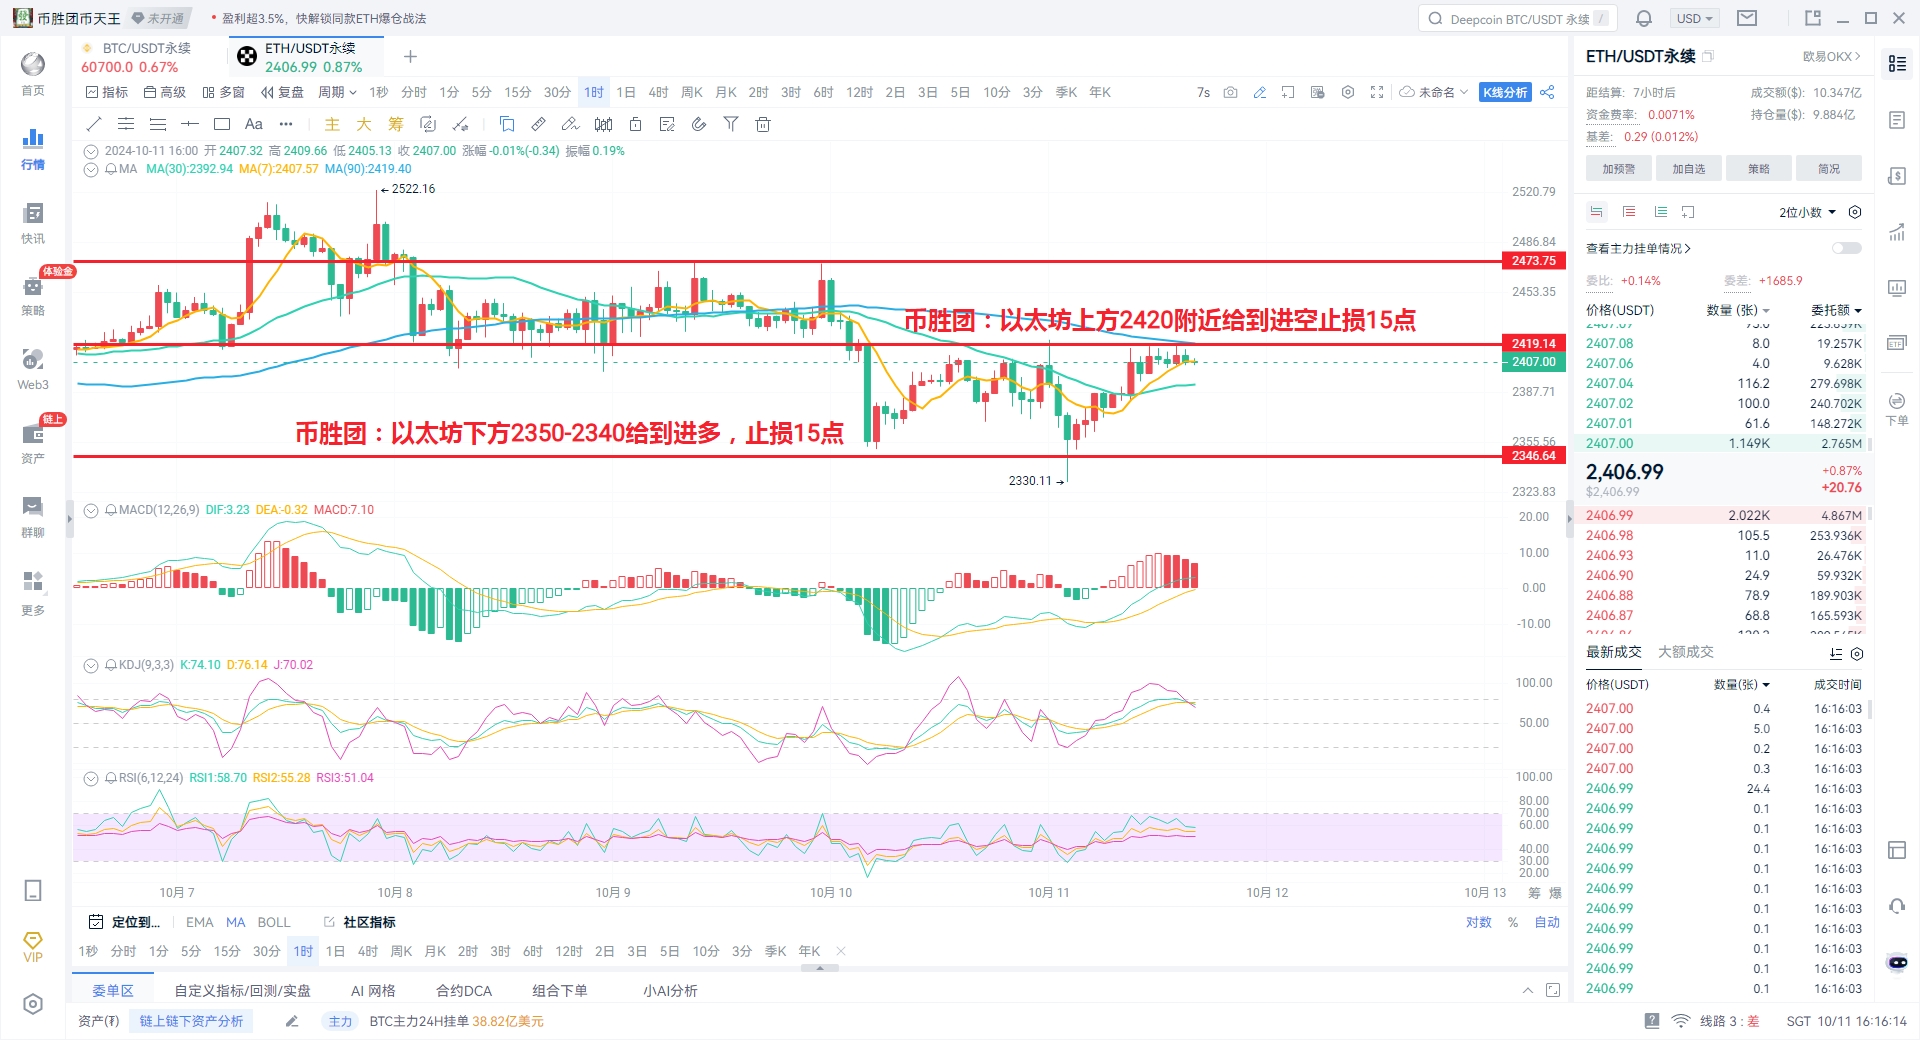
Now let's take a look at the Ethereum market. First, looking at the daily chart for Ethereum, yesterday it closed with a bullish doji, indicating that the support at the bottom is stronger than that of Bitcoin. This is actually easy to understand because there are more institutions holding Bitcoin, and due to the data release yesterday, institutional selling pressure was stronger. In contrast, Ethereum is mainly held by retail investors, so it has shown more resilience. Today, I personally believe that Ethereum will continue to operate within yesterday's candlestick. The upper range around 2420 can be a small short position with a 15-point stop loss. If this level breaks, then we can look to short again around 2480. The lower range around 2350 can be a long position with a normal half position, and the stop loss should be just below 2330. Because the market's volatility at the beginning of this month has been relatively large, we have decided to conduct a live review of the market over the weekend. Friends who need it can find the Coin Victory Group online, and I will send you the link to the live room.

This article is independently written by the Coin Victory Group. Friends who need current strategies and solutions can find the Coin Victory Group online. Recently, the market has been mainly characterized by fluctuations, accompanied by intermittent spikes. Therefore, when making trades, please remember to control your take profit and stop loss. In the future, when facing major market data, the Coin Victory Group will also organize live broadcasts across the internet. Friends who wish to watch can find the Coin Victory Group online and contact me for the link.
Mainly focused on spot and contract trading for BTC/ETH/ETC/LTC/EOS/BSV/ATOM/XRP/BCH/LINK/TRX/DOT, specializing in styles such as mobile locking strategies around high and low support and resistance, short-term wave trading, medium to long-term trend trading, daily extreme pullbacks, weekly K-top predictions, and monthly head predictions.
免责声明:本文章仅代表作者个人观点,不代表本平台的立场和观点。本文章仅供信息分享,不构成对任何人的任何投资建议。用户与作者之间的任何争议,与本平台无关。如网页中刊载的文章或图片涉及侵权,请提供相关的权利证明和身份证明发送邮件到support@aicoin.com,本平台相关工作人员将会进行核查。