Daily Share
The updates have been a bit late these past two nights mainly because our community's trading training course has started. I spent two hours teaching everyone in the evening, so the article was written a bit late.
In the recent market, Bitcoin first dropped from around 66,500 to about 59,800. It then rebounded from around 59,800 to 64,478, leading many to believe that the correction was over and that it would soon rise above 66,000. Personally, I still believe that the 4-hour level correction has not ended and that it will likely retest around 60,000 or even lower. Some people have raised doubts, with comments saying that I am stubbornly bearish or that I will miss out on gains. In fact, the market structure indicates that the decline is not complete, so my personal views will not be overly influenced by others. Additionally, our analysis has identified certain critical points, and only a breakthrough of these points will change our perspective.
For the short term, we need to observe the third wave of the 1-hour level decline. If it can retest around 59,800 again, then the overall 4-hour level correction may end at any time. Therefore, I do not recommend being overly bearish at the moment; instead, look for opportunities to observe potential bottom-fishing.
BTC
Due to the rapid changes in the market, the article can only make predictions based on the market conditions at the time of publication. Short-term players should pay attention to the latest market changes and use this information as a reference.
1H:
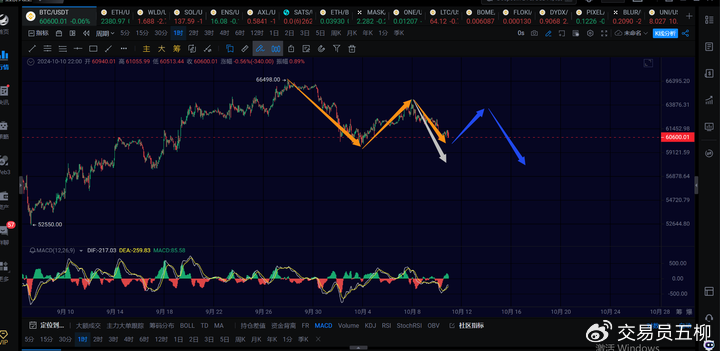
At the 1-hour level, we are currently in the third wave of the 1-hour decline, which is nearing its end. The short-term may see one more drop. We need to focus on the strength of the short-term decline. If Bitcoin retests around 60,000 without breaking below 59,800, there is a certain probability that it will make another 1-hour level rebound to around 63,000, forming a 1-hour level center before dropping below 59,800 to complete the overall 4-hour level correction, as indicated by the blue arrow in the image above.
Alternatively, if the 1-hour decline breaks below 59,800, as shown by the white arrow in the image above, this will end the 4-hour level correction at any time and initiate a new 4-hour level rebound to break through 66,500.
In either case, for the short term, I do not recommend going short; instead, the focus should be on potential bullish opportunities as it retraces. Then, based on the situation, consider whether the 4-hour level decline is forming a center extension or directly ending to start a new rebound.
15M:
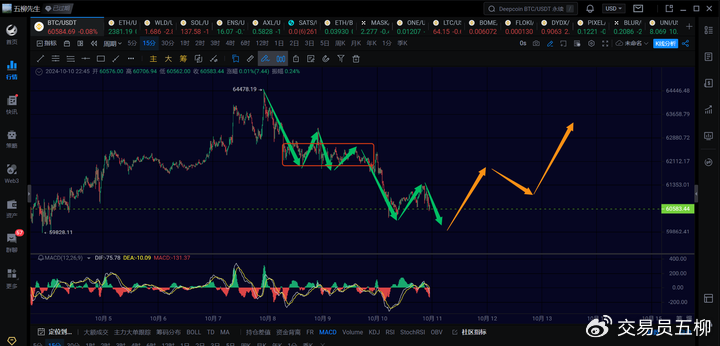
At the 15-minute level, after retesting around 60,000, regardless of whether it breaks below 59,800, the short term will likely lean towards the end of this 1-hour decline, with expectations for at least one 1-hour level rebound to around 63,000 or higher in the next couple of days.
ETH
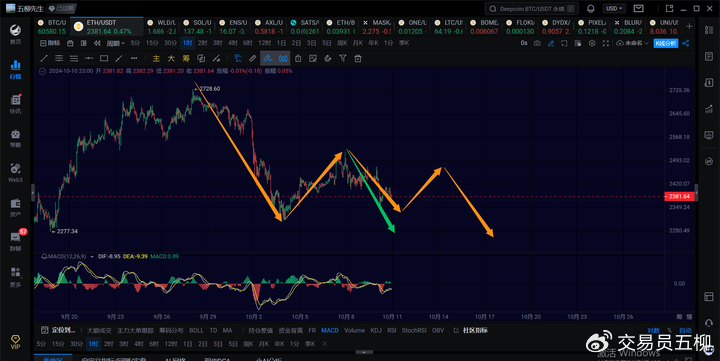
Ethereum is similar; we consider two scenarios based on the strength of the 1-hour decline. If the current 1-hour decline cannot drop below around 2,350, then the short term is likely to consolidate into a 1-hour level center before declining, as indicated by the yellow arrow in the image above. It would first make a 1-hour level rebound to around 2,500, then drop back to around 2,300 or 2,250. If the current 1-hour decline can retest 2,310, then the overall 4-hour decline can end at any time, as shown by the green arrow in the image above.
The specific trend still needs to be observed based on the strength of the decline in the early morning.
Trend Direction
Weekly Level: The direction is downward, theoretically around 49,000 is about right. Whether it has ended still needs observation, but the probability of starting a weekly rebound is increasing.
Daily Level: The direction is upward, and in the short term, we should continue to look at the 67,000~70,000 range.
4-Hour Level: The direction is downward, and the 4-hour decline is nearing its end; we should observe until tomorrow morning to see if it ends directly.
1-Hour Level: The direction is downward, and we are watching whether the 1-hour decline will retest around 60,000 or break below 59,800.
15-Minute Level: The direction is downward.
Feel free to follow my public account for discussions and exchanges:

The article is time-sensitive; please be aware of the risks. The views expressed are personal suggestions and for reference only!
免责声明:本文章仅代表作者个人观点,不代表本平台的立场和观点。本文章仅供信息分享,不构成对任何人的任何投资建议。用户与作者之间的任何争议,与本平台无关。如网页中刊载的文章或图片涉及侵权,请提供相关的权利证明和身份证明发送邮件到support@aicoin.com,本平台相关工作人员将会进行核查。


