The highly anticipated U.S. election has entered the final month countdown. In the long term, regardless of the election outcome, Bitcoin is expected to perform well under the conditions of low interest rates, ongoing U.S. fiscal deficits, and unprecedented debt levels. If Democratic candidate Harris ultimately wins, the cryptocurrency market may face short-term setbacks, and Bitcoin could retest the support at $40,000; however, if former U.S. President Trump wins, it would likely boost Bitcoin's rise, potentially pushing it up to the key resistance level of $80,000.
In terms of cryptocurrency, Bitcoin briefly touched $62,411 earlier yesterday due to a rise in U.S. stocks before rapidly declining. This morning, around five o'clock, it hit a low of $60,302, and as of the time of writing, it is quoted at $61,149, down 1.73% in the last 24 hours. Whether it can stabilize at $60,000 will require more time to observe.
Bitcoin 4-Hour Chart
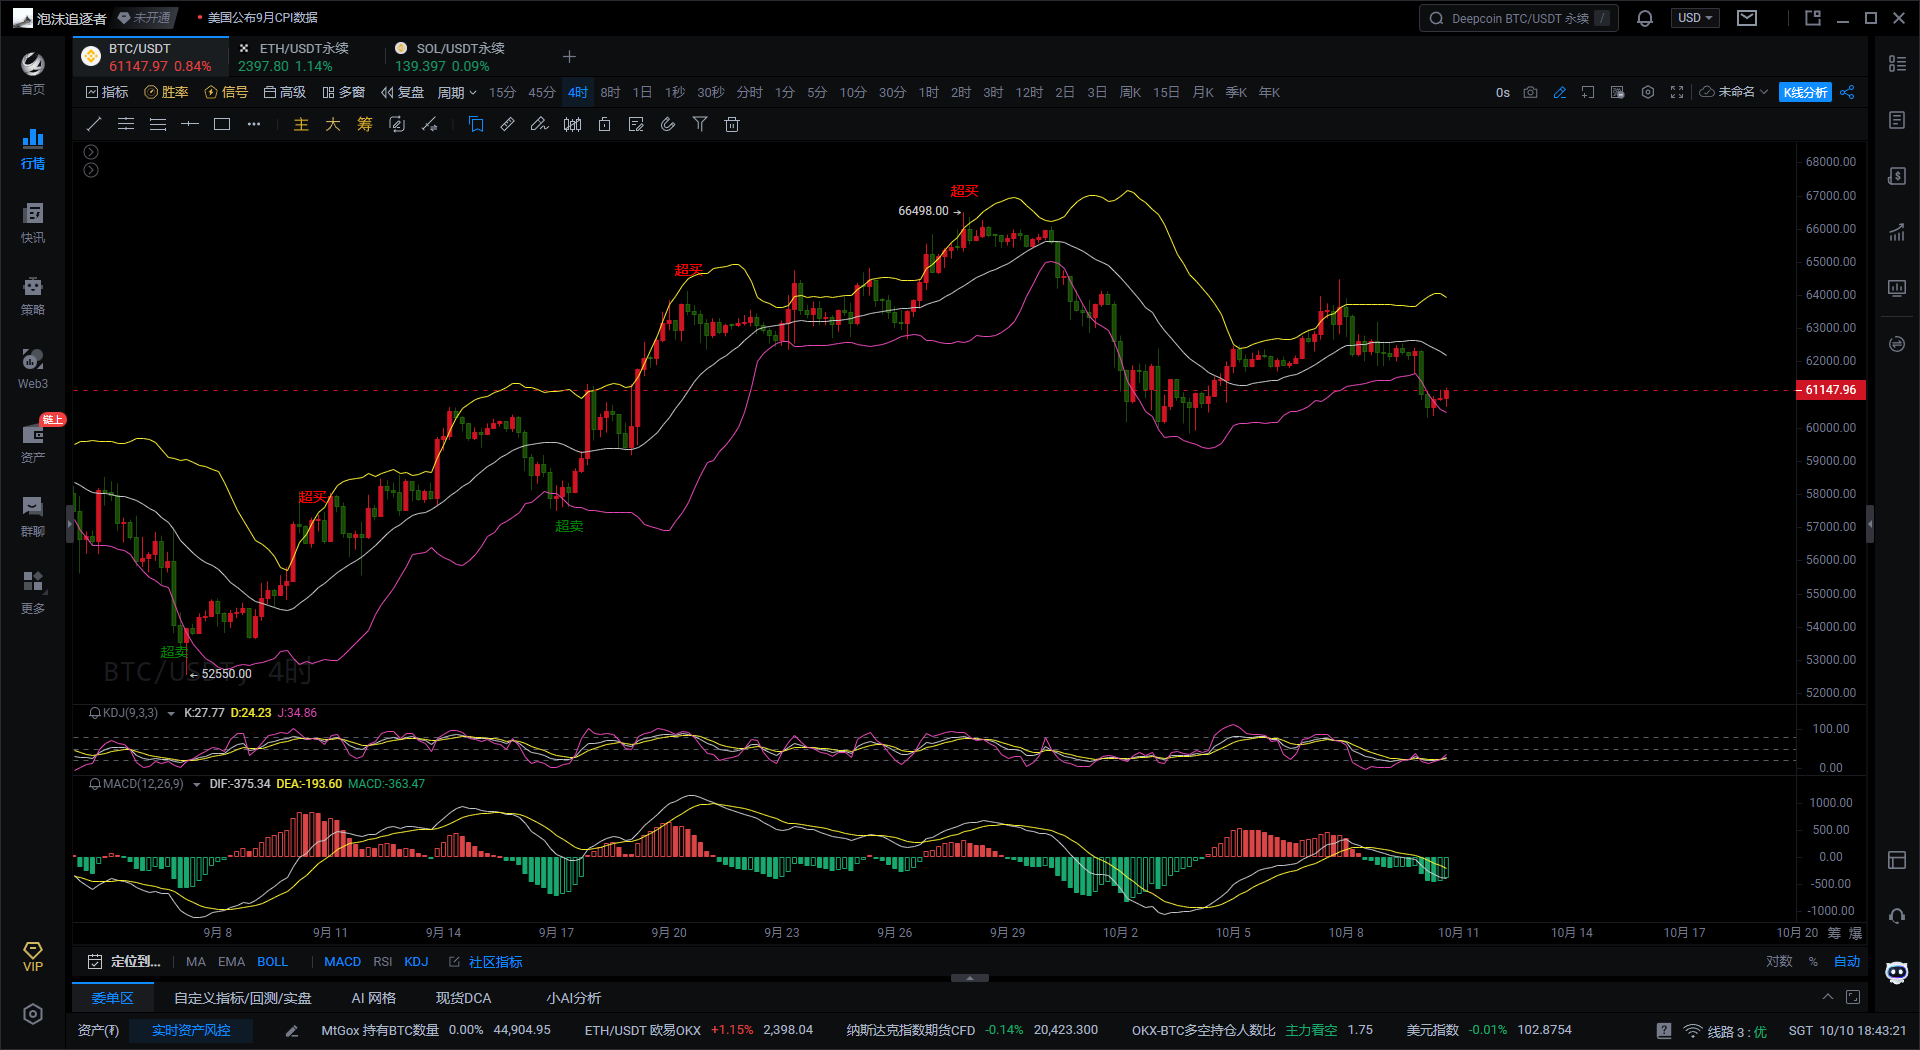
First, according to the Bollinger Bands indicator on the 4H Bitcoin chart, the price is operating between the middle and lower bands and is currently close to the lower band, indicating that the market is testing support levels. If the price fails to effectively break below the lower band and stabilizes, it will rebound towards the middle band or even the upper band. If the price effectively breaks below the lower band and continues to decline, it indicates strong bearish momentum, leading to further downward space.
Second, based on the KDJ indicator on the 4H Bitcoin chart, both the K and D lines are operating below 50, while the J line is even lower, indicating that the market is currently in a weak state. However, the KDJ three-line values are currently in an oversold state, which may present a risk of rebound. It is necessary to observe whether the subsequent KDJ indicator will turn upward; if it forms a golden cross, the price will rebound.
Finally, according to the MACD indicator on the 4H Bitcoin chart, both the DIF and DEA lines are operating below the zero axis, indicating that the current market is in a bearish trend. However, the MACD green histogram is gradually shortening, suggesting that bearish momentum is weakening. If the DIF line continues to move upward towards the DEA line and forms a golden cross, it may bring about a rebound. But if a dead cross forms again at the bottom, it may continue to decline.
Bitcoin 1-Hour Chart
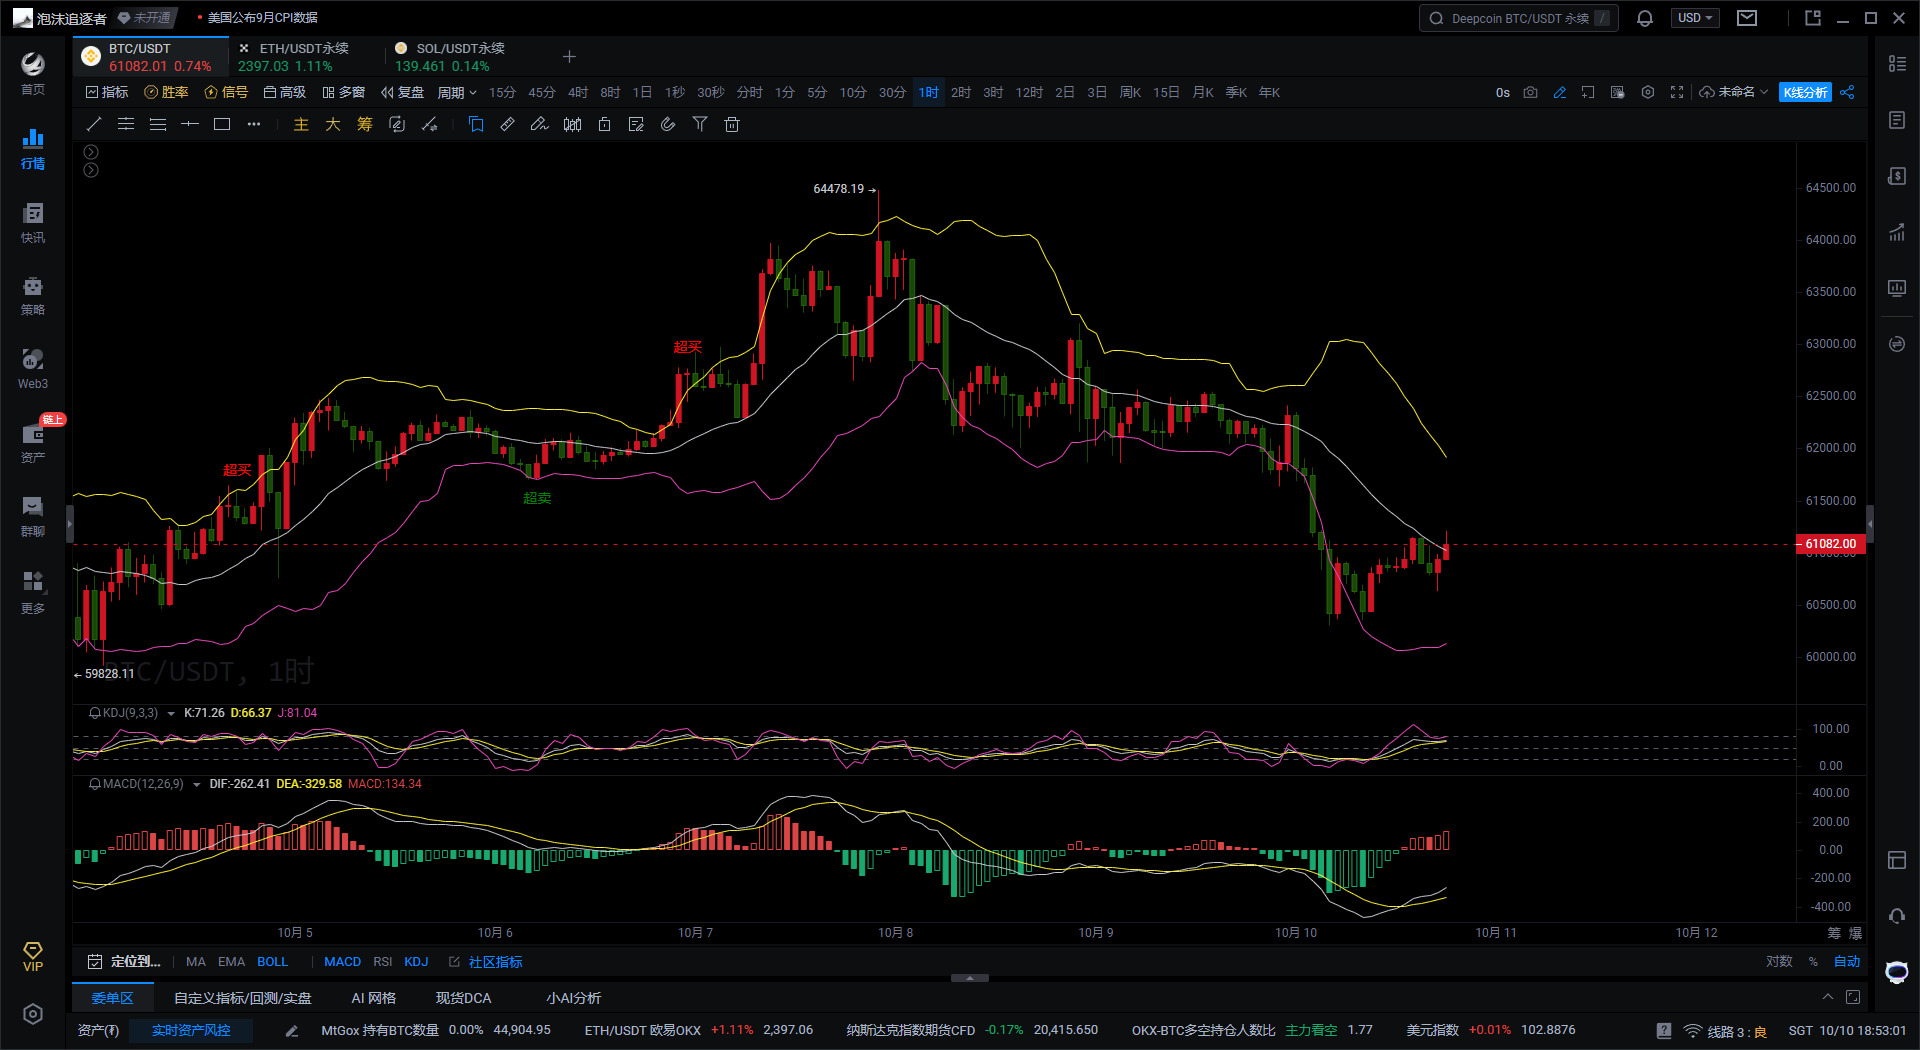
First, according to the Bollinger Bands indicator on the 1H Bitcoin chart, the current price is above the middle band, and it may test the pressure near the upper band in the short term. If the price breaks through the upper band with significant trading volume, it may lead to a bullish trend. If the price fails to effectively break through the upper band, it may retreat to the middle band or even the lower band to seek support.
Second, based on the KDJ indicator on the 1H Bitcoin chart, both the K and D lines are at high levels, and the J line has entered the overbought area, indicating that it may face pressure for a pullback in the short term. If the KDJ indicator forms a dead cross downward in the overbought area, it will validate the possibility of a market pullback.
Finally, according to the MACD indicator on the 1H Bitcoin chart, the DIF and DEA lines are about to converge below the zero axis, indicating that the overall market is still in a bearish trend. The MACD green histogram is gradually shortening, and the red histogram is beginning to appear, suggesting that there is a chance for a rebound in the short term. If the DIF and DEA form a golden cross upward, there may be further upward momentum.
In summary, from the 4-hour perspective, Bitcoin is still in a weak phase, with both MACD and KDJ indicating that bearish forces are dominant, but there is also some rebound potential, especially since KDJ is in the oversold range, which may lead to a short-term rebound. The 1-hour chart shows some rebound momentum, and the appearance of the MACD red histogram along with support from the Bollinger Bands middle band indicates that the rebound may continue. However, the KDJ is in the overbought area, so caution is needed regarding the risk of a pullback.
Based on the above analysis, the following suggestions are provided for reference:
Consider going long on Bitcoin near the 60400-60600 range, targeting 61600-62000, with a stop loss at 60000.
Instead of giving you a 100% accurate suggestion, I prefer to provide you with the right mindset and trend. After all, teaching someone to fish is better than giving them fish; the goal is to earn for a lifetime by learning the right approach! The focus is on the mindset, grasping the trend, and planning the market layout and positions. What I can do is use my practical experience to help you make investment decisions and manage operations in the right direction.
Writing time: (2024-10-10, 18:45)

(Written by - Daxian Says Coin) Disclaimer: Online publication may have delays; the above suggestions are for reference only. The author is dedicated to research and analysis in the investment fields of Bitcoin, Ethereum, altcoins, forex, stocks, etc., with years of experience in the financial market and rich practical operation experience. Investment carries risks; please proceed with caution. For more real-time market analysis, please follow the official account Daxian Says Coin for discussion and exchange.
免责声明:本文章仅代表作者个人观点,不代表本平台的立场和观点。本文章仅供信息分享,不构成对任何人的任何投资建议。用户与作者之间的任何争议,与本平台无关。如网页中刊载的文章或图片涉及侵权,请提供相关的权利证明和身份证明发送邮件到support@aicoin.com,本平台相关工作人员将会进行核查。


