At the crossroads, it's time to make a choice. The U.S. CPI inflation data for September will be released tonight at 20:30! Bitcoin continues its downward trend from yesterday, currently trading around 6.1. Despite the dovish signals from the Federal Reserve's minutes released in the early morning, it has not provided a boost to Bitcoin, with the price briefly touching the 6.03 level!
The CPI (Consumer Price Index), as an important indicator for observing inflation levels, had a previous value of 2.5% for September, with market expectations at 2.3%. Thanks to the Federal Reserve's relentless efforts, it has finally come down, getting closer to the 2% target. If inflation rebounds, the probability of the Fed halting interest rate cuts is low. The increase in employment numbers or the decrease in the unemployment rate indicates that there is no risk of a hard landing for the U.S. economy, and there may only be some debate regarding the extent of interest rate cuts! Additionally, the direction of the Federal Reserve's monetary policy next month may be revealed in this inflation data!

On Thursday, after a round of declines, Bitcoin maintained a fluctuation around 6.1 during the day. From a weekly perspective, last week showed a clear inverted hammer candlestick, indicating significant buying pressure above. This week is likely to see a larger level of correction, which I need to clarify is a correction, not a reversal of the trend. The overall direction remains bullish, especially under the current influence of the Fed's interest rate cut policy! Now that we have clarified the short-term direction, the next step is to determine how to find an entry position!
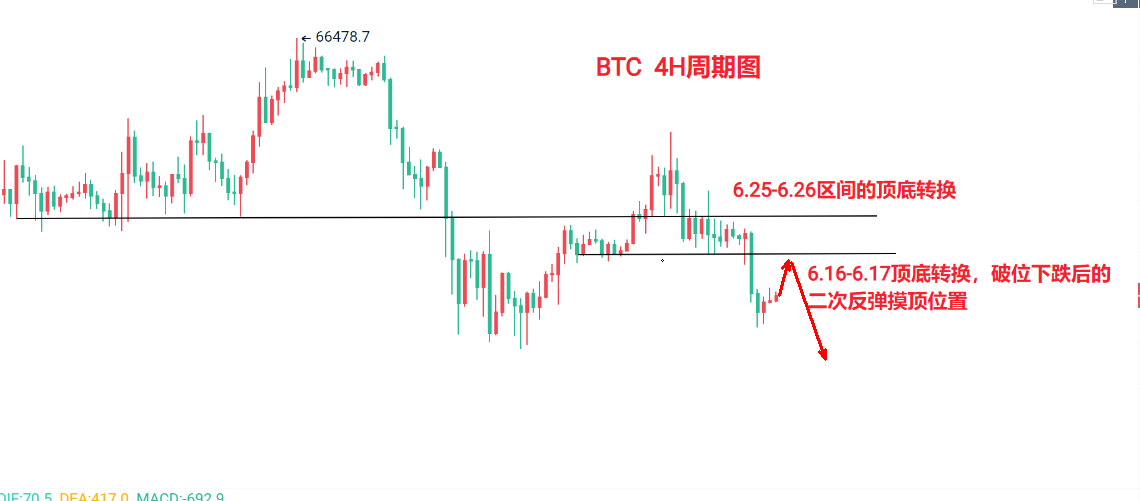
If the evening CPI data comes in below the previous 2.5%, with market expectations leaning towards the upside, there is strong resistance in the 6.16-6.17 range. This level has been touched multiple times in the 4-hour cycle and can be seen as a support-resistance conversion point. After the data is released, if the market touches this level, we can consider opening a short position! Since the MACD indicator is in a continuous bearish expansion phase, if the market does not provide a significant rebound as expected, we can adopt a staggered layout approach after the data release. We can open a short position in the 6.13-6.14 range for the initial entry, and add to the position at the expected resistance level during the rebound, which also helps prevent missing out on the market!
For Ethereum, we will follow the same strategy as Bitcoin, with resistance at the 4-hour cycle support-resistance conversion level of 3410-3420!
Operating Strategy:
Bitcoin: Enter a short position in the 61300-61400 range. If the data provides a range of 61600-61700, add to the position, targeting 60300, and if it breaks, look towards 59300.
Ethereum: Short in the 2410-2420 range, targeting 2340.
For real-time market strategy discussions and inquiries about market issues, please follow our public account!

免责声明:本文章仅代表作者个人观点,不代表本平台的立场和观点。本文章仅供信息分享,不构成对任何人的任何投资建议。用户与作者之间的任何争议,与本平台无关。如网页中刊载的文章或图片涉及侵权,请提供相关的权利证明和身份证明发送邮件到support@aicoin.com,本平台相关工作人员将会进行核查。