Ordinary users on cross-chain bridges are more valuable than those on L2.
Written by: Joel John
Translated by: Luffy, Foresight News
The killer application of cryptocurrency has emerged, and that is stablecoins. In 2023, Visa's transaction volume approached $15 trillion, while the total transaction volume of stablecoins reached $20.8 trillion. Since 2019, the total amount transferred between wallets using stablecoins has reached $221 trillion.
In recent years, an amount equivalent to the global GDP has been flowing on the blockchain. Over time, this capital gradually accumulates across different networks. Users switch between different protocols to seek better financial opportunities or lower transfer costs; by the time we reach the era of chain abstraction, users may not even know they are using cross-chain bridges.
Cross-chain bridges can be seen as routers for capital. When you access any website on the internet, there is a complex network operating in the background. The physical router in your home is crucial to the network, determining how to route data packets to help you obtain the data you need in the shortest time possible.
Today, cross-chain bridges play the same role in on-chain capital. When users want to move from one chain to another, cross-chain bridges determine how to route funds to maximize the value or speed of the user's capital.
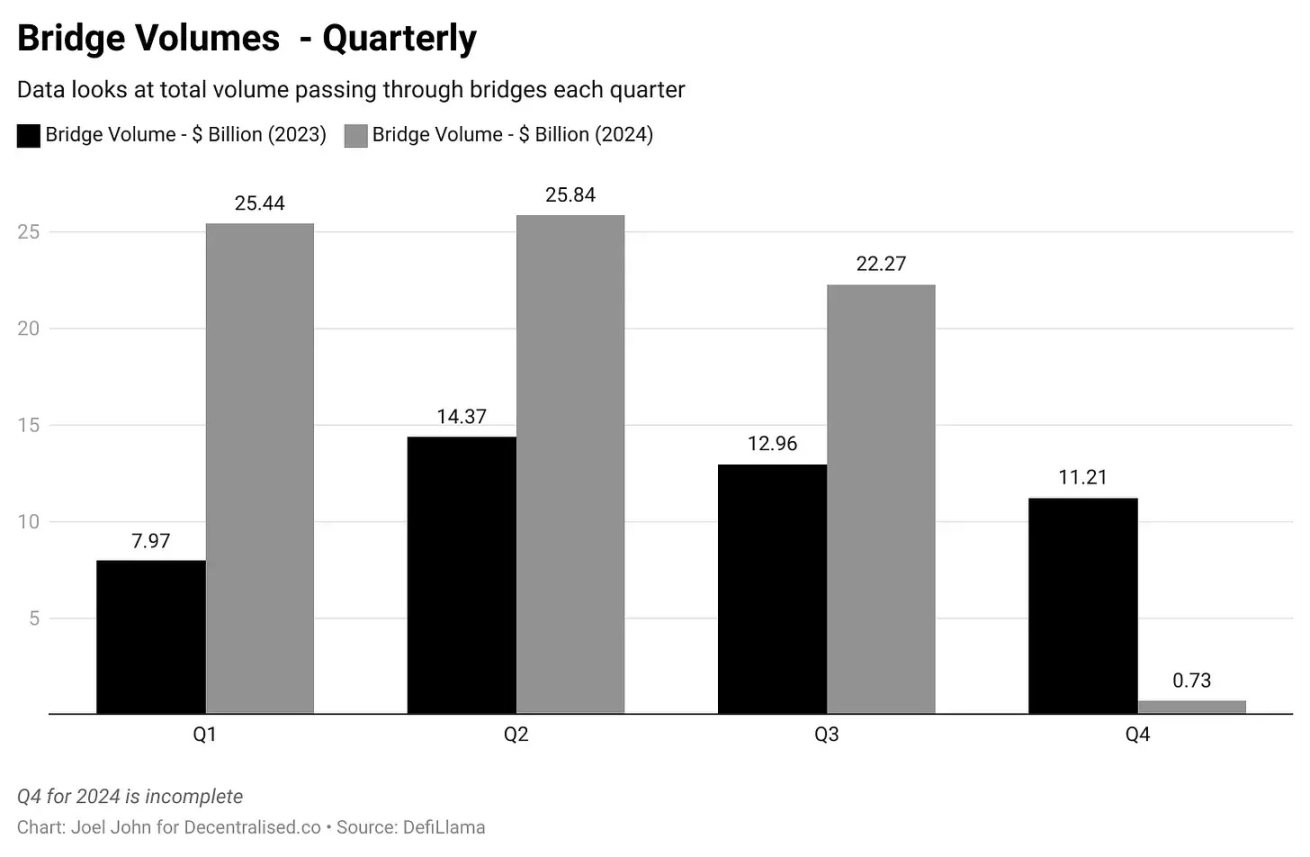
Since 2022, the transaction volume processed through cross-chain bridges has exceeded $100 billion. This is far less than the amount of funds transferred on-chain using stablecoins. However, compared to many other protocols, cross-chain bridges earn more profit from each user and every dollar locked.
Today's article will explore the business model behind cross-chain bridges and the funds generated through transactions on them.
Business Model of Cross-Chain Bridges
Since mid-2020, blockchain cross-chain bridges have generated nearly $104 million in cumulative fees. This data has a certain seasonality as users flock to cross-chain bridges to use new applications or seek economic opportunities. Without attractive yield opportunities, Memecoins, or financial primitives, the usage of cross-chain bridges would significantly decline, as users would stick to their most commonly used chains and protocols.
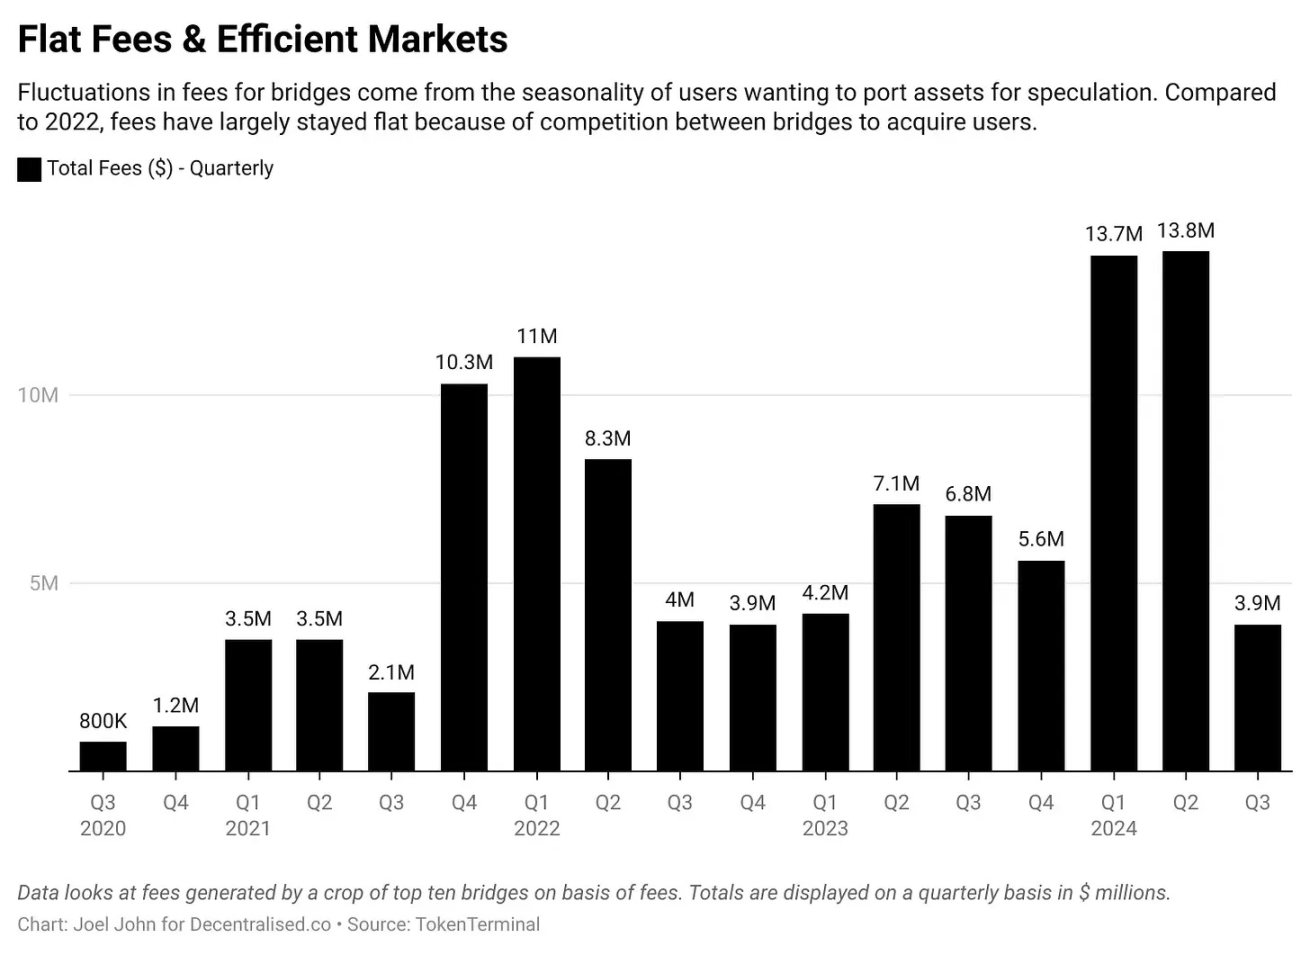
A sad (but interesting) way to measure cross-chain revenue is to compare it with Memecoin platforms like Pump.fun. When the fee revenue of the Memecoin platform is $70 million, the fee revenue of cross-chain bridges is $13.8 million.
Despite the increase in transaction volume, we see that fees remain relatively stable due to the ongoing price wars between blockchains. To understand how they achieve this efficiency, it is essential to understand how most cross-chain bridges operate. One mental model for understanding cross-chain bridges is through the Hawala network from a century ago (Note: The Hawala network is an ancient non-cash cross-border payment system consisting of a network of individuals who know each other and are distributed across different countries and regions).
Although most people's understanding of Hawala today revolves around its association with money laundering, a century ago, it was an effective way to transfer funds. For example, if you wanted to transfer $1,000 from Dubai to Bangalore in the 1940s, you had many options.
You could go to a bank, but it might take several days and require a lot of paperwork. Alternatively, you could go to a seller in the Gold Souk, who would take your $1,000 and instruct a merchant in India to pay an equivalent amount to a person you designate in Bangalore. The currency changes hands in both India and Dubai but does not cross borders.
How does this work? Hawala is a trust-based system that operates because the seller in the Gold Souk and the merchant in India typically have ongoing trade relationships. They do not directly transfer capital but settle balances later with goods (like gold). Since these transactions rely on mutual trust between the individuals involved, there is a high level of confidence required in the honesty and cooperation of both parties.
What does this have to do with cross-chain? Many cross-chains adopt the same model. In pursuit of yield, you might want to transfer capital from Ethereum to Solana. Cross-chain bridges like LayerZero work to help relay messages about users, allowing users to deposit tokens on one chain and borrow tokens on another.
Suppose these two traders are not locking assets or providing gold bars but instead give you a code that can be used anywhere to redeem assets. This code is a form of sending messages, and on LayerZero, it is referred to as endpoints. They are smart contracts existing on different blockchains. A smart contract on Solana may not understand a transaction on Ethereum and may require the help of an oracle. LayerZero uses Google Cloud as a validator for cross-chain transactions, relying on Web2 giants to help us build a better economic system even at the forefront of Web3.
Imagine that the traders involved do not trust their ability to interpret the code; after all, not everyone can have Google Cloud validate transactions. What can be done? Another method is to lock and mint assets.
In this model, if you use Wormhole, you would lock assets in a smart contract on Ethereum and then receive wrapped assets on Solana. This is akin to depositing dollars in the UAE, and then a Hawala provider gives you gold bars in India. You can take the gold, speculate with it, and then return it to retrieve your original capital in Dubai.
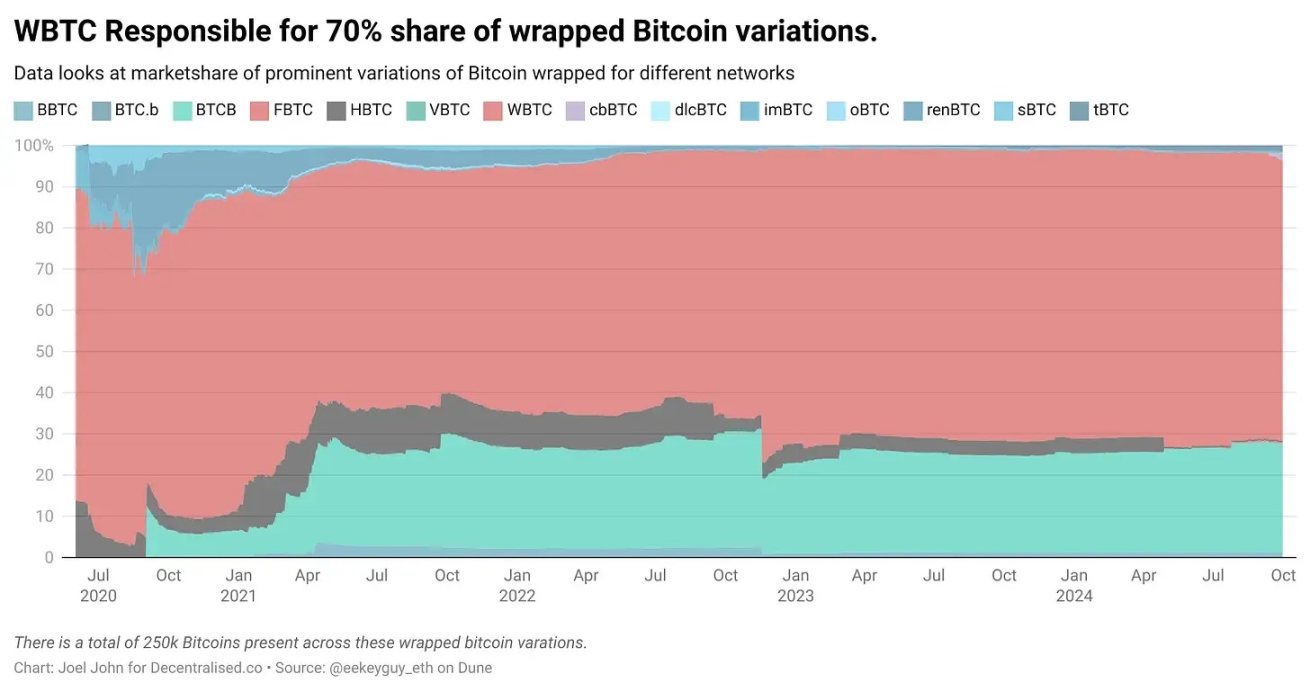
The following image shows the wrapped assets of Bitcoin today. Most of these were minted during DeFi summer, aiming to leverage Bitcoin to generate yields on Ethereum.
There are several key points to the commercialization of cross-chain bridges:
- TVL: When users come to deposit funds, these funds can be used to generate yields. Nowadays, most cross-chain bridges do not absorb idle capital and lend it out but charge a small transaction fee when users transfer capital from one chain to another.
- Relay Fees: These are fees charged by third parties (like Google Cloud in LayerZero) that charge a small fee for each transfer to validate transactions across multiple chains.
- Liquidity Provider Fees: Paid to those who deposit funds into the cross-chain bridge's smart contract. Suppose you are operating a Hawala network, and someone transfers $100 million from one chain to another. You may not personally have that much capital. Liquidity providers are individuals who pool these funds to help facilitate the transaction. In return, each liquidity provider receives a small portion of the fees generated.
- Minting Costs: Cross-chain bridges can charge a small fee when minting assets. For example, WBTC charges a fee of 10 basis points for each Bitcoin.
The expenses of cross-chain bridges are used to maintain relayers and pay liquidity providers, while the revenue comes from transaction fees and the value created for themselves through assets minted by both parties in the transaction.
Economic Value of Cross-Chain Bridges
The following data is somewhat messy because not all fees flow to the protocol. Sometimes, fees depend on the protocol and the assets involved. If a cross-chain bridge is primarily used for low-liquidity long-tail assets, it may also lead to users experiencing transaction slippage. Therefore, when we examine unit economics, the following does not reflect which cross-chain bridges are better than others. We are interested in seeing how much value is generated across the entire supply chain during cross-chain events.
First, we look at the transaction volume and fees generated across protocols over 90 days. The data is based on metrics as of August 2024, so these numbers reflect the following 90 days. We assume that Across has higher transaction volume due to its lower fees.
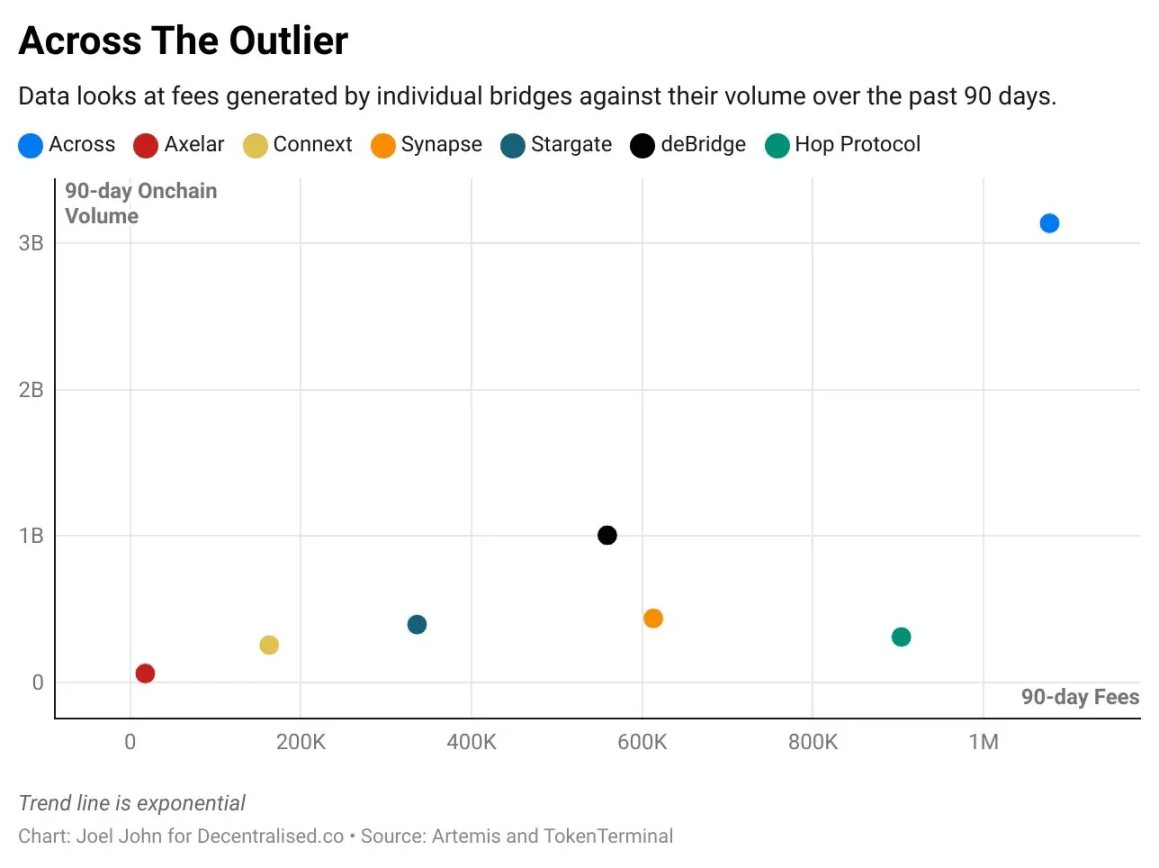
This roughly illustrates how much capital flows through cross-chain bridges in a specific quarter and the types of fees they generate during the same period. We can use this data to calculate the fees generated per dollar flowing through cross-chain bridges. For ease of reading, I will calculate the fees generated by transferring $10,000 through these cross-chains.
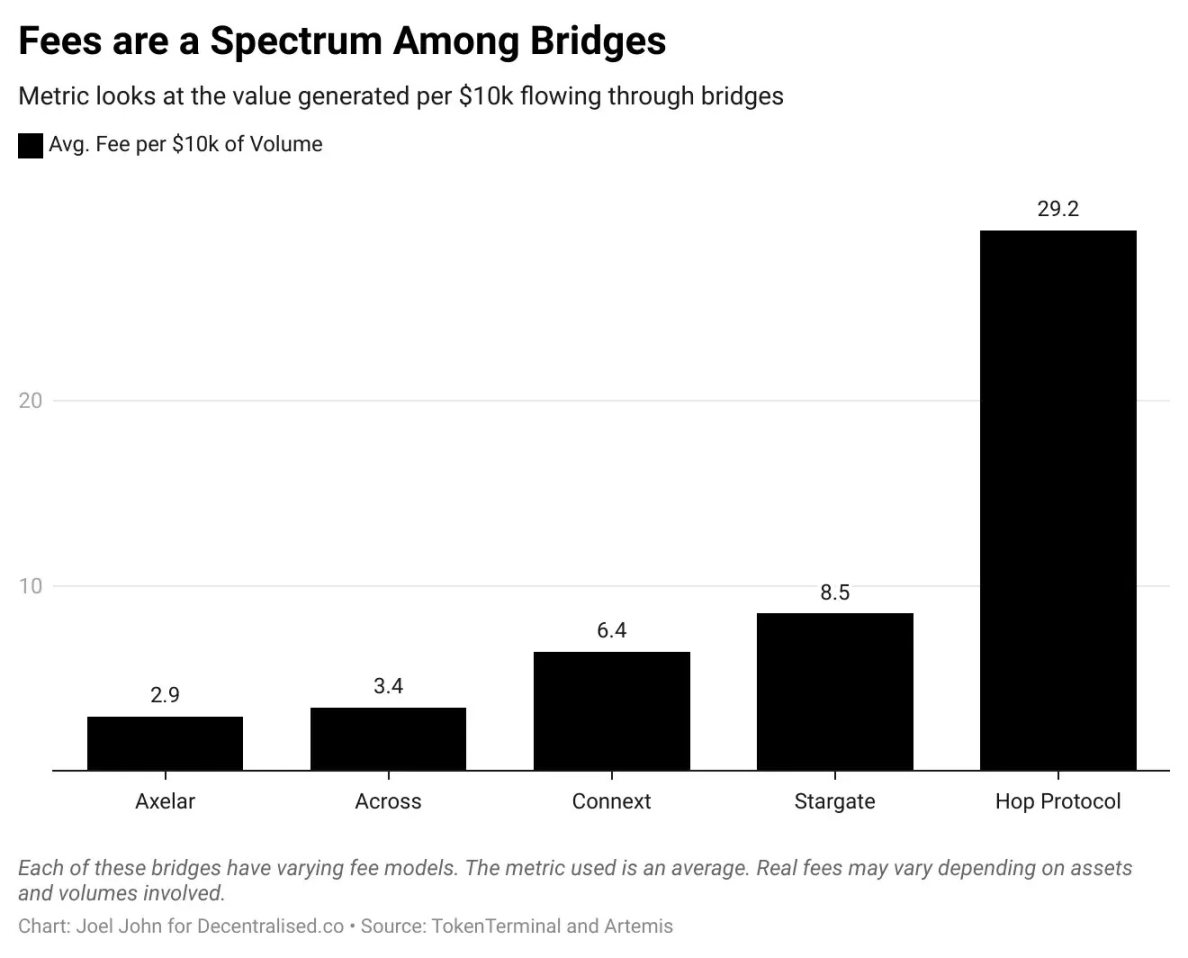
Before we begin, I want to clarify that this does not mean that Hop's fees are ten times higher than Axelar's. Rather, it indicates that on cross-chain bridges like Hop, each $10,000 transfer can create $29.2 of value across the entire value chain (for LPs, relayers, etc.). These metrics vary because of the different nature and types of transfers.
For us, the most interesting part is comparing it with the value captured on the protocol and the amount of capital across chains.
To benchmark, we look at the transfer costs on Ethereum. As of the writing of this article, the transfer cost on Ethereum is approximately $0.0009179 with lower gas fees, while the transfer cost on Solana is about $0.0000193. Comparing cross-chain bridges with L1 is somewhat like comparing routers with computers. The cost of storing files on a computer will decrease significantly. But what we are trying to address here is whether cross-chain bridges capture more value than L1 from an investment perspective.
From this perspective, and referencing the metrics above, one way to compare the two is to look at the dollar fees charged by each cross-chain bridge per transaction and compare them with Ethereum and Solana.
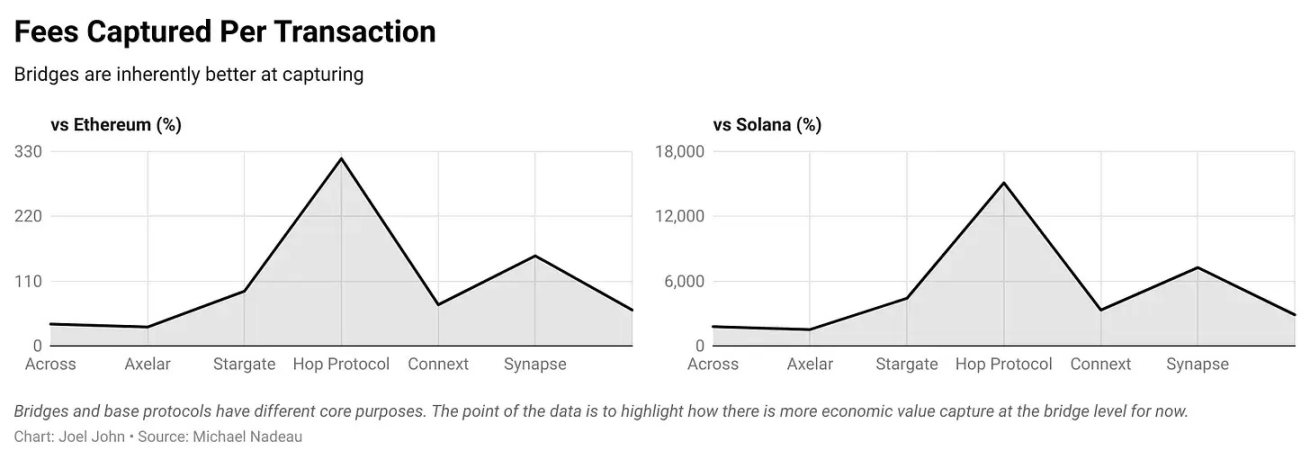
The reason several cross-chain bridges capture lower fees than Ethereum is due to the gas costs incurred when conducting cross-chain transactions from Ethereum.
One might argue that the Hop protocol captures 120 times more value than Solana. However, this statement misses the point, as the fee models of the two networks are entirely different. We are interested in the difference between value capture and valuation.
Among the top 7 cross-chain protocols, 5 have fees cheaper than Ethereum L1. Axelar is the cheapest, with an average fee over the past 90 days being only 32% of Ethereum's. Hop Protocol and Synapse are more expensive than Ethereum. Compared to Solana, we can see that the L1 settlement fees on high-throughput chains are several orders of magnitude cheaper than today's cross-chain protocols.
One way to further strengthen this data is to compare the costs of transactions on L2 within the EVM ecosystem. Generally speaking, Solana's fees are 2% of Ethereum's. For comparison, we will use Arbitrum and Base. Since L2s are designed for low fees, we will adopt a different metric to measure economic value—namely, the average daily fees per active user.
In the 90 days for which we collected data for this article, Arbitrum had an average of 581,000 users per day, generating an average of $82,000 in fees daily. Similarly, Base had 564,000 users, generating an average of $120,000 in fees daily.
In contrast, cross-chain users are fewer and fees are lower. The highest is Across, with 4,400 users generating $12,000 in fees. Based on this, we estimate that Across generates an average of $2.4 in fees per user per day. This metric can then be compared with the fees generated per active user on Arbitrum or Base to measure the economic value of each user.
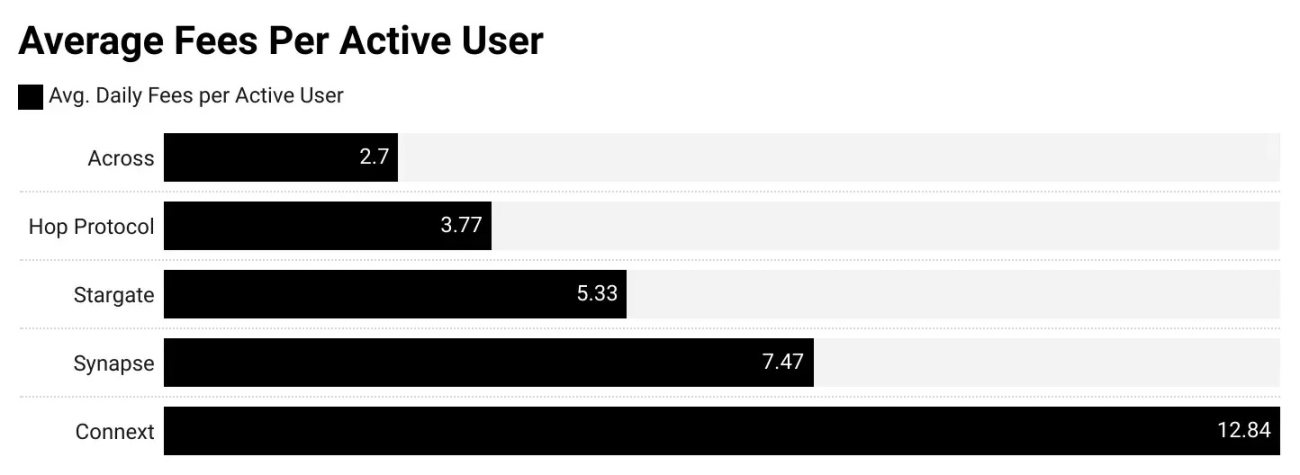
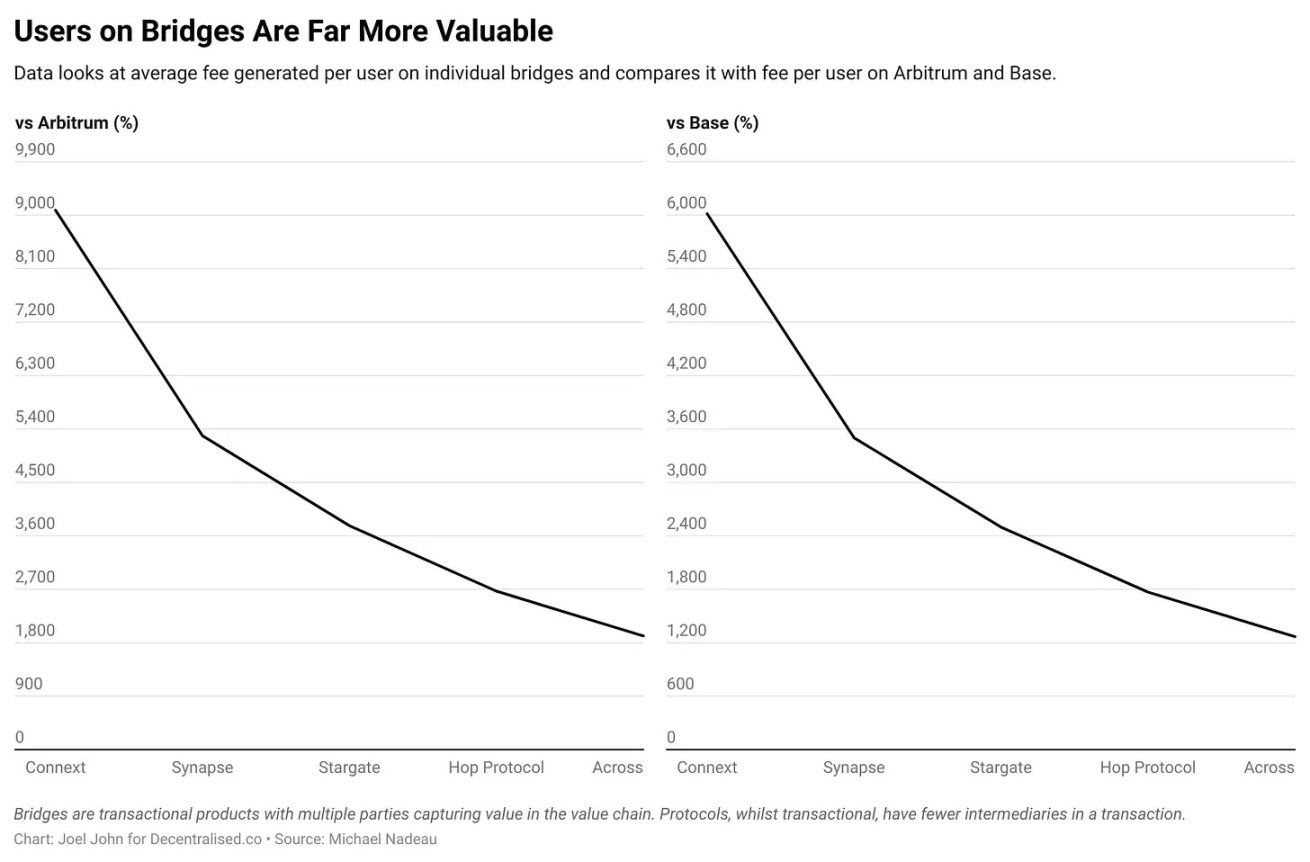
Today, ordinary users on cross-chain bridges are more valuable than ordinary users on L2. The value created by an average user of Connext is 90 times that of an Arbitrum user.
- Currency routers like cross-chain bridges may be one of the few product categories in cryptocurrency capable of generating meaningful economic value.
- As long as transaction fees remain too high, we may not see users turning to L1s like Ethereum or Bitcoin. Users can directly join L2s (like Base), or there may be cases where users only switch between low-cost networks.
Another way to measure the economic value of cross-chain protocols is to compare them with decentralized exchanges. Think about it: both primitives serve similar functions. They enable tokens to transfer from one form to another. Exchanges allow tokens to transfer between assets, while cross-chain bridges allow tokens to transfer between blockchains.
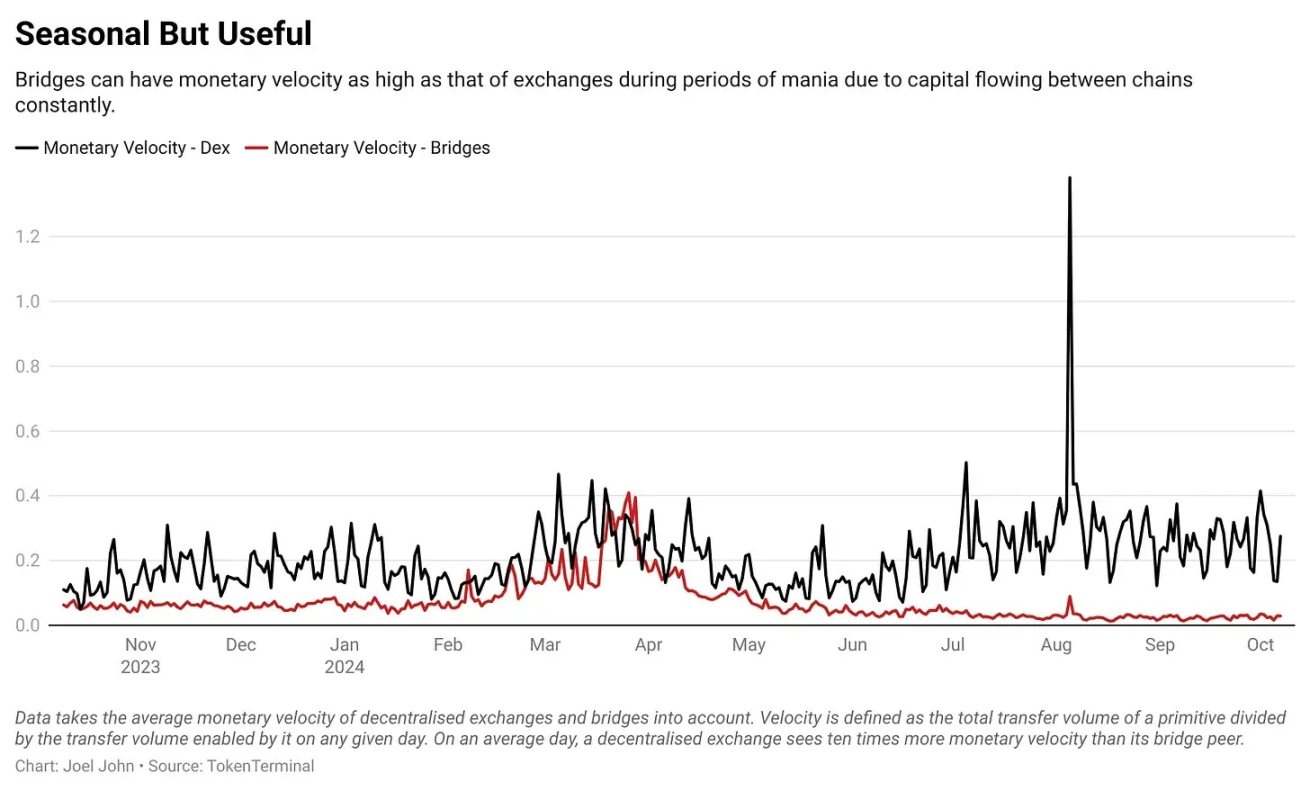
The above data applies only to decentralized exchanges on Ethereum.
Here, I avoid comparing fees or revenues. Instead, I am interested in capital turnover. It can be defined as the number of times capital flows between the smart contracts owned by cross-chain bridges or decentralized exchanges. To calculate it, I will divide the transfer volume of cross-chain bridges and decentralized exchanges on any given day by their TVL.
As expected, the velocity of currency is much higher for decentralized exchanges, as users trade assets back and forth multiple times within a day.
However, interestingly, when you exclude large L2 native bridges (like those of Arbitrum or Optimism), the velocity of currency is not too far off from that of decentralized exchanges.
Perhaps in the future, we will have cross-chain bridges that limit capital quotas, focusing instead on maximizing returns by increasing capital turnover. That is to say, if a cross-chain bridge can transfer capital multiple times in a day, it will be able to generate higher returns.
Are Cross-Chain Bridges Routers?
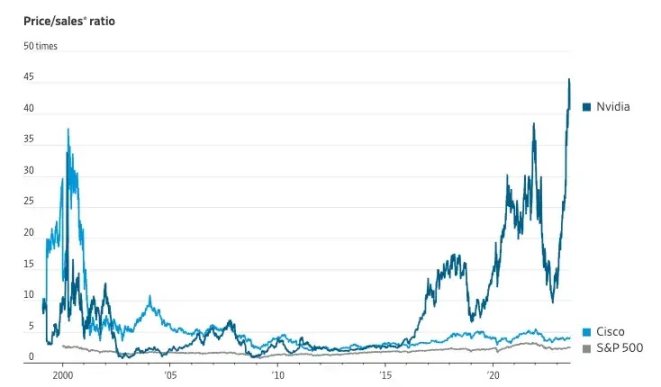
Source: The Wall Street Journal
If you think the influx of venture capital firms into the "infrastructure" space is a new phenomenon, let’s take a look back at the past. Back in the 2000s, when I was a young boy, many people in Silicon Valley praised Cisco. The logic at the time was that as traffic through internet channels increased, routers would capture a significant portion of that value. Just like today’s NVIDIA, Cisco was a high-priced stock because they built the physical infrastructure that supported the internet.
Cisco's stock peaked at $80 on March 24, 2000. As of the writing of this article, it trades at $52 and has never returned to its peak. Writing this article during the Memecoin frenzy makes me ponder to what extent cross-chain protocols can capture value. They have network effects, but it may be a winner-takes-all market. This market increasingly leans towards intent and solutions, with centralized market makers completing orders in the backend.
Ultimately, most users do not care about the level of decentralization of the cross-chain bridge they use; they care about cost and speed.
The development of cross-chain bridges has reached a preliminary maturity, and we have seen various methods to solve the age-old problem of transferring assets across chains. The main driver of change is chain abstraction: a mechanism for transferring assets across chains where users are completely unaware that assets have been transferred.
Another factor driving the increase in transaction volume is innovation in product distribution or positioning. Last night, while exploring Memecoins, I noticed that IntentX is using intent to package Binance's perpetual contract market into decentralized exchange products. We also see that cross-chain bridges for specific chains are continuously evolving to enhance product competitiveness.
Regardless of the approach taken, it is clear that, like decentralized exchanges, cross-chain bridges are hubs through which a large amount of monetary value flows. As a primitive technology, they will continue to exist and evolve. We believe that niche-specific cross-chain bridges (like IntentX) or user-specific cross-chain bridges (like those enabled by chain abstraction) will be the main drivers of growth in the industry.
Shlok added a nuance while discussing this article, noting that past routers never captured economic value based on the amount of data they transmitted. You could download TBs or GBs, and the money Cisco made did not differ. In contrast, cross-chain bridges earn money based on the number of transactions. Therefore, their fates may not be the same.
Currently, it is safe to say that the situation we see with cross-chain bridges is consistent with the physical infrastructure of routing data on the internet.
免责声明:本文章仅代表作者个人观点,不代表本平台的立场和观点。本文章仅供信息分享,不构成对任何人的任何投资建议。用户与作者之间的任何争议,与本平台无关。如网页中刊载的文章或图片涉及侵权,请提供相关的权利证明和身份证明发送邮件到support@aicoin.com,本平台相关工作人员将会进行核查。


