Conveying the Way of Trading, Enjoying a Wise Life. Having Standards in Mind Prevents Confusion.
The price of Bitcoin has once again returned to the level of 60,600. What we anticipated, the double golden cross resonance pattern at the weekly level for Bitcoin throughout September and even into early October, ultimately did not materialize. If such a pattern were to appear, it would mean that Bitcoin would establish a new upward trend. Since it did not appear, our positions cannot reach our target for increasing positions, nor is there a willingness to do so. So what will happen to the price of Bitcoin next? Will it return to the lower boundary of the channel again?

The weekly MACD indicator has been oscillating around the 0 axis for 4 to 5 weeks at this position, but there has been no golden cross. The absence of a golden cross means that Bitcoin cannot confirm a new upward trend. However, the second condition is that its 5-week moving average and 10-week moving average have formed a golden cross above the 30-week moving average, but it has not stood above the upper boundary of the channel, which is above 66,000 USD. Therefore, among the three conditions, only one has been met. Ultimately, Bitcoin still retreated under strong pressure. Additionally, in last week's candlestick combination, there was a bearish candlestick pattern. This situation at the upper boundary of the channel is very similar to the bearish candlestick patterns formed at the upper boundary of previous Bitcoin channels. Therefore, Bitcoin is likely to face more difficulties ahead and may test the lower boundary of the channel again. Since Bitcoin's price has fallen below the daily life line of 61,800 USD, those with heavy positions must control their positions.

At the monthly level, at the beginning of October, the 1st closed out the entire monthly line for September. From the monthly chart perspective, our standard is that only by breaking through the upper boundary of the channel at this point can Bitcoin start a new upward trend. In past bull and bear markets, Bitcoin's price only starts a new upward trend after breaking through the upper boundary of the downward channel. The prolonged failure to break through means that the conditions for a new upward trend are not met.
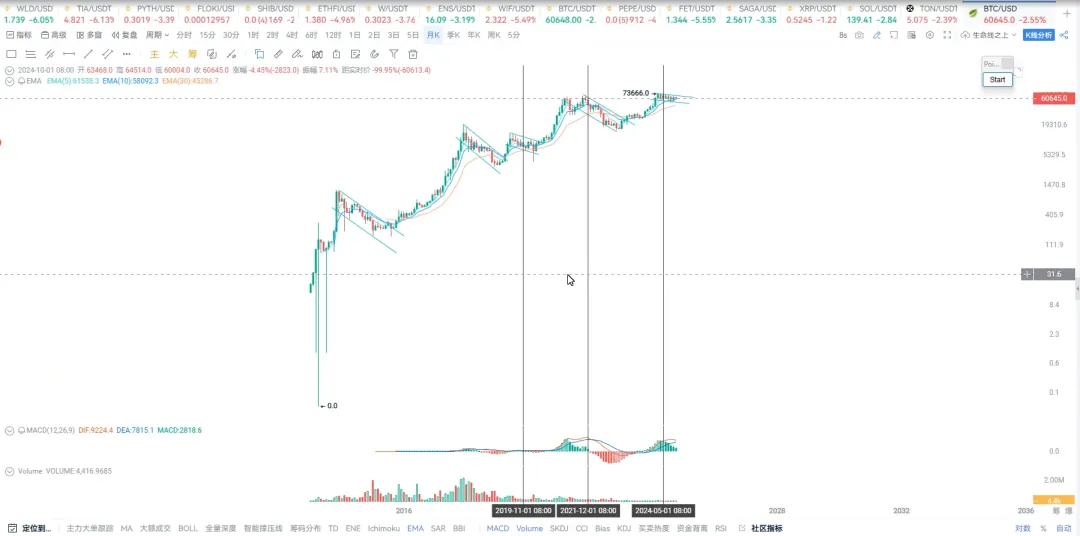
We can look back to 2015, when Bitcoin's price touched a double bottom and then broke through the upper boundary of the channel. In 2017 and 2018, after the bear market ended, it also broke through the upper boundary and crossed above the 30-month moving average. This occurrence also signifies the beginning of a new upward trend.
Including the event on March 12, it also formed an upward breakthrough after retracing to the 30-month moving average, breaking through the downward trend line. Looking at several bull and bear markets, we can find that this time Bitcoin's price is above the 30-month moving average, and there may be a small breakthrough at this position. This kind of breakthrough is very similar to the bear market that followed the small bull market in 2019. In that market, Bitcoin's price was above the 30-month moving average. Although March 12 fell below the 30-month moving average, the following month it recovered and welcomed a breakthrough. This time, Bitcoin's price is also above the 30-month moving average. Currently, it has not touched the 30-month moving average, as it did in 2018-2019. Therefore, it may further test the lower boundary of the channel or even the 30-month moving average. As for whether it can reach that point, we do not predict or speculate; we only need to follow the market. Only when Bitcoin's price breaks through this upper boundary can we establish the beginning of a new upward trend.
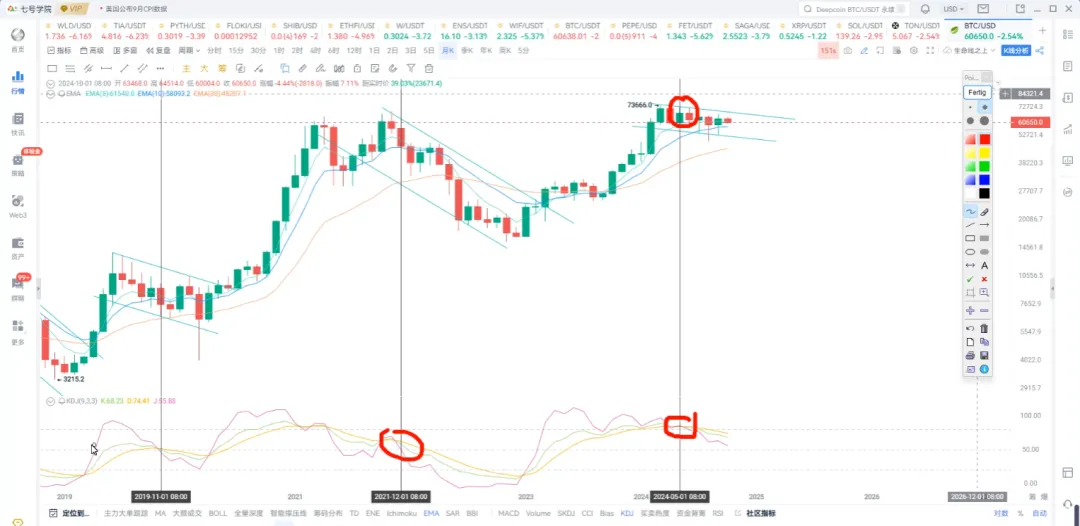
Returning to the monthly chart, we also need to pay attention to its MACD indicator and KDJ indicator. The KDJ indicator is known to be a very sensitive indicator. The larger the cycle, the more pronounced its effect. We can see that Bitcoin's price has formed a death cross at a high position recently. This is very similar to the performance during previous high-position death crosses. This high-position death cross means that Bitcoin's J line has actually returned to near the 50 line, still within the bullish control range. However, it has not yet adjusted properly. Yes, so when Bitcoin's J line can return below 20, or when it forms a low-position golden cross again, it will signify the end of a major cycle adjustment. This time, it may not follow the trend of the bear market in 2022; it is very likely to be a phase of adjustment in a small bull market. What we need to focus on is when the KDJ indicator at the monthly level turns upward and forms a golden cross. This is also one of the standards for judging whether a market trend has formed.
Therefore, we patiently wait for Bitcoin's upcoming adjustments. During the downward process, we should still consider positioning at lower prices.

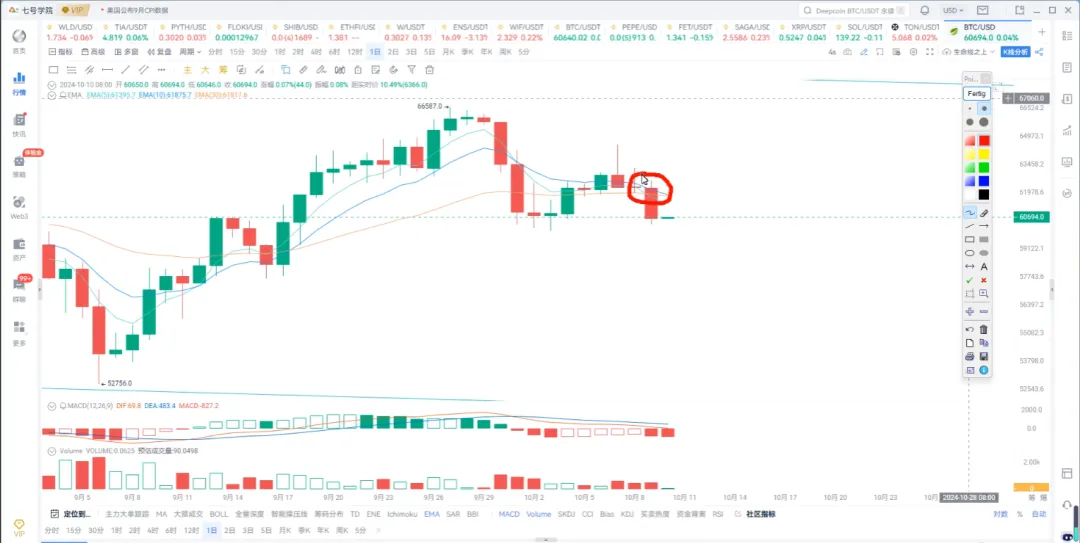
At the daily chart level, we can see that Bitcoin has broken below the 30-day moving average. This position is actually 61,800. Therefore, since it has broken below, if it rebounds to 61,800, you should reduce your position again. Ultimately, it is recommended to control your position at 10-30% or 0-30%.
If you want to learn more, you can contact our assistant to join the VIP.
**Where will the price of Bitcoin go? It is currently near a median line, so there is pressure above and support below. When buying in the middle, if it breaks below 61,000, buying at that point will not be a wise move. Therefore, *control your position and patiently wait for new signals to stop the decline and entry signals.*
免责声明:本文章仅代表作者个人观点,不代表本平台的立场和观点。本文章仅供信息分享,不构成对任何人的任何投资建议。用户与作者之间的任何争议,与本平台无关。如网页中刊载的文章或图片涉及侵权,请提供相关的权利证明和身份证明发送邮件到support@aicoin.com,本平台相关工作人员将会进行核查。


