
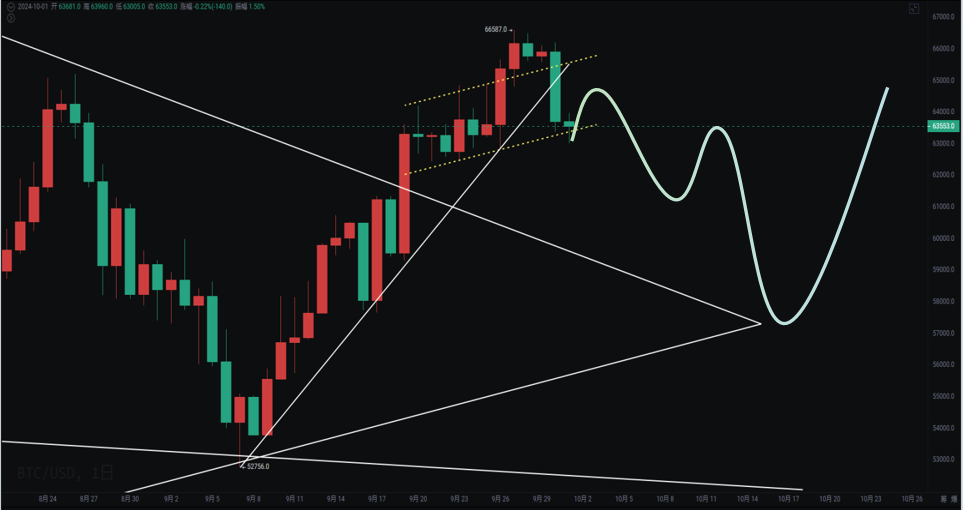
Yesterday, it was said that the rebound to 64,000 was rejected, and the downward trend has not yet been completely reversed. In the evening, it rebounded to 64,478 and then fell, and as of the time of writing, it is still around 62,600. In this range, there has been a crazy washout, knocking out the highs and continuing to decline.
The A-shares are experiencing severe FOMO. On the first trading day after the National Day holiday, nearly a thousand stocks hit the daily limit during the morning auction, but then opened high and fell low, closing down 4.59%. The Shenzhen Composite Index fell 9.17%, and the ChiNext Index fell 17.15%. After the pullback, it may be a good time to position in index ETFs or sector ETFs.
Last Saturday, Musk publicly supported Trump for the first time in his campaign, stating that only if Trump wins the election can American democracy be preserved. The probability of Trump being elected president on Polymarket has risen to 53.5%. As the election next month approaches, it will have a significant impact on the price of Bitcoin.
Last week, Bitcoin's weekly chart showed a strong sell signal, temporarily supported by the middle band of the Bollinger Bands. If it can hold, it may rebound upwards. If it breaks down this week, there is a high probability of a retest of 56,000 to 57,000. The weekly MACD histogram continues to shorten, and the fast and slow lines may cross, but we still need to wait.
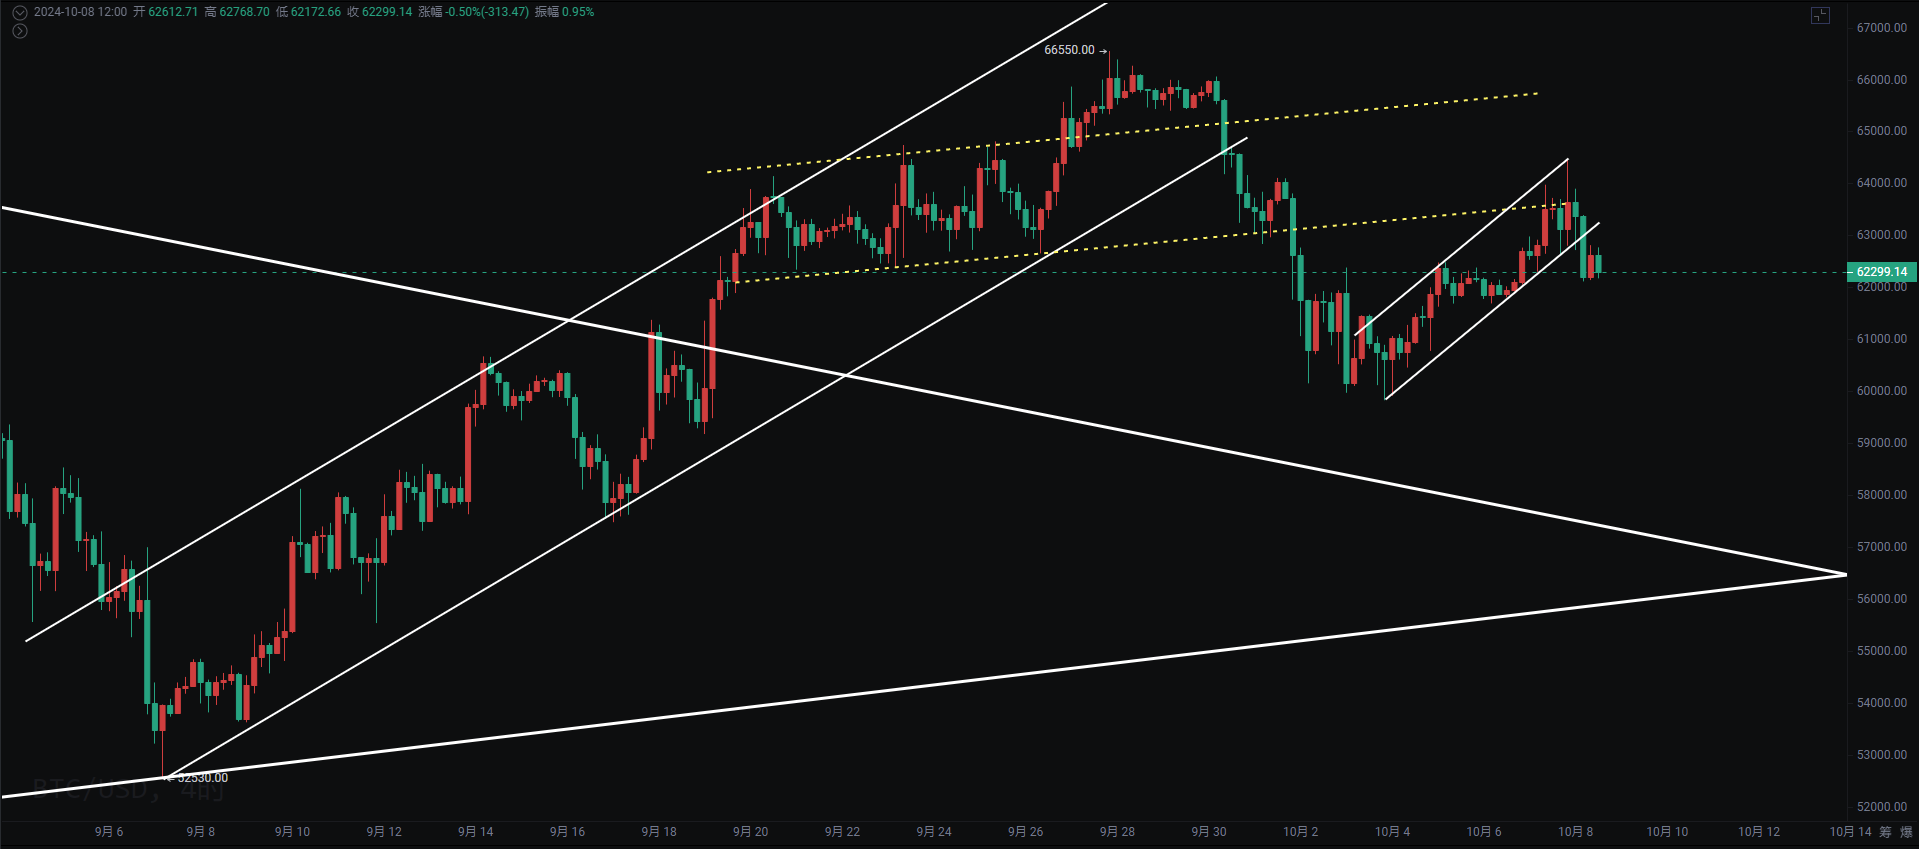
In the 4-hour chart, it has touched the previous channel line twice and then dropped. The upward trend in the 4-hour chart has also been broken. The MACD shows a top divergence, with the first target at 60,000. If it continues to break down, then look for 56,000 to 57,000 to complete the daily convergence triangle retest confirmation.
Support: Pressure:
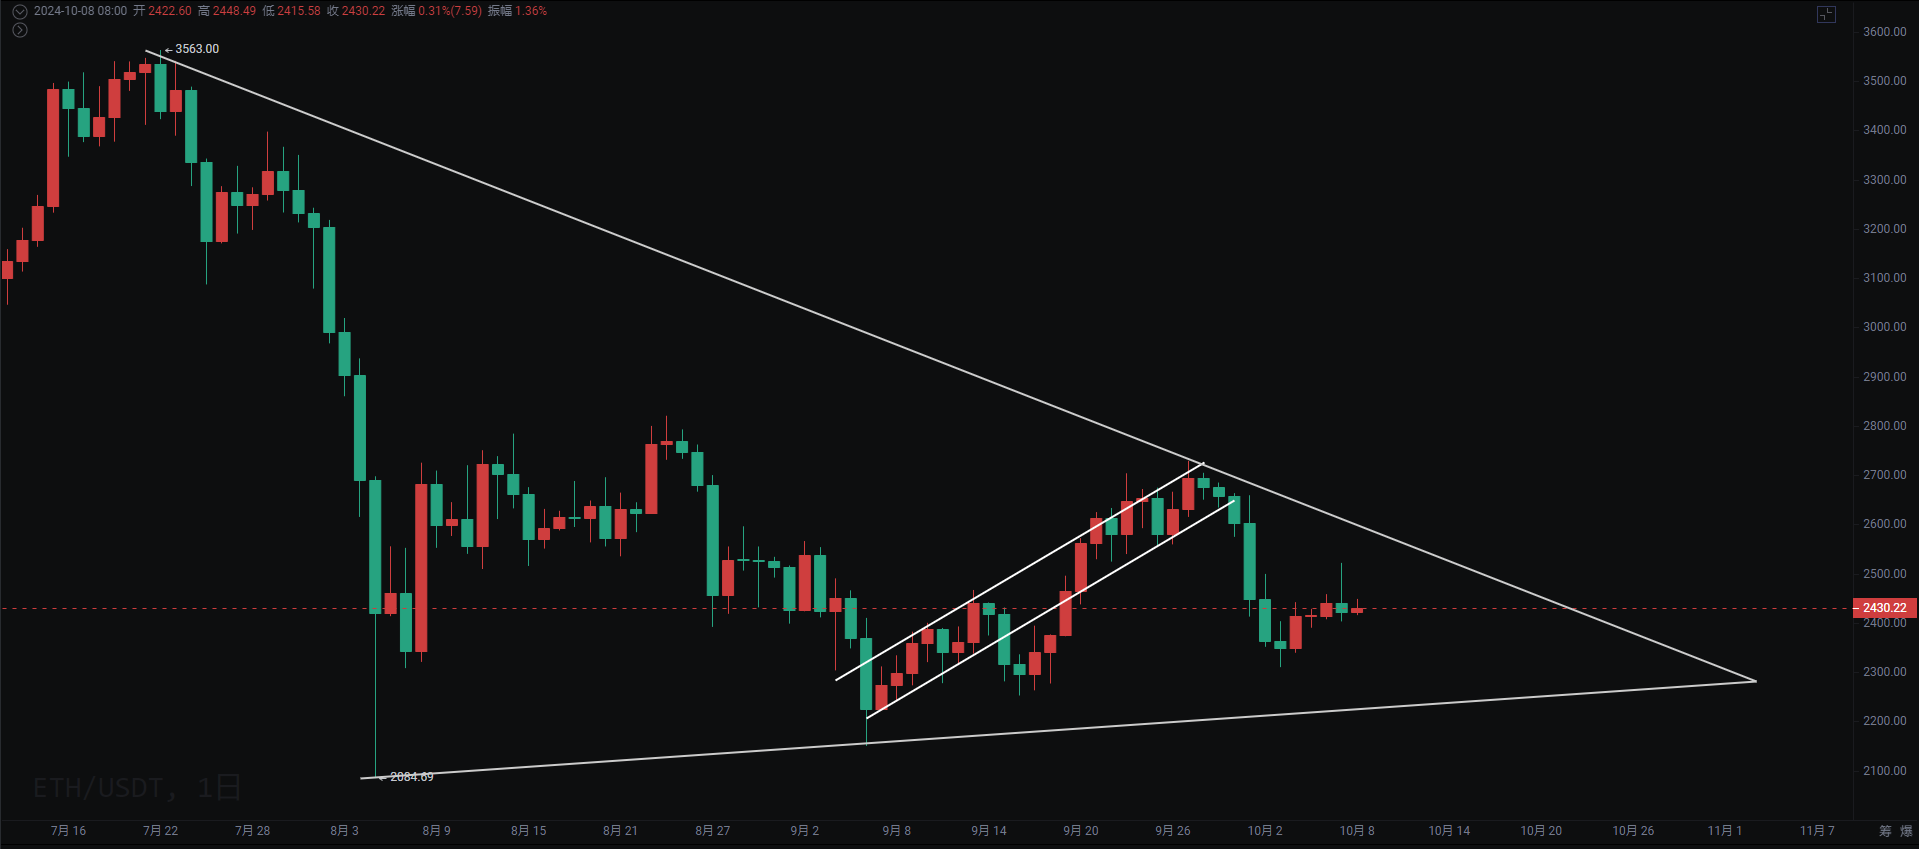
Ethereum spiked to 2,521 and then continued to decline. The downside space is limited, with 2,250 to 2,310 being relatively important support levels. The 4-hour upward channel has been broken, and there is a chance to retest around 2,300.
The ETH/BTC exchange rate has been oscillating narrowly around 0.038 for five consecutive days, and the weekly level shows a bearish arrangement, indicating signs of further breakdown. Note that altcoin prices are quite volatile.
Support: Pressure:
If you like my views, please like, comment, and share. Let's navigate through the bull and bear markets together!!!
The article is time-sensitive and for reference only, with real-time updates.
Focusing on K-line technical research, sharing global investment opportunities. Official account: Trading Prince Fusu

免责声明:本文章仅代表作者个人观点,不代表本平台的立场和观点。本文章仅供信息分享,不构成对任何人的任何投资建议。用户与作者之间的任何争议,与本平台无关。如网页中刊载的文章或图片涉及侵权,请提供相关的权利证明和身份证明发送邮件到support@aicoin.com,本平台相关工作人员将会进行核查。


