Conveying the Way of Trading, Enjoying a Wise Life.

Today, let's talk about the price trend of ETH. At the beginning of October, we are closing the monthly line. From this perspective, the closing of ETH is very poor.
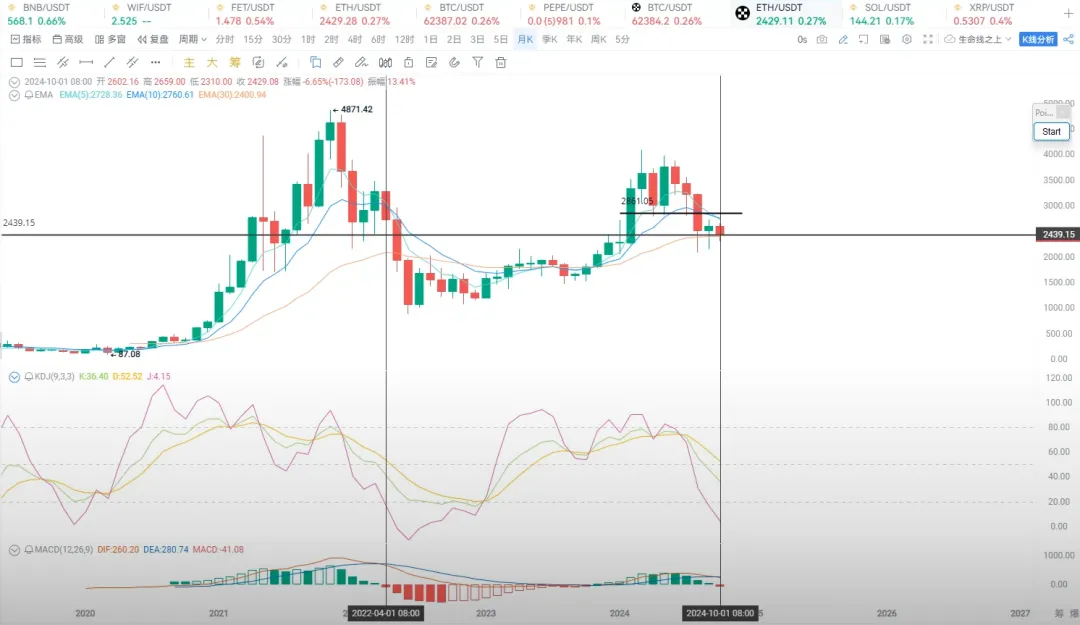
When discussing the medium to long-term cycle, we must pay attention to two important indicators, KDJ and MACD. From a long to medium-term perspective, the KDJ indicator will have greater guiding significance. Currently, the trend of its J line has reached a relatively low area. The last time it reached this position was in April 2022, when its price was above the 30-month moving average, corresponding to a price around 3,000 USD. At that time, a death cross between the 5-month and 10-month lines had just formed, marking the early stage of a bear market. After that, it continued to decline for two months before starting to bottom out, and then it consolidated for more than half a year.
The monthly closing level of ETH, with the J line at this position, has dipped below, corresponding to the K line on this K line. This K line is currently the K line for October, supported by the 30-month moving average. Therefore, whether this position can hold is also crucial. If this level breaks, it indicates that it will continue to move downward, possibly for two or three K lines, just like in April 2022. Of course, it broke the 30-month moving average in May; can it break in October? We actually do not know. Because at the position of the 30-month moving average, there is indeed significant support.
Even without considering the moving average, just looking at the K line, in February 2024, this long bullish monthly line had its lowest opening point at 2,260 USD. ETH's closing this time is still above 2,260 USD and has not broken below.
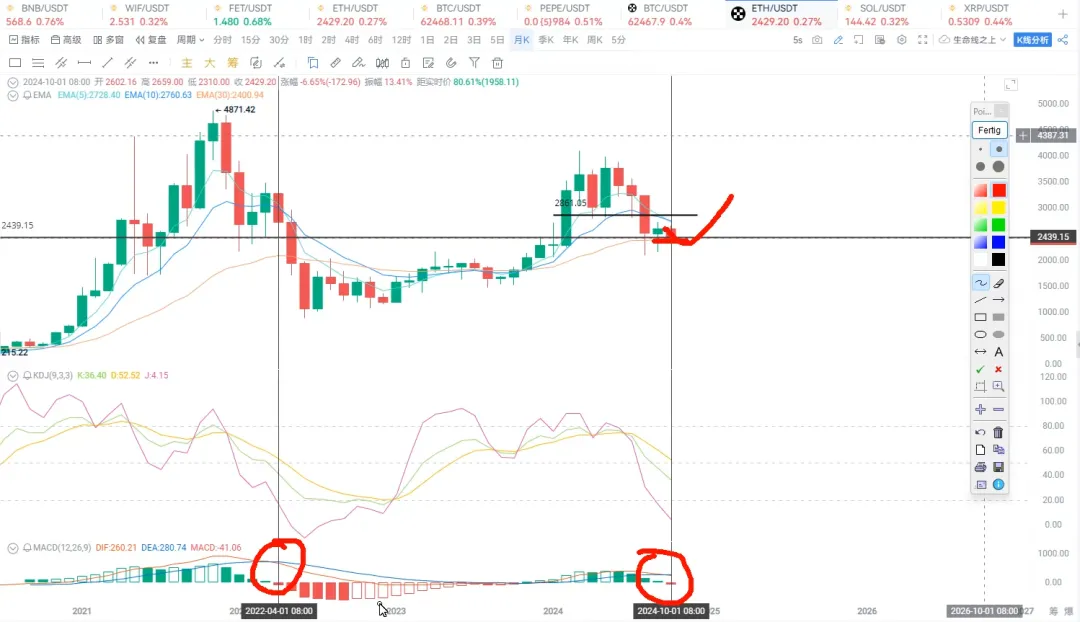
So, is there a possibility of an upward reversal at this position? That is, can it start to reverse upwards from the 2,260 position? If there is such a possibility, then the corresponding MACD indicator's death cross should turn upwards. In the last bear market, the death cross also just started at this position. So, will history repeat itself? Of course not, but will it replay? It might replay.
However, the historical trend serves merely as a reference; it is not suitable for the current stage of its trend. Any historical market is caused by the environment at that time. Therefore, during the phase of the Federal Reserve's interest rate cuts, the occurrence of a monthly death cross is different from the death cross during the bear market when the Federal Reserve was raising interest rates in 2022.
So, is there a possibility for ETH's price to start turning upwards from this position? Of course, this is what we hope for. It must hold the 2,260 position; if it cannot hold, it will definitely be difficult. Therefore, we must be cautious in our position control. My view is 30% - 60%.
For ETH, we focus on 2,260. Because its 5-month and 10-month lines have also formed a death cross. So, if it can stabilize at this position or break through 2,840, then ETH will also show an upward reversal trend. Therefore, the key points are two: one is the support at 2,260, and the other is the pressure at 2,840. Any breakthrough from either side will follow the trend and move in its original direction.

From the weekly chart level, we also see that its KDJ indicator has a golden cross, but not on the MACD. The moving average indicator, the 30-week moving average, is moving downwards. This position is 2,840. As mentioned earlier, the key is that its weekly closing line is engulfing, indicating that ETH is showing exceptionally weak performance. If you are heavily invested in ETH, it may be relatively torturous right now. If you feel tortured, you can think about how Sun Yuchen's cost for ETH is between 3,000 and 3,500 USD; when will he break even? Who knows?
Currently, from the weekly level, ETH is forming a double top structure; this is one top, this is the second, and this is the neckline. Therefore, whether this neckline breaks will become an important key point for determining ETH's future trend.
Some say we need to look at BTC's price; of course, ETH cannot play a decisive role in the market. What is more important? We still need to see how BTC's future trend will be.

Returning to the daily chart level, ETH closed yesterday with a K line that looks very weak, with significant selling pressure above. Where is the money going? At least, it is not here. Therefore, everyone is currently more in a wait-and-see attitude, which is relatively wise. So, at this stage, hold a portion of your position, but do not go heavy. When should you go heavy? We just mentioned looking at BTC's price. So, what standards must BTC meet for us to satisfy our expectations and form a heavy position allocation?
Tomorrow, Wednesday, we will have a VIP exclusive course. If you want to learn more, you can contact our assistant to join the VIP.
免责声明:本文章仅代表作者个人观点,不代表本平台的立场和观点。本文章仅供信息分享,不构成对任何人的任何投资建议。用户与作者之间的任何争议,与本平台无关。如网页中刊载的文章或图片涉及侵权,请提供相关的权利证明和身份证明发送邮件到support@aicoin.com,本平台相关工作人员将会进行核查。