
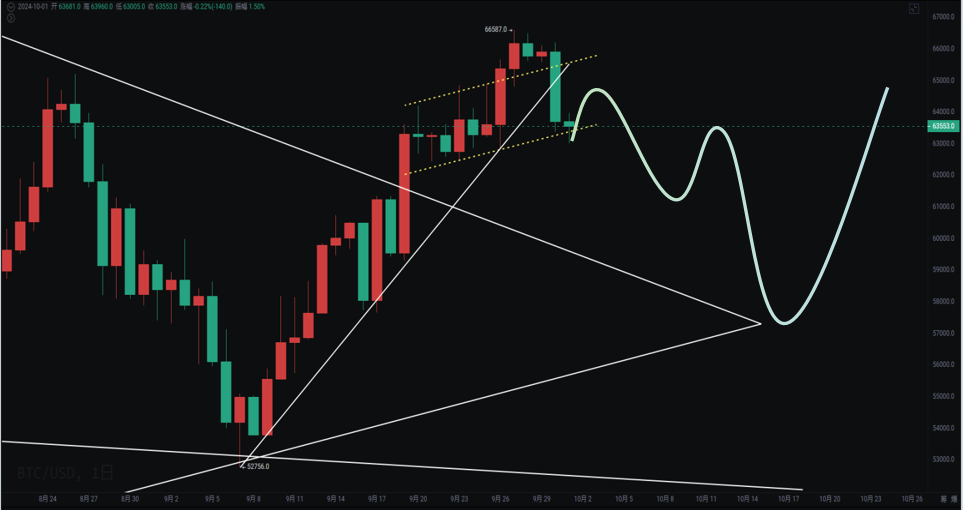
Since September 30, the prediction came true, warning of a rapid drop in the Japanese stock market, which fell sharply on October 1, indicating a false breakout on the daily chart. The downward trend is not yet complete, with a pullback target looking at 56,000 to 57,000. After the weekly close fell below the middle Bollinger Band, it rebounded but was rejected again at 64,000. The OBV crossed above the yellow line, and the MACD histogram continues to shorten, with the fast and slow lines still above the zero line. However, before crossing the zero line, there are uncertainties with the fast and slow lines above the zero line. Additionally, the recent surge in the A-shares has made friends in the crypto circle eager to switch to A-shares, which has indirectly withdrawn liquidity from the crypto market.
A-shares are indeed a value pit, but the rapid rise has increased uncertainty. For those who have rarely ventured into the stock market, it may be better to invest in index ETFs or sector ETFs rather than buying individual stocks, especially since some people are shifting to Hong Kong stocks. The Hong Kong market has no limit on price increases or decreases; while the overall market is performing well, individual stocks still experience significant volatility. Any investment market is the same; a bull market can be a graveyard for retail investors. Earlier, I saw the US stock market rising and now people are chasing A-shares and Hong Kong stocks.
In my view, the crypto market is also in a high-level adjustment phase, nearing the latter part of the fluctuation. The window for a change is getting closer. It is advisable to allocate 20-30% to A-shares or Hong Kong stocks and only enter or increase positions after a significant drop. Don't end up picking sesame seeds and losing watermelons; no market is easy to navigate.
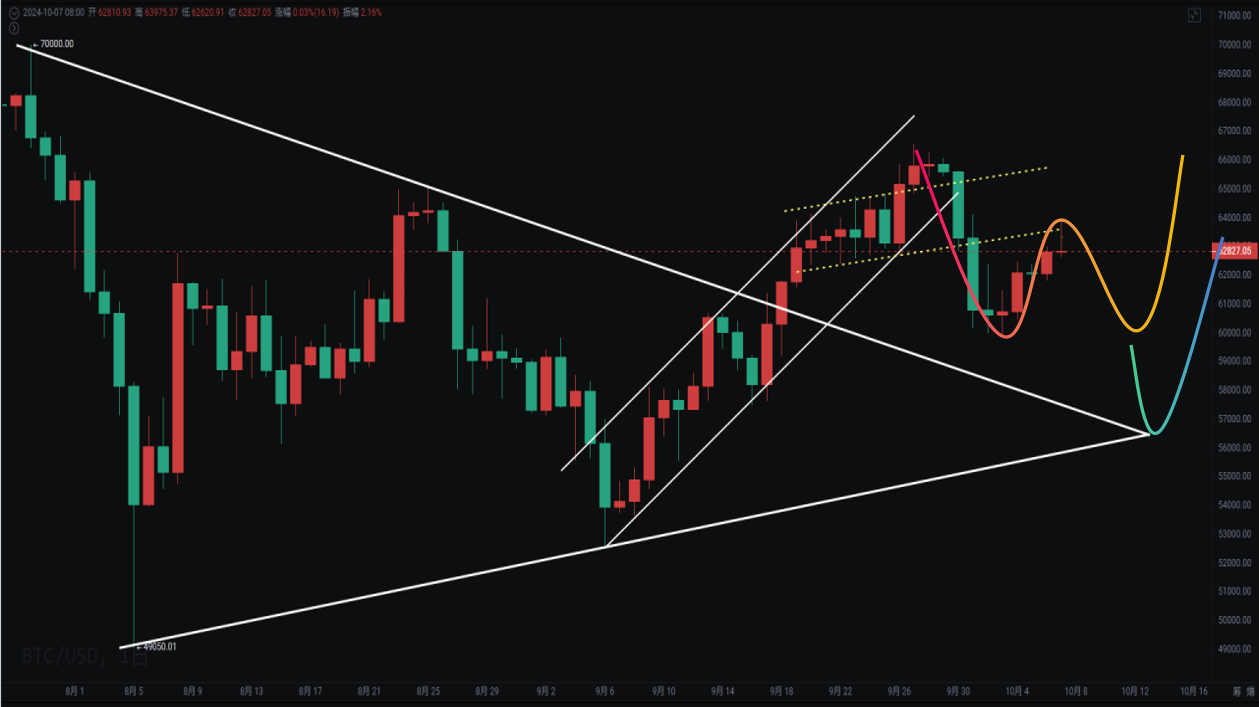
Bitcoin has broken through 65,000 to 66,500, forming a false breakout before falling. Currently, it is still testing the resistance at 64,000 and has pulled back. The 4-hour chart has also formed a divergence, with a rise of nearly 1,600 points in the morning, only to drop back in the afternoon. It is currently testing the 4-hour upward trend line. If it falls below 62,300, there could be a downward wave looking at 56,000 to 57,000. If 62,300 can effectively support and rebound, there may still be opportunities for a rebound.
Support: Resistance:
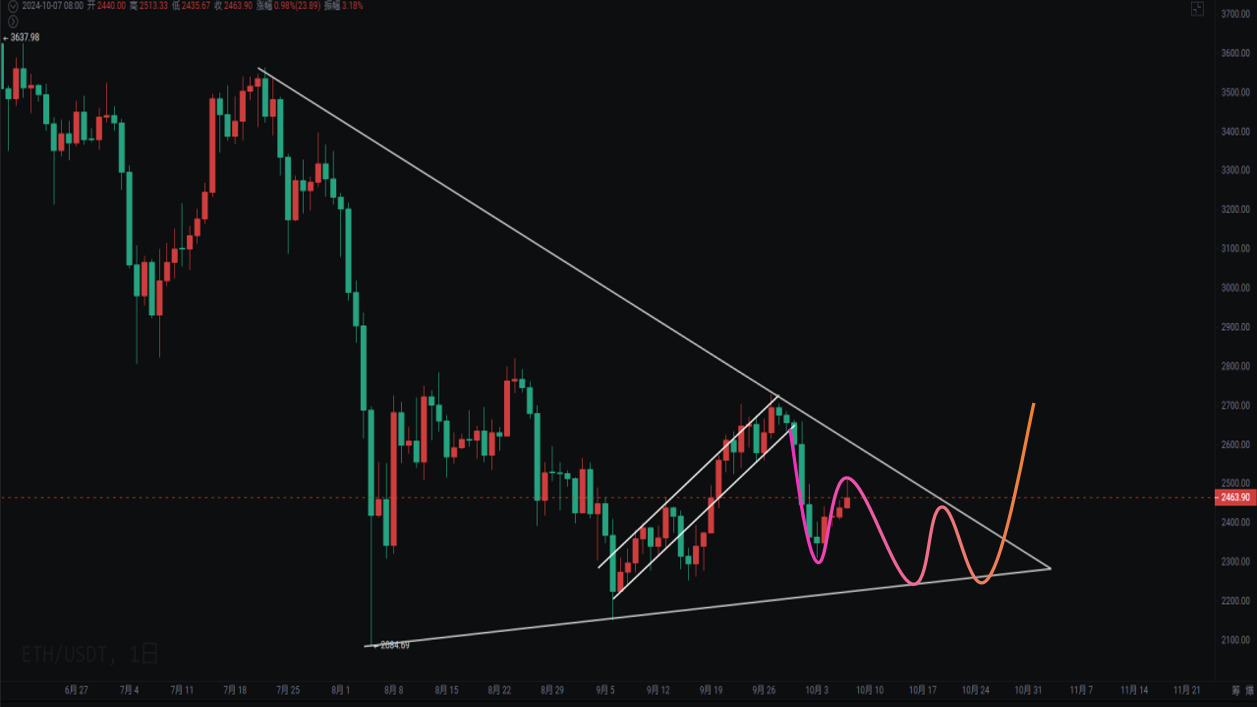
Ethereum's weekly close is still under pressure below 2,800, with support at 2,150 to 2,250. The price has been operating below the lower Bollinger Band. This morning, it dipped to 2,512 and has since pulled back. We still need to wait for a pullback followed by a rebound to see if it can stand above the middle Bollinger Band. The ETH/BTC exchange rate has support around 0.038, and many altcoins that rebounded strongly earlier still present opportunities for accumulation, but we need to wait for the overall market to pull back adequately.
Support: Resistance:
If you like my views, please like, comment, and share. Let's navigate through the bull and bear markets together!!!
The article is time-sensitive and for reference only, with real-time updates.
Focusing on K-line technical research, sharing global investment opportunities. Public account: Trading Prince Fusu

免责声明:本文章仅代表作者个人观点,不代表本平台的立场和观点。本文章仅供信息分享,不构成对任何人的任何投资建议。用户与作者之间的任何争议,与本平台无关。如网页中刊载的文章或图片涉及侵权,请提供相关的权利证明和身份证明发送邮件到support@aicoin.com,本平台相关工作人员将会进行核查。


