Cryptocurrency News
October 7 Highlights:
1. Law enforcement agencies from the US, UK, and Australia jointly impose sanctions on key members of the Evil Corp organization.
2. The US government files a complaint seeking to seize assets of North Korean hackers.
3. Tether celebrates the 10th anniversary of USDT issuance, launching a documentary showcasing its mission for financial inclusivity.
4. Data: Tokens such as APT, EIGEN, and NEON are set to unlock next week, with APT unlocking valued at approximately $100 million.
5. UniSat releases its Q4 roadmap, including activating runes on FB, supporting CAT20, and updating PizzaSwap.
Trading Insights
Looking back at any previous bull market, it has always been a simple process: 1. First: Initially, there is a surge, and everyone gets carried away; some bold individuals borrow money to invest in stocks, hoping to get rich overnight. 2. Second: Subsequently, market enthusiasm soars, news reports flood in, and it seems everyone can become a stock god, ignoring the existence of risks. 3. Third: Investors flock in, trading volume surges, market sentiment peaks, and everyone feels they have grasped the tail of wealth. 4. Fourth: Then, stock prices begin to fluctuate; slight pullbacks are seen as buying opportunities, and people firmly believe the bull market won't end easily. 5. Fifth: However, the market gradually shows divergence, with some stocks starting to plummet, and investors begin to feel pressure. 6. Sixth: Some people start to take profits, while more choose to hold on, hoping for another market rise. 7. Seventh: As regulatory policies tighten, market sentiment begins to cool, and stock price fluctuations intensify. 8. Eighth: Suddenly, a negative news item emerges, panic spreads in the market, and stock prices experience a cliff-like drop. 9. Ninth: Investors begin to panic sell, and the once abundant confidence turns into endless worry. 10. Tenth: The market falls into deep adjustment, many are trapped, and dreams of wealth turn into real losses. 11. Eleventh: Experts and analysts start to express their views; some are bullish, some are bearish, leaving investors even more confused. 12. Twelfth: After a period of adjustment, the market gradually returns to rationality, but many have suffered heavy losses. 13. Thirteenth: Ultimately, the bull market ends amid sighs, leaving behind lessons and reflections, as well as a new round of market momentum ready to take off. Bull markets are like dreams, with unpredictable ups and downs; only by maintaining rationality can one navigate steadily through the waves of the stock market.
LIFE IS LIKE
A JOURNEY ▲
Below are the real trading signals from the Big White Community this week. Congratulations to those who followed along; if your trades are not going well, you can come and test the waters.
The data is real, and each trade has a screenshot from when it was sent out.
Search for the public account: Big White Talks About Coins
BTC
Analysis
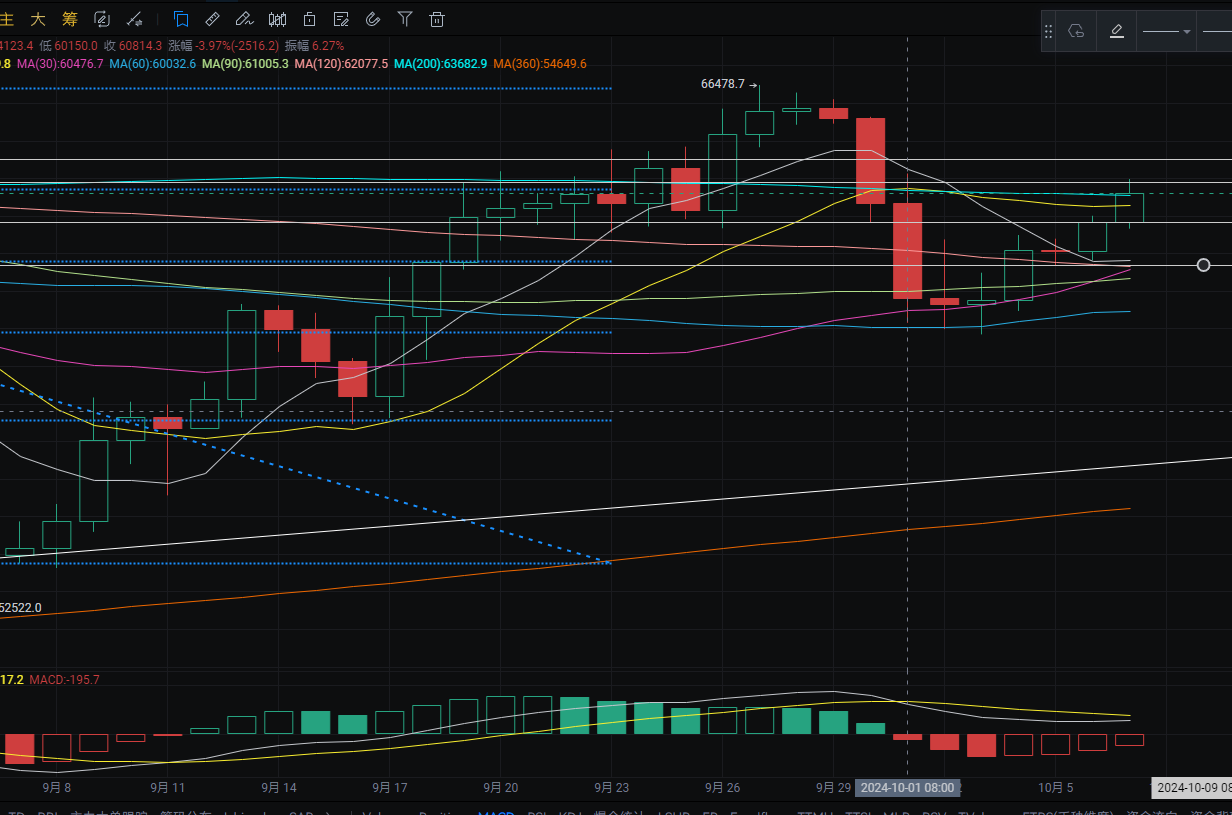
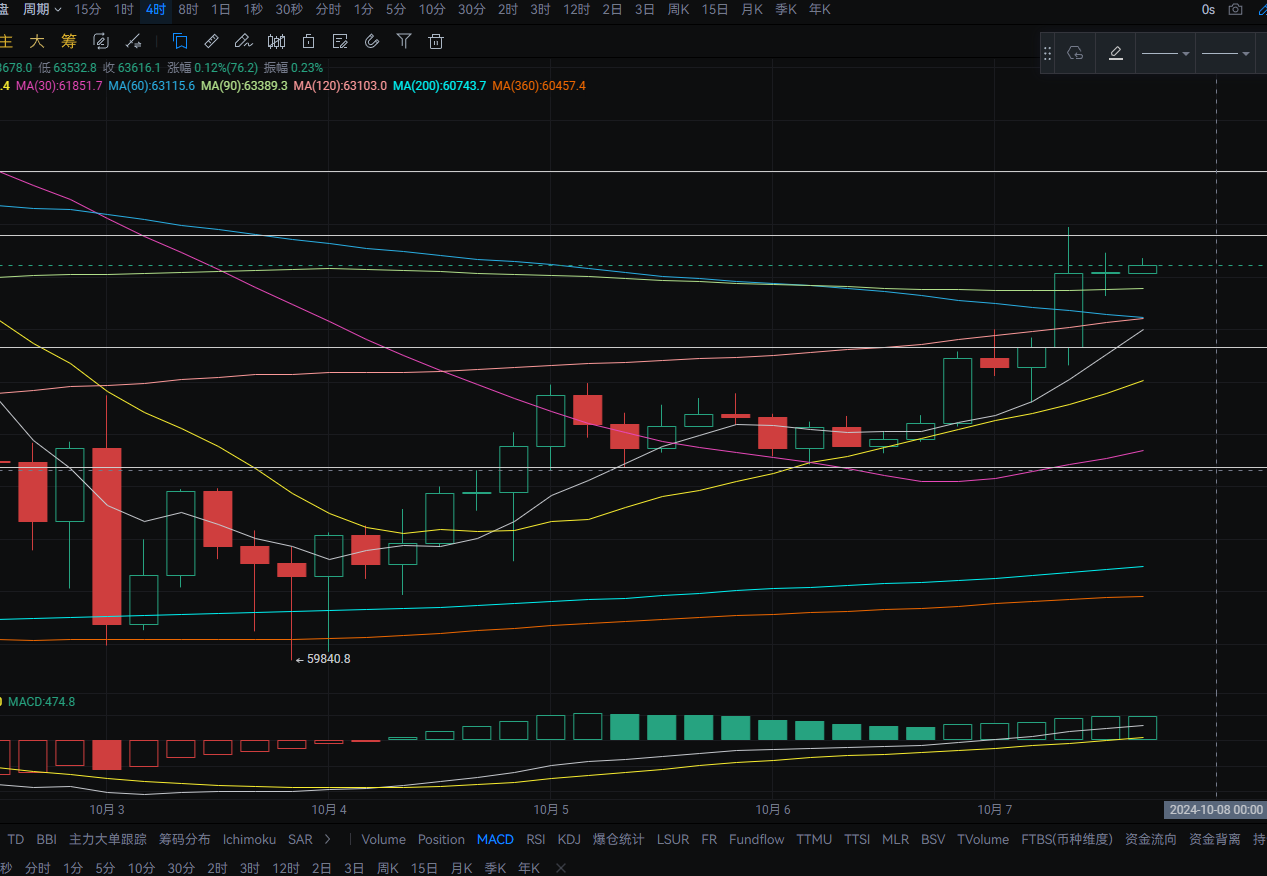
Bitcoin's daily chart showed a rebound yesterday, bouncing from a low of around 61800 to a high of around 63000, closing near 62800. The upper resistance is near MA200; a breakout would target around 64500. A rebound to this area could be a good opportunity to short. The lower support is near MA120. MACD shows a decrease in bearish momentum, with signs of a golden cross forming. On the four-hour chart, the lower support is near MA7; a break below would target around MA30. A pullback could be a good opportunity to go long. MACD shows an increase in bullish momentum. Short-term targets are around 63700-64500 for shorting, with pullback targets around 62850-61680.
ETH
Analysis
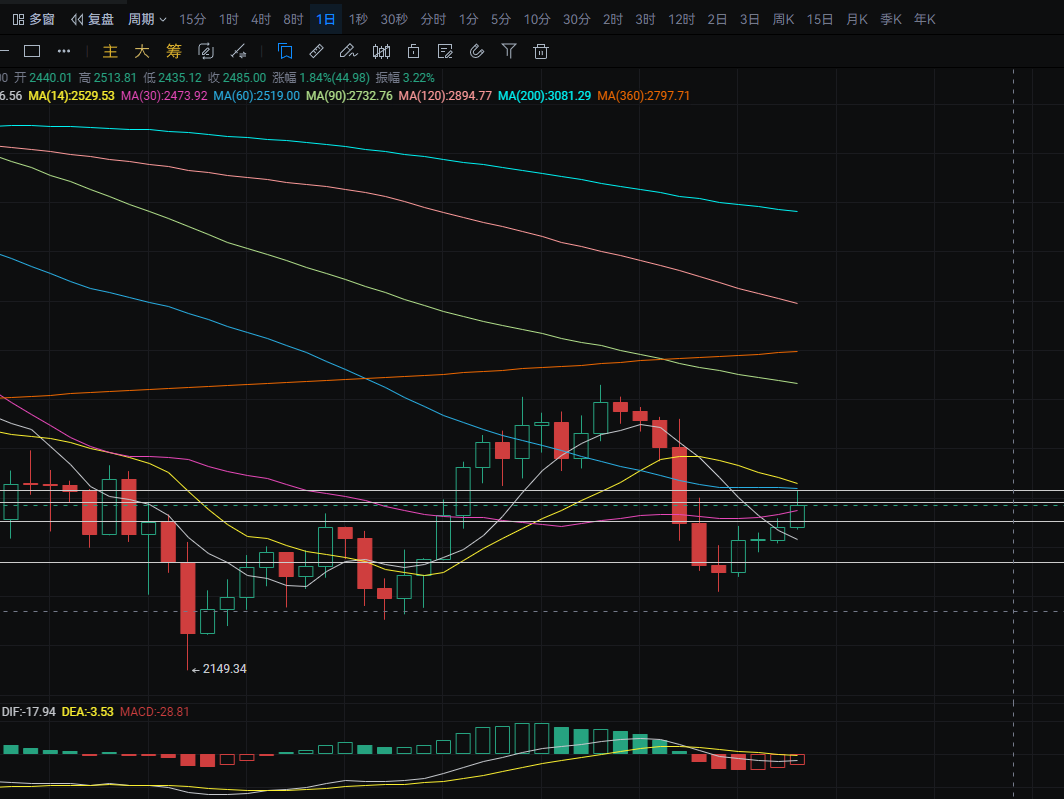
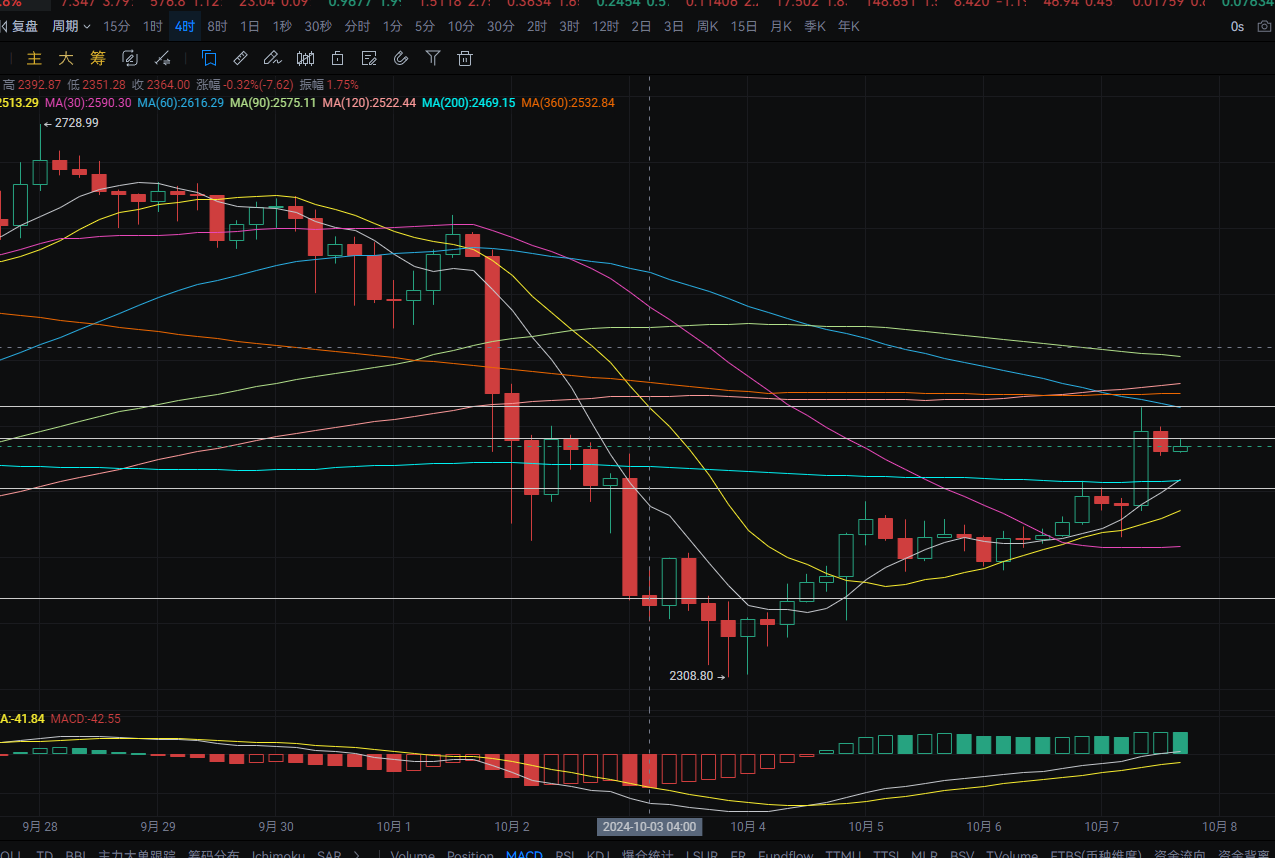
Ethereum's daily chart showed a rebound yesterday, bouncing from a low of around 2405 to a high of around 2460, closing near 2440. The upper resistance is near MA60; a rebound to this area could be a good opportunity to short. The lower support is near MA7. MACD shows a decrease in bearish momentum, with signs of a golden cross forming. On the four-hour chart, the upper resistance is near MA60; a rebound to this area could be a good opportunity to short. The lower support is near MA200; a break below would target around MA30. A pullback could be a good opportunity to go long. MACD shows an increase in bullish momentum. Short-term targets are around 2490-2515 for shorting, with targets around 2452-2368.
Disclaimer: The above content is personal opinion and for reference only! It does not constitute specific trading advice and does not bear legal responsibility. Market conditions change rapidly, and the article may have some lag; if you have any questions, feel free to consult.
免责声明:本文章仅代表作者个人观点,不代表本平台的立场和观点。本文章仅供信息分享,不构成对任何人的任何投资建议。用户与作者之间的任何争议,与本平台无关。如网页中刊载的文章或图片涉及侵权,请提供相关的权利证明和身份证明发送邮件到support@aicoin.com,本平台相关工作人员将会进行核查。


