Daily Share
What happened in the past week? Bitcoin rebounded to 66,500 and then turned down again, currently reaching a low of 59,828, and is now undergoing a 4-hour level decline. Overall, the rhythm is still quite in line with our expectations. Bitcoin started to rebound from 52,550, completing the third 4-hour upward movement in the daily level rebound, ultimately settling around our expected 66,500. It then began a 4-hour level correction.
A few days ago, someone commented that waiting for corrections every day might cause me to miss out on significant market movements. In fact, apart from the one-sided rise from February to March this year, the other months have mostly seen repeated fluctuations. For example, if you went long around 60,000 in September and it rose to 66,498 by the end of September without taking profits, now that it has dropped back to around 60,000, what will you do? If it later drops to around 58,000, what will happen to your long position?
So when will a one-sided trend come, allowing for a confident long hold? I believe it will only appear after Bitcoin breaks through 70,000 again, which will likely trigger a wave of one-sided upward movement.
BTC Mid to Long Term
Daily:
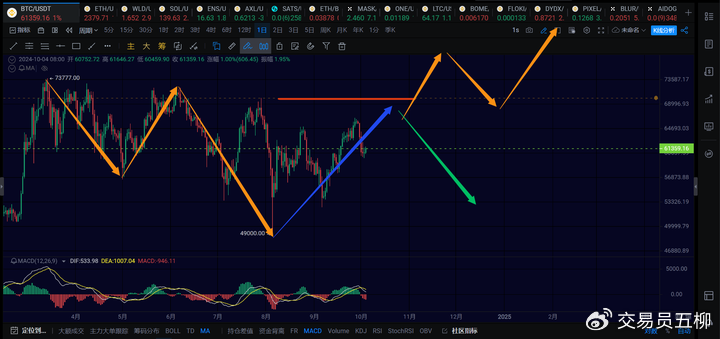
On the daily level, Bitcoin has formed a three-part daily structure with yellow arrows on the left, so from 73,777 to 49,000, Bitcoin can complete a weekly level decline. Now starting from 49,000, it can directly embark on a new weekly upward movement without much issue. However, due to the third part of the daily level decline from 72,000 to 49,000 being significant and not diverging, there is a certain probability that the weekly decline will extend to five parts.
So will the weekly decline extend to five parts, or will it start a new weekly upward movement towards historical highs? Personally, I believe the main point of judgment lies in whether the current daily level rebound can break through 70,000. If the daily level rebound breaks through 70,000, it is highly likely to continue rising to around 76,000 to 80,000. In this case, 49,000 would be the starting point for a new weekly rebound, with the subsequent structure following the yellow arrows on the right side of the above image moving up, down, and up three parts.
If the current daily level rebound still cannot break through 70,000, then it will likely undergo another daily level decline to extend this weekly decline, as indicated by the green arrow in the above image. The new weekly upward movement will only begin after the daily level correction indicated by the green arrow is completed.
Currently, the daily level rebound starting from 49,000 should not be over yet; Bitcoin still needs one more 4-hour level rebound, targeting the 66,500 to 70,000 range.
4H:
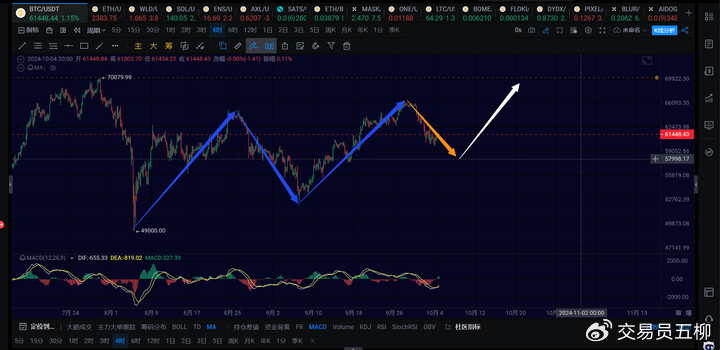
At the 4-hour level, a 4-hour level correction is currently underway. My second expected target for this correction is around 58,000. If it does not effectively break below that, Bitcoin should still have a fifth 4-hour level rebound to reach the 66,500 to 70,000 range, as indicated by the white arrow in the above image. If it breaks below 58,000, there is a certain probability of a daily level correction, but it is not absolute and will depend on subsequent rebound conditions.
Currently, the 4-hour level decline is not yet complete; it is expected that at least one more 1-hour level decline to the 58,000 to 59,500 range is needed before it can potentially end.
BTC Short Term
Due to the rapid changes in the market, this article can only make predictions based on the market conditions at the time of publication. Short-term players should pay attention to the latest market changes, which are merely for reference.
1H:
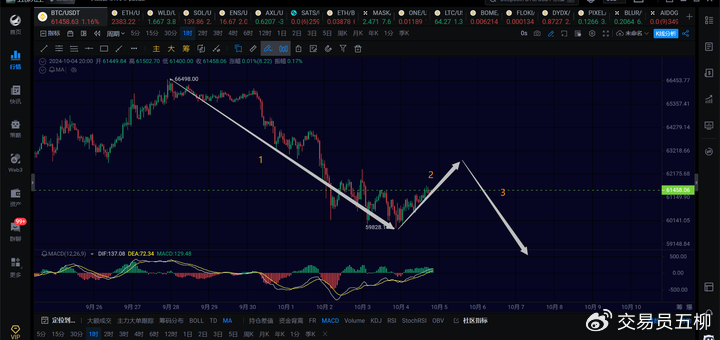
At the 1-hour level, it is almost time for the second 1-hour level rebound, with the expected rebound focusing on around 63,000. After that, there will be a third 1-hour level decline, targeting support around 58,000.
15M:
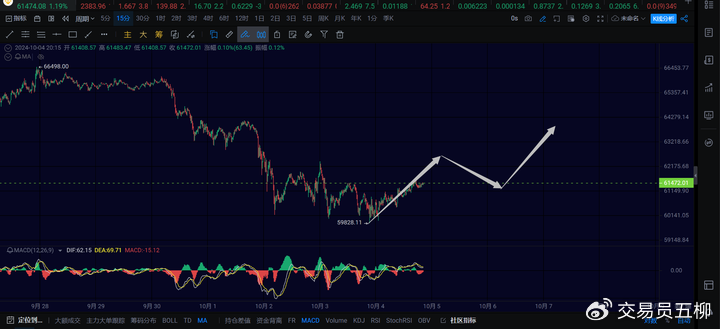
At the 15-minute level, it is still the first 15-minute level rebound, focusing on around 62,000 to 62,500. After that, there will be a second 15-minute level correction and a third 15-minute level rebound.
ETH
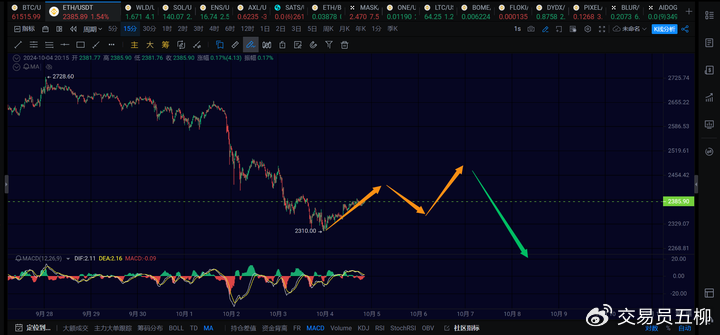
Ethereum should also be undergoing a 1-hour level rebound, currently in the first 15-minute level rebound, looking at around 2,420. Subsequently, there will be a second 15-minute level correction and a third 15-minute level rebound, with the overall 1-hour level rebound focusing on around 2,470 to 2,500. After the 1-hour level rebound is completed, there will still be a 1-hour level decline, targeting around 2,250, as indicated by the green arrow in the above image.
Trend Direction
Weekly Level: The direction is downward, theoretically around 49,000 is about done. Whether it has ended still needs observation, but the probability of starting a weekly rebound is increasing.
Daily Level: The direction is upward, and in the short term, we should continue to look at the 67,000 to 70,000 range.
4-Hour Level: The direction is downward, looking at a 4-hour level correction, with the initial target of 61,000 already broken, and the second target looking at 58,000.
1-Hour Level: The direction is upward, and it is expected that a true 1-hour rebound should occur, looking at around 63,000. After the rebound, it will continue to decline.
15-Minute Level: The direction is upward, focusing on around 62,400.
Feel free to follow my public account for discussion and exchange:

The article is time-sensitive, please pay attention to risks. The views in the article are personal suggestions and for reference only!
免责声明:本文章仅代表作者个人观点,不代表本平台的立场和观点。本文章仅供信息分享,不构成对任何人的任何投资建议。用户与作者之间的任何争议,与本平台无关。如网页中刊载的文章或图片涉及侵权,请提供相关的权利证明和身份证明发送邮件到support@aicoin.com,本平台相关工作人员将会进行核查。