Recently, Bitcoin has dropped from around $66,500 to a low of $59,828 due to the geopolitical tensions in the Middle East. Last night, it staged a defense at the $60,000 mark, repeatedly falling below this level within four hours before recovering. The tug-of-war between bulls and bears has been quite intense, and it wasn't until after 1 AM that a significant increase was observed, briefly breaking through $61,000. As of the time of writing, the price is quoted at $61,350, up 0.98% in the last 24 hours.
The decline in Bitcoin is not necessarily a bad thing for investors, as the current market downturn presents new buying opportunities. With the upcoming presidential election competition between Trump and Harris in the United States, Trump, a Republican candidate who has publicly supported cryptocurrencies multiple times, is currently on par with Harris in terms of winning probability. This also suggests that the market may be poised for a rally.
Bitcoin 4-Hour Chart
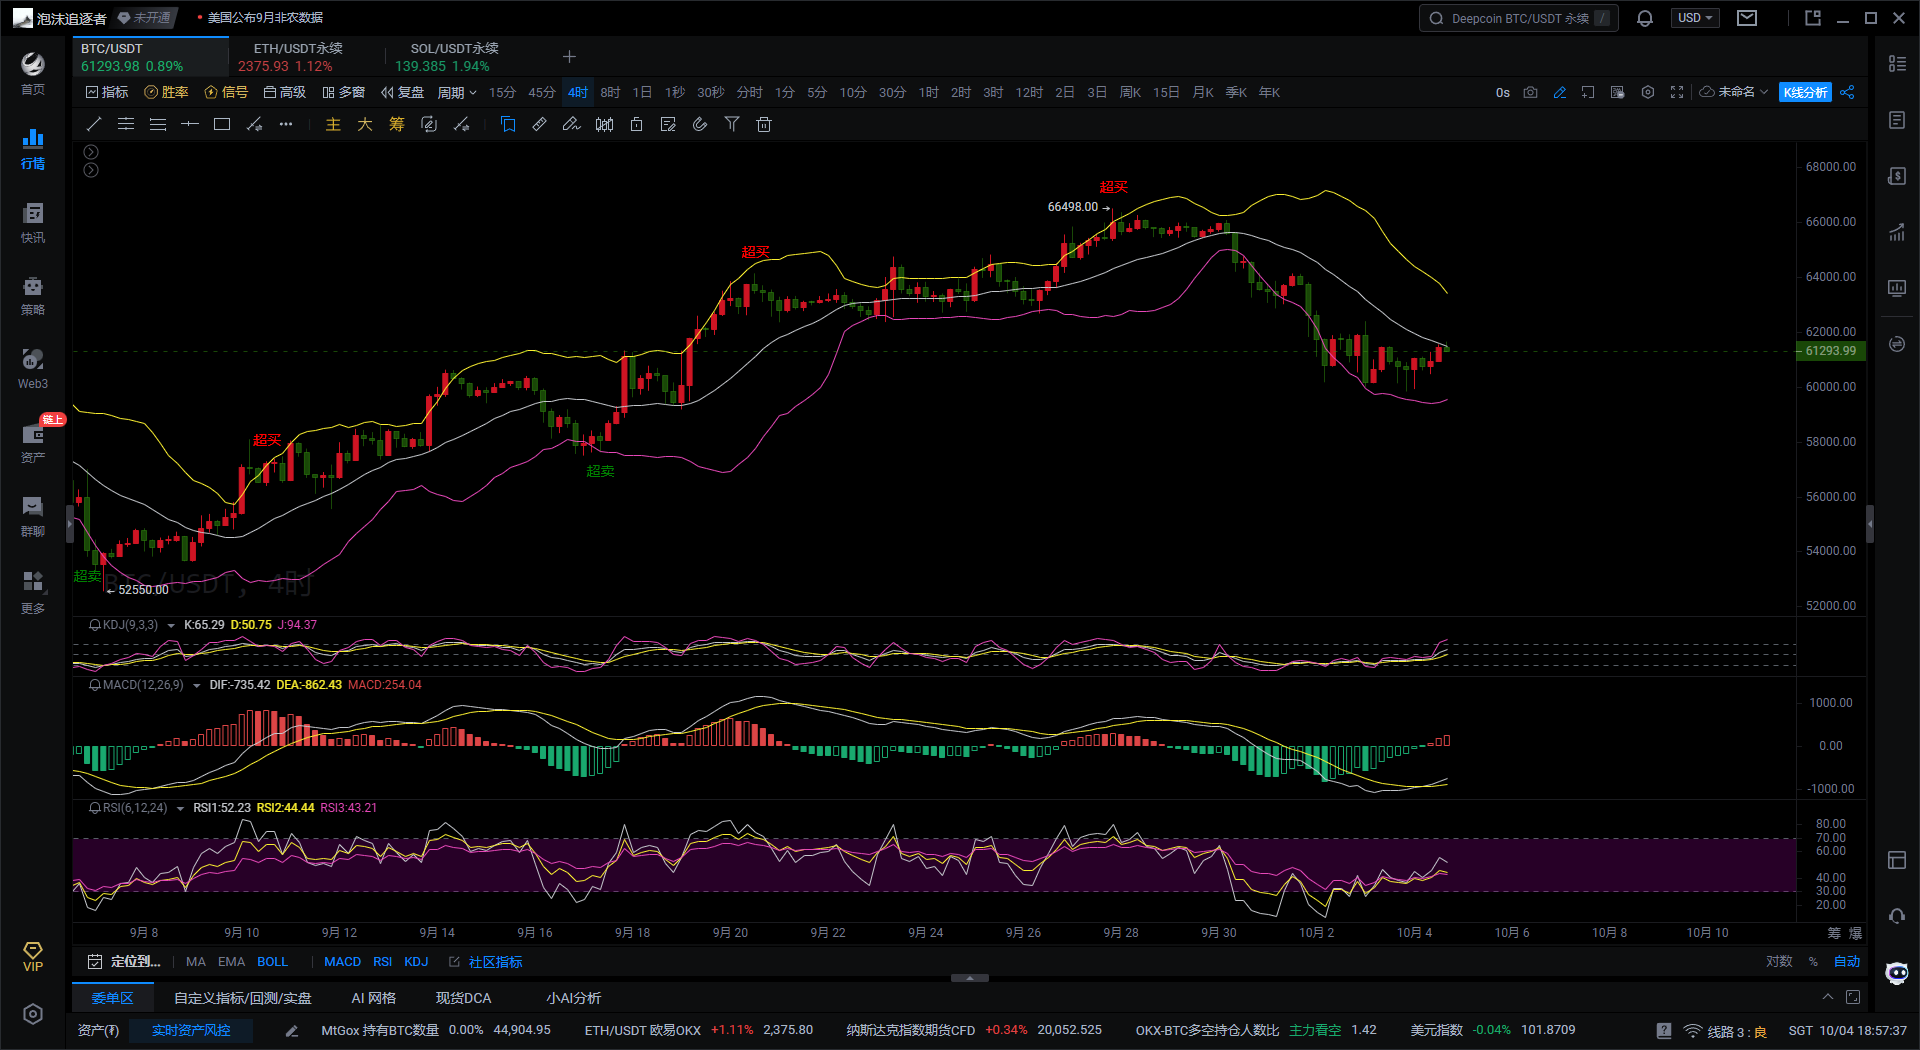
First, according to the Bollinger Bands indicator on the 4H Bitcoin chart, the price has rebounded from the lower band and is gradually approaching the middle band. This indicates that Bitcoin may soon test the middle band to determine if it can act as resistance. If it can effectively stabilize and break through the middle band, it will strengthen the upward trend; conversely, if it encounters resistance at the middle band, a downward price correction may occur.
Second, based on the KDJ indicator on the 4H Bitcoin chart, the three KDJ lines are diverging upwards, with the current position around 50. Notably, the J line has broken through, while the K and D lines continue to rise. This suggests that the market's short-term oversold condition is about to end, indicating that a rebound is imminent.
Finally, according to the MACD indicator on the 4H Bitcoin chart, although the DIF and DEA lines are operating below the zero axis, the DIF line is gradually approaching the DEA line, showing a trend towards a golden cross. At the same time, the MACD red histogram is increasing, indicating that the downward momentum is weakening and buying power is gradually strengthening. This sign also supports the view that a rebound is forthcoming.
Bitcoin 1-Hour Chart
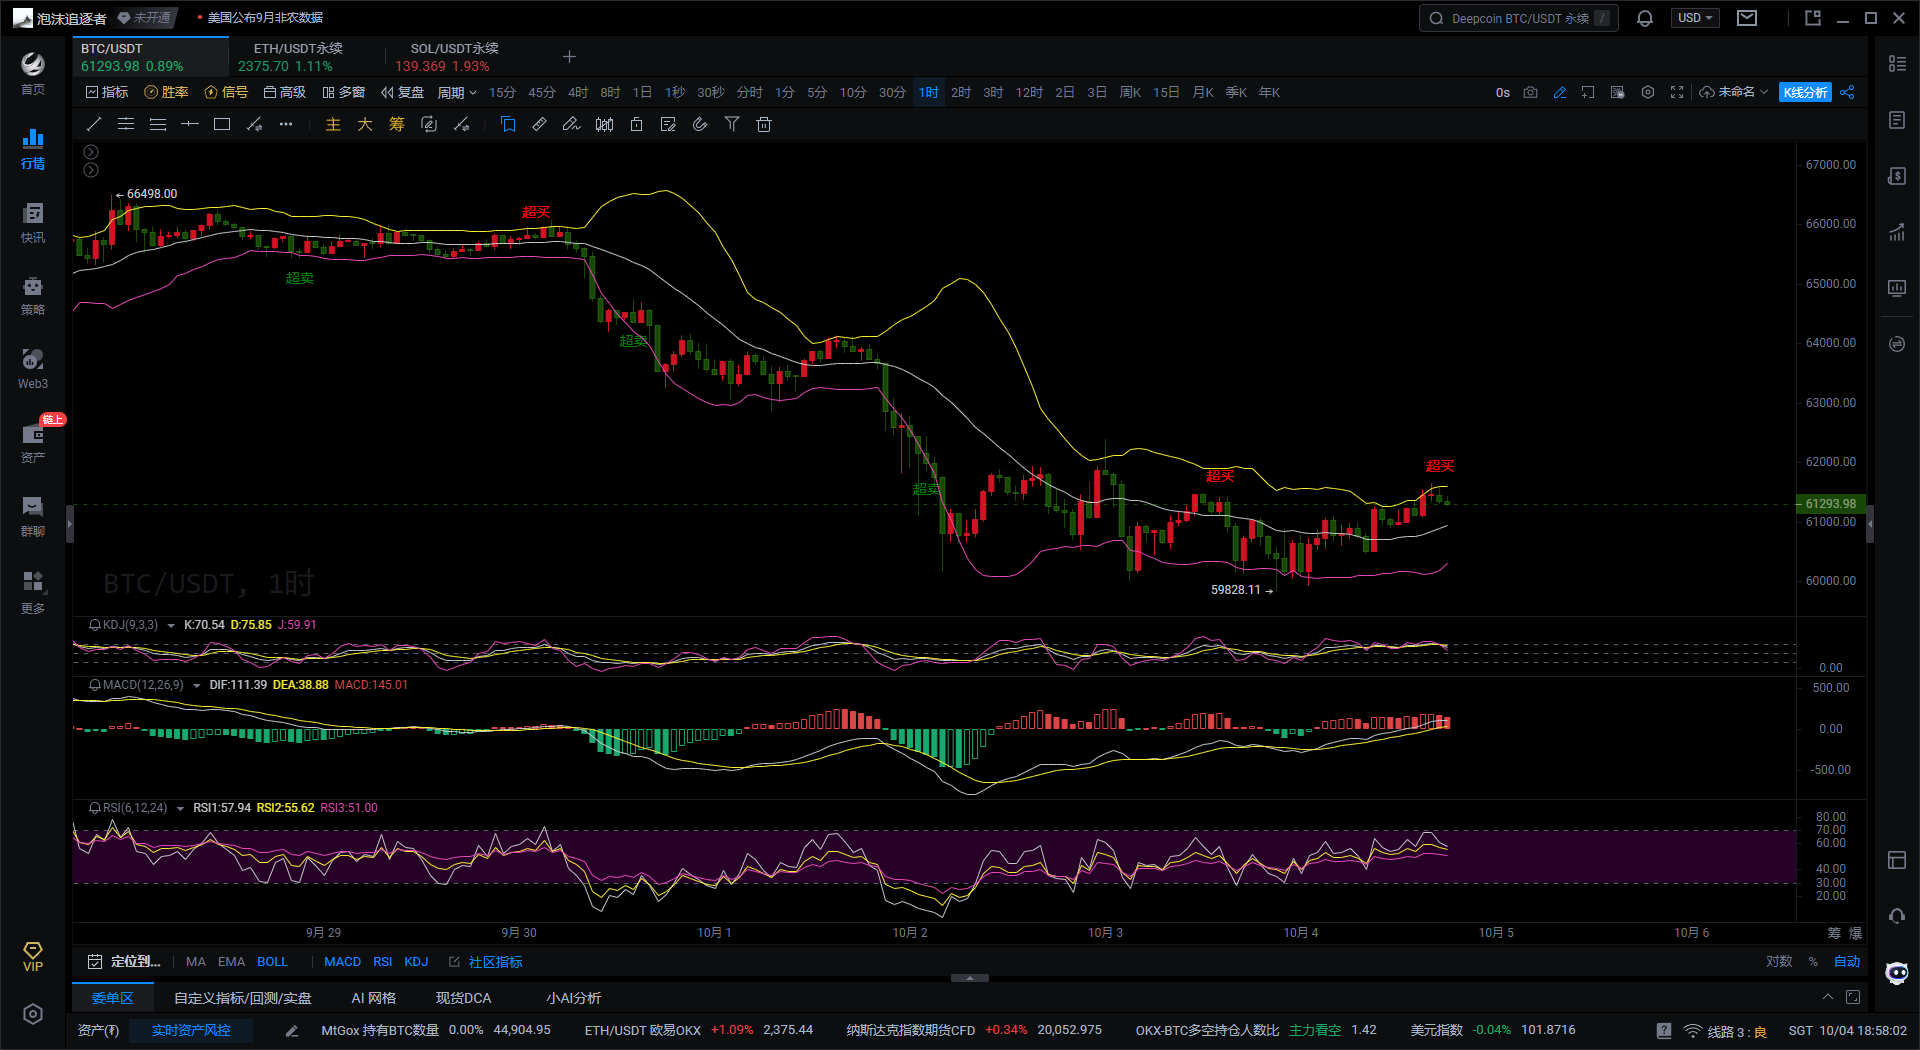
First, according to the Bollinger Bands indicator on the 1H Bitcoin chart, the current market shows a short-term bullish trend. The Bitcoin price has broken through the middle band of the Bollinger Bands and is approaching the upper band, indicating that the market is entering an upward phase. However, attention should be paid to the pressure at the upper band; if the price continues to fail to break through, there is a risk of falling back to the middle or lower band. Additionally, the gradual narrowing of the Bollinger Bands indicates reduced market volatility, suggesting a potential sideways movement in the short term.
Second, based on the KDJ indicator on the 1H Bitcoin chart, the K and D line values are around 70, in the overbought zone, indicating that Bitcoin's price has reached a relative high point in the short term and may enter a consolidation or correction phase at any time.
Finally, according to the MACD indicator on the 1H Bitcoin chart, the DIF line has crossed above the DEA line, indicating that the market is currently in an upward trend. The MACD red histogram shows that the bullish forces are dominant; however, the current red histogram is gradually shortening, indicating that the upward momentum is weakening, and the market may enter a sideways oscillation phase in the short term.
In summary, Bitcoin may continue to rebound in the short term, especially as the MACD and KDJ show bullish signals. However, due to the resistance at the middle band of the Bollinger Bands, the market's upward movement faces obstacles and may correct.
Based on the above analysis, the following suggestions are provided for reference:
Suggestion 1: Buy Bitcoin on a pullback to $60,400-$60,600, targeting $62,300-$62,500, with a stop loss at $60,000.
Suggestion 2: Short Bitcoin at $62,300-$62,500, targeting $60,000, with a stop loss at $62,800. (Also, note that the non-farm payroll data for September will be released at 8:30 PM, which may cause significant volatility.)
Instead of giving you a 100% accurate suggestion, I prefer to provide you with the right mindset and trend. After all, teaching someone to fish is better than giving them a fish. Suggestions may help you earn temporarily, but learning the mindset will help you earn for a lifetime! The focus is on the mindset, grasping the trend, and planning your positions. What I can do is use my practical experience to assist you, guiding your investment decisions and management in the right direction.
Time of writing: (2024-10-04, 19:00)

(Written by - Daxian Talks Coins) Disclaimer: Online publication may have delays; the above suggestions are for reference only. The author is dedicated to research and analysis in the fields of Bitcoin, Ethereum, altcoins, forex, stocks, etc., with years of experience in the financial market and rich practical operation experience. Investment carries risks; please proceed with caution.
免责声明:本文章仅代表作者个人观点,不代表本平台的立场和观点。本文章仅供信息分享,不构成对任何人的任何投资建议。用户与作者之间的任何争议,与本平台无关。如网页中刊载的文章或图片涉及侵权,请提供相关的权利证明和身份证明发送邮件到support@aicoin.com,本平台相关工作人员将会进行核查。