Cryptocurrency News
October 4 Highlights:
1. A new HBO documentary aims to reveal the true identity of Bitcoin creator Satoshi Nakamoto.
2. Brazil's largest cryptocurrency exchange Mercado #Bitcoin partners with #Ripple to provide cross-border payment services.
3. JPMorgan: Geopolitical risks and elections drive investors towards gold and Bitcoin.
4. Andre Cronje discovers a $1 billion FDV project using his open-source code.
5. The International Monetary Fund again urges El Salvador to strengthen its Bitcoin regulatory framework and oversight.
Trading Insights
How to identify major players' wash trading and distribution; in the cryptocurrency market, understanding the key points of major players' wash trading and distribution is crucial for success. Here are some key tips:
Pay attention to trading volume: Trading volume usually shrinks during wash trading and expands during distribution.
Note the price position: Major players typically wash trade when the price rises by about 30%, and when the increase exceeds 60%, one should be wary of the possibility of distribution.
Analyze the intraday chart: The intraday chart during wash trading often shows erratic movements, while the chart during distribution is relatively stable.
LIFE IS LIKE
A JOURNEY ▲
Below are the real trading signals from the Big White Community this week. Congratulations to those who followed along; if your trades are not going well, you can come and test the waters.
Data is real, and each trade has a screenshot from the time it was issued.
Search for the public account: Big White Talks Cryptocurrency
BTC
Analysis
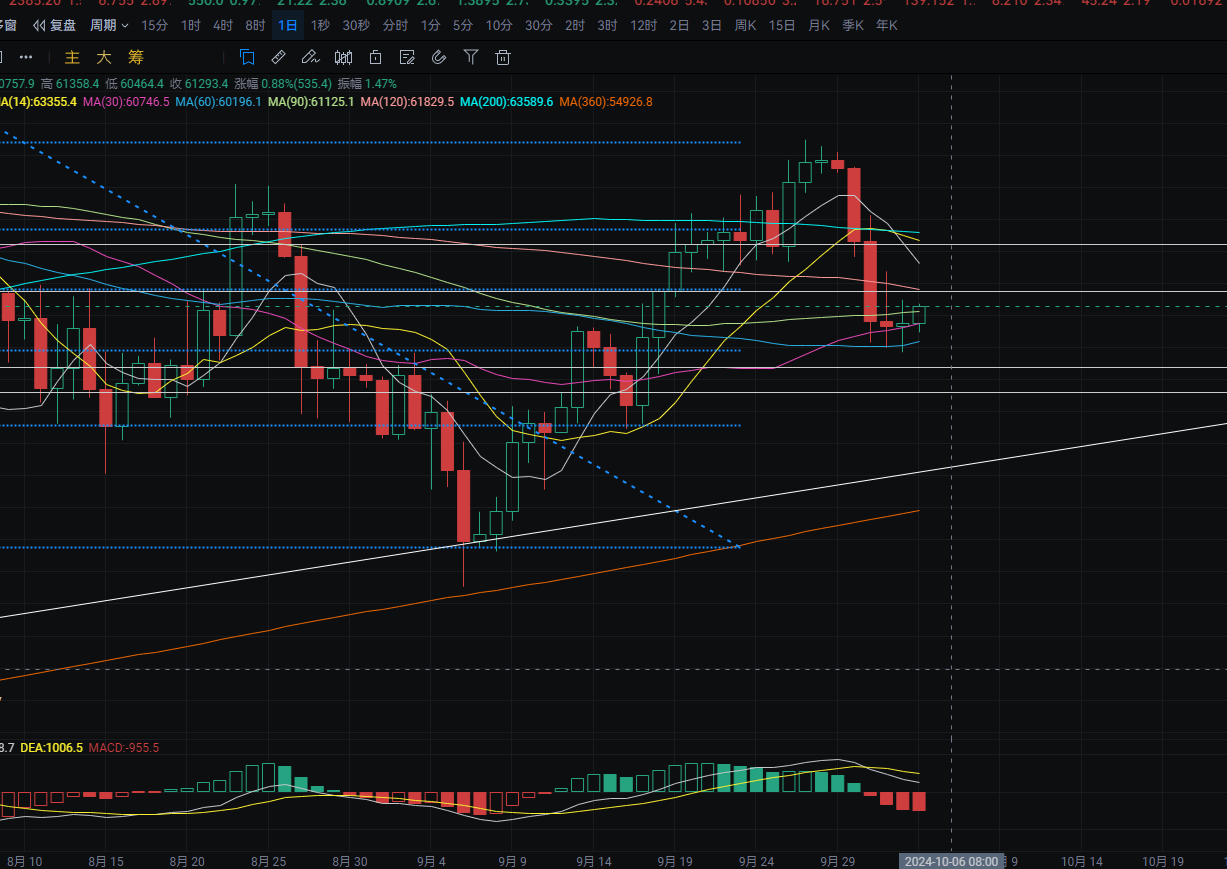
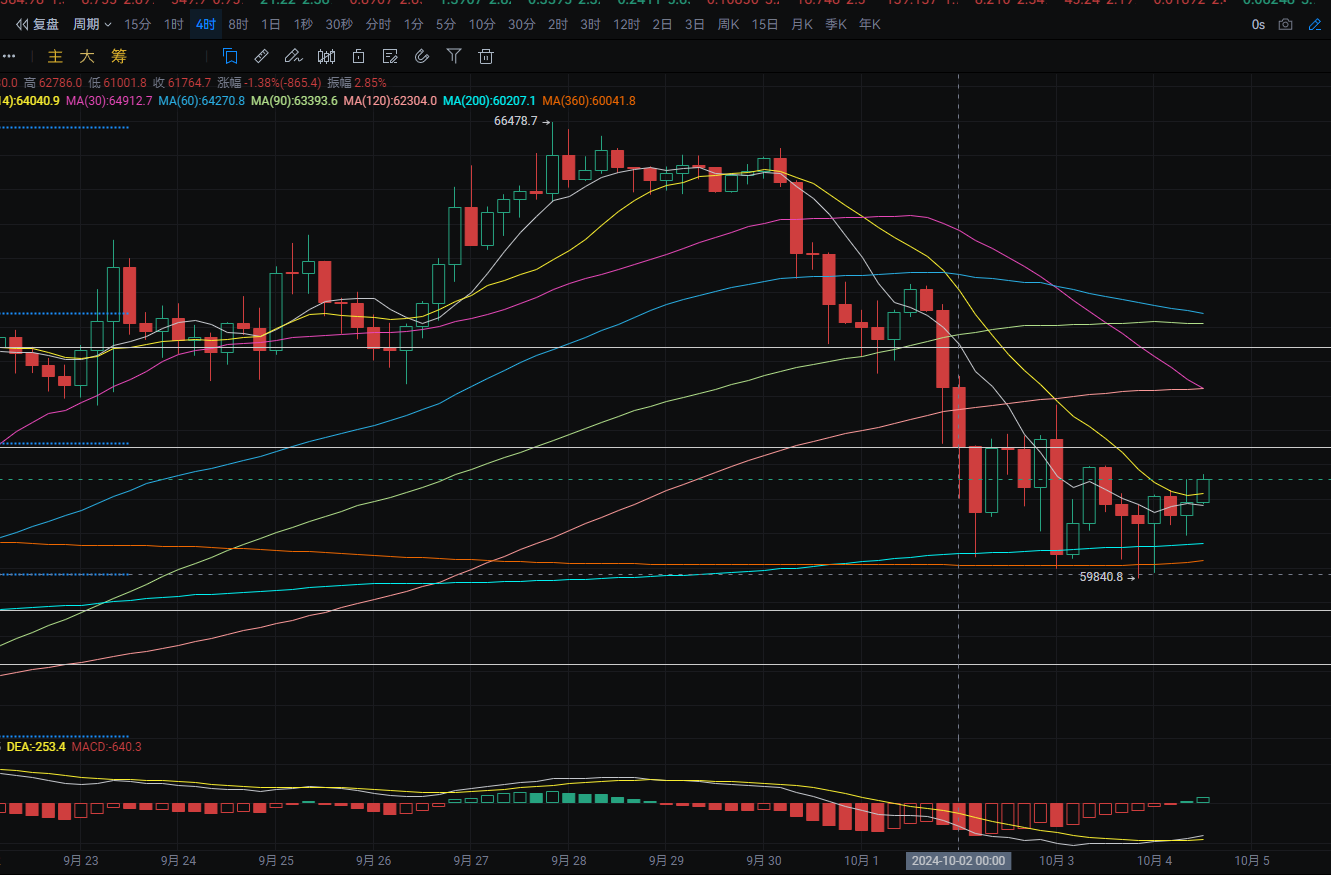
Bitcoin suggested buying around 60800 yesterday, and the position is currently profitable. The daily chart showed a pin bar yesterday, with a high spike to around 61500 and a low drop to around 59850, closing near 60750. There have been multiple tests near MA30 forming support; if it breaks, we will look towards the 60000 level. The upper resistance is near MA120; if it breaks, we will look towards MA14. MACD shows increasing bearish momentum. On the four-hour chart, there have been multiple tests near the 60000 level; a pullback can be used to buy again nearby. The top resistance can be observed near MA90, with MACD showing increasing bullish momentum forming a golden cross. The mid-term buy signal is around 59380-58600, with a rebound target looking towards 61750-63220.
ETH
Analysis
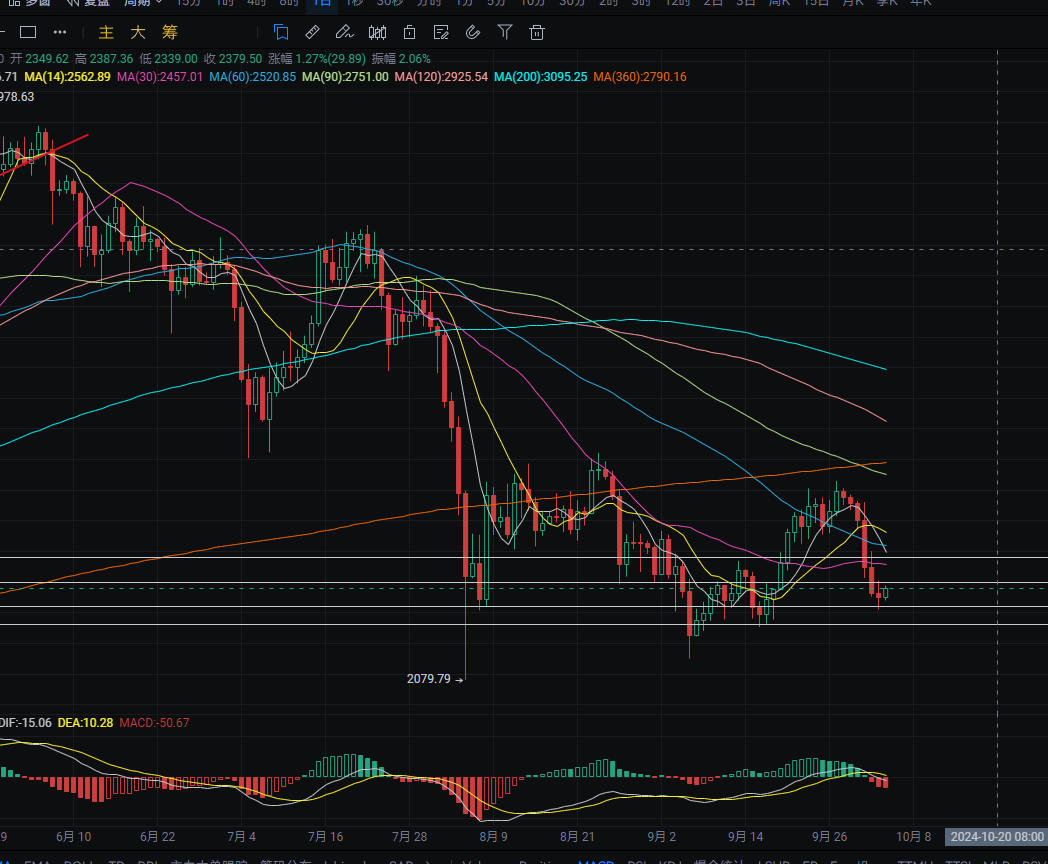
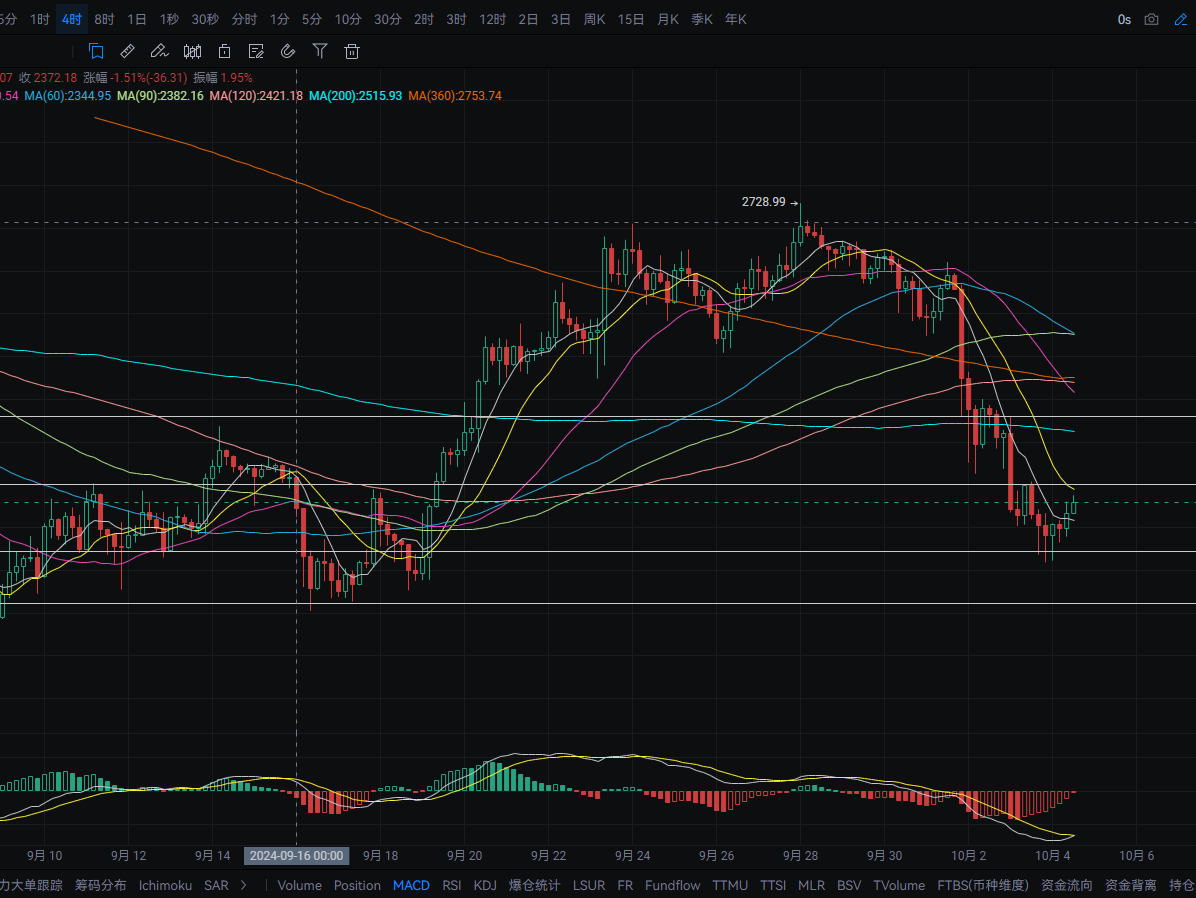
Ethereum suggested buying around 2320 yesterday, and the position is currently profitable. The daily chart showed a drop from a high of around 2400 to a low of around 2310, closing near 2350. There have been multiple tests near 2320 forming support; a pullback can be used to buy again nearby. The upper resistance is near MA30; if it breaks, we can look towards MA60. MACD shows increasing bearish momentum. On the four-hour chart, the upper resistance is near MA14; if it breaks, we can look towards MA200. MACD shows decreasing bearish momentum with signs of a golden cross forming. The short-term buy signal is around 2323-2262, with a rebound target looking towards 2400-2480.
Disclaimer: The above content is personal opinion and for reference only! It does not constitute specific operational advice and does not bear legal responsibility. Market conditions change rapidly, and the article has a certain lag; if you have any questions, feel free to consult.
免责声明:本文章仅代表作者个人观点,不代表本平台的立场和观点。本文章仅供信息分享,不构成对任何人的任何投资建议。用户与作者之间的任何争议,与本平台无关。如网页中刊载的文章或图片涉及侵权,请提供相关的权利证明和身份证明发送邮件到support@aicoin.com,本平台相关工作人员将会进行核查。


