Do not worry about having no friends on the road ahead; there are like-minded individuals on the investment journey. Good afternoon, everyone! I am the King of Coins from the Coin Victory Group. Thank you all for coming here to watch the King’s articles and videos. I also hope that the brothers who have been following the King will return and seize the great era of the cryptocurrency world with the Coin Victory Group.
Click the link to watch the video: https://www.bilibili.com/video/BV1bk4MehESk/

First, I would like to congratulate the friends who followed the King’s Bitcoin and Ethereum current price strategy yesterday. When the King recorded the video yesterday, he directly provided limit orders: a short position for Bitcoin at 64,100 and a short position for Ethereum at 2,650. At the same time, our strategy group also synchronized these orders, and in the evening, we successfully achieved take profit, with Bitcoin profits easily exceeding 2,000 points and Ethereum over 100 points. I can only say that although the King has been away from the scene for a while, the sword is still sharp.

Returning to the market, let’s analyze why Bitcoin and Ethereum experienced a significant drop yesterday. This is actually closely related to a point I mentioned in yesterday's article, which is the rise of the stock market. We can see that the main outflow of funds yesterday was from ETF funds. Everyone should understand that the companies behind these ETFs, besides operating in the cryptocurrency space, are also traditional stock investment companies. For these companies, achieving wealth growth is the most important, whether from the stock market or the cryptocurrency market. When the stock market is thriving, the cryptocurrency market has been in a long-term sideways trend. At this time, they withdraw funds to enter the stock market to seize short-term profits, which is very understandable. This is reflected in the Bitcoin and Ethereum markets, where funds fled, causing prices to drop rapidly. The second reason is the geopolitical impact from the Middle East. Many friends may be aware that resistance organizations in the Middle East use cryptocurrency as their trading channel. With the escalation of conflicts and the previous incident of Binance banning Hamas's trading accounts, this portion of funds is also bound to flow out, which reflects the organized retail investors fleeing that I mentioned yesterday. Now it can be confirmed that these individuals, under the dual reasons, caused Bitcoin to drop directly to the 60,000 mark.
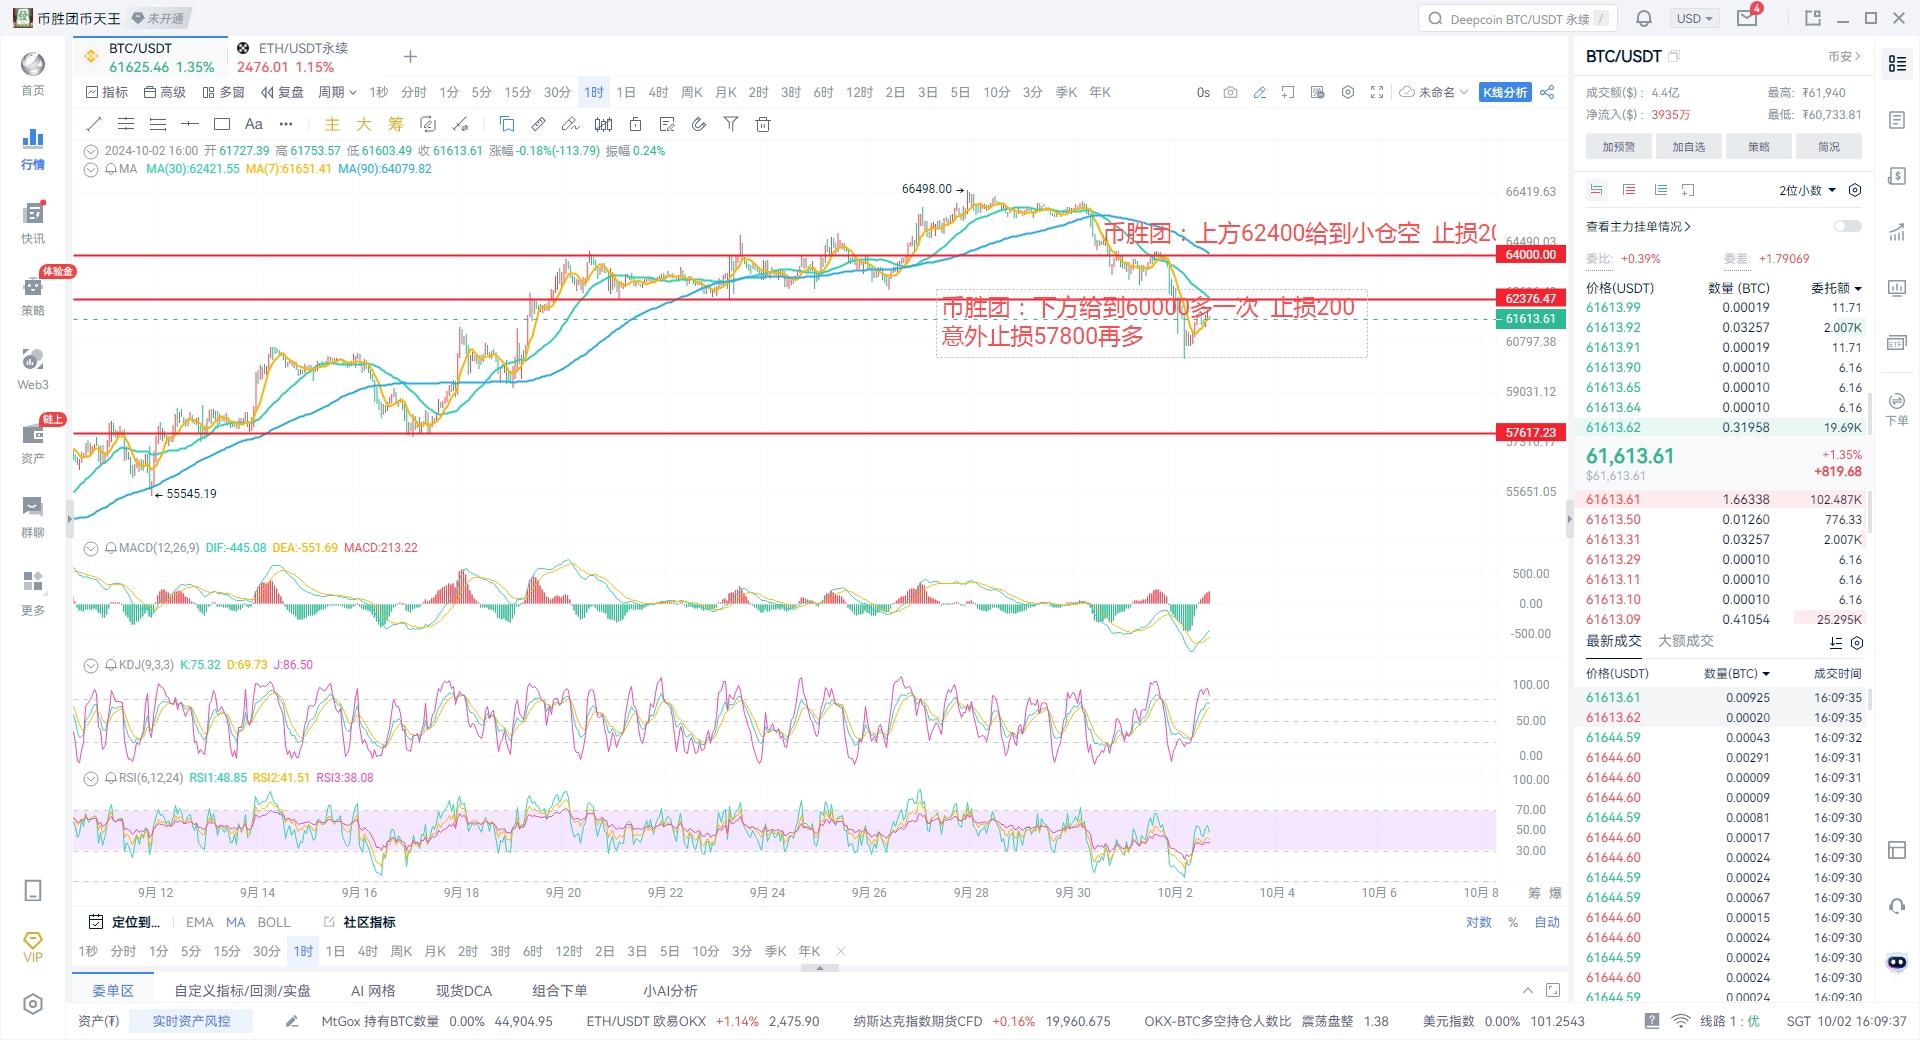
From today’s technical indicators, all support levels have been broken, and the pattern has completely lost its way. This means that from a technical perspective, we cannot derive much effective information. At this time, we can only determine the basic trend through higher-level candlesticks. From the daily chart, there is not much to say; two consecutive engulfing bearish candles are a typical trend reversal bearish signal. The only short-term support at the lower level of the long cycle is around 57,800. In the short term, we should primarily focus on short positions, and everyone can pay attention to the support at the lower integer level, allowing for a small position to try a long position. If a stop loss of 200 points is hit, we will only choose to enter long again when it reaches around 57,800. The upper pattern is currently quite awkward; the market has rebounded in the short term, but there is not much space. If we short at the current price, it is very easy to hit the stop loss. Here, the King can only find a relatively effective previous support level through naked candlesticks, which can currently be treated as a short-term resistance level around 62,400. At this position, a small position can be taken for a short, with a stop loss of just 200 points, because this kind of market changes quickly. Therefore, I believe that more strategies should focus on timely notifications.
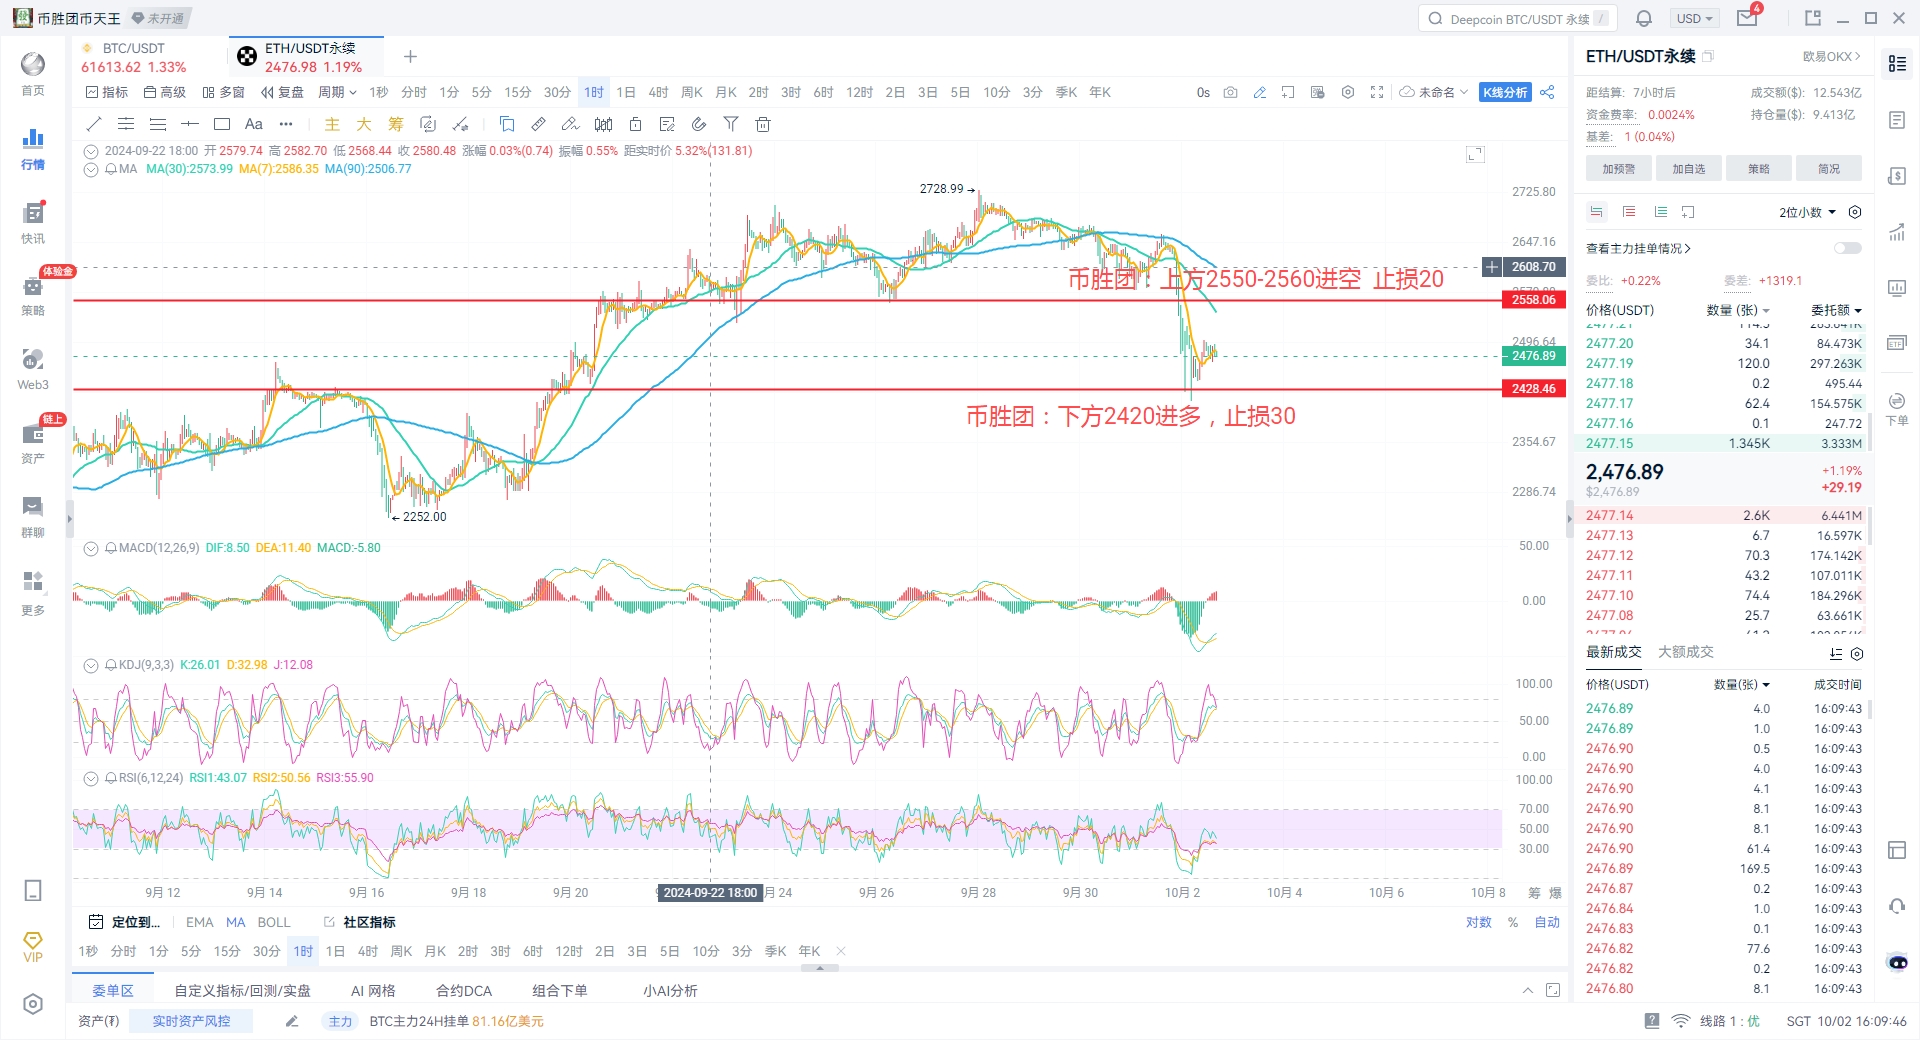
Now looking at Ethereum, the overall decline is much larger than that of Bitcoin. Currently, the lower support levels are also being broken. The bearish trend is very obvious in operations. We can look for entry opportunities through smaller cycle levels. On the hourly chart, the accompanying indicators are all leaning towards bearish. The only short-term support level below is around 2,420. At this position, a small long position can be taken with a stop loss of about 30 points. Above, we can find the previous key support resistance level through naked candlesticks. The range currently visible is between 2,550 and 2,560, where a small position can be chosen for a short, with a stop loss of 20 points. Since Ethereum's decline yesterday was relatively larger compared to Bitcoin, I personally feel that the position in Ethereum can be slightly smaller today. Because once this thing starts moving, it will lead to significant fluctuations. The points mentioned in the article can be used as a reference. Because the market not only follows technical indicators but is also influenced by sudden news and market sentiment, we will notify more timely thoughts in the strategy group. Friends in need can also find the Coin Victory Group across the internet.

This article is independently written by the Coin Victory Group. Friends in need of current price strategies and solutions can find the Coin Victory Group across the internet. Recently, the market has been mainly characterized by fluctuations, accompanied by intermittent spikes. Therefore, when making trades, please remember to control your take profit and stop loss. In the future, when facing major market data, the Coin Victory Group will also organize live broadcasts across the internet. Friends who wish to watch can find the Coin Victory Group across the internet and contact me for the link.

Mainly focused on spot, contracts, BTC/ETH/ETC/LTC/EOS/BSV/ATOM/XRP/BCH/LINK/TRX/DOT, specializing in styles such as mobile locking strategies around high and low support and resistance for short-term fluctuations, medium to long-term trend positions, daily extreme pullbacks, weekly K-top predictions, and monthly head predictions.
免责声明:本文章仅代表作者个人观点,不代表本平台的立场和观点。本文章仅供信息分享,不构成对任何人的任何投资建议。用户与作者之间的任何争议,与本平台无关。如网页中刊载的文章或图片涉及侵权,请提供相关的权利证明和身份证明发送邮件到support@aicoin.com,本平台相关工作人员将会进行核查。


