Author | Wenser, Odaily Planet Daily

"Another limit up!"
"It has already risen over 130 points!"
"The author from Qidian who went all in on A-shares made over 3 million and then stopped updating!"
"A new stock starting with 'CL' has already risen over 17 times today, isn't that scarier than meme coins on SOL?"
"Someone made 520,000 RMB in one morning, and data shows that A-share investors earned an average of 47,000 RMB in just four days!"
With the Federal Reserve being the first to cut interest rates, the global market has finally opened a "flood of liquidity," and A-shares have also begun a new round of "recovering lost ground" under the stimulus of multiple favorable policies from the central bank. As of September 30, the trading volume of A-shares exceeded 25 trillion RMB, setting a new historical record; previously, it took only 35 minutes for the trading volume to surpass 1 trillion, breaking the "fastest 1 trillion record." The crazy market is attracting more and more investors, with many cryptocurrency practitioners claiming they have "withdrawn large amounts, aiming directly at the A-share limit up." On the other hand, the relationship between cryptocurrency and the US stock market is also strengthening—previously, according to IntoTheBlock data, last week the correlation between BTC and the US stock market reached its highest level since Q2 2022. After the approval of Bitcoin spot ETFs and Ethereum spot ETFs, this situation is also a further reflection of the deepening coupling between traditional financial markets and the cryptocurrency industry.
Odaily Planet Daily will retrospectively sort out the key nodes of Bitcoin prices this year, providing a glimpse into the correlation between Bitcoin, as a "barometer" of cryptocurrency, and the performances of the US and A-shares during different periods.
Back to 2024: Key Nodes of BTC Price vs Performance of US and A-shares
At the beginning of the year, the milestone event of "Bitcoin spot ETF approved by the US SEC" became the best annotation for the acceleration of the mainstreaming process of the cryptocurrency industry. Looking back at BTC's performance since January this year, despite experiencing several months of fluctuations and multiple price dips after breaking new highs, it still belongs to the category of "quality assets and safe-haven assets" compared to other investment targets during the same period. Below is a summary of BTC's key points from January to September and their corresponding performances in the US and A-shares:
January 11 - Bitcoin Spot ETF Officially Approved
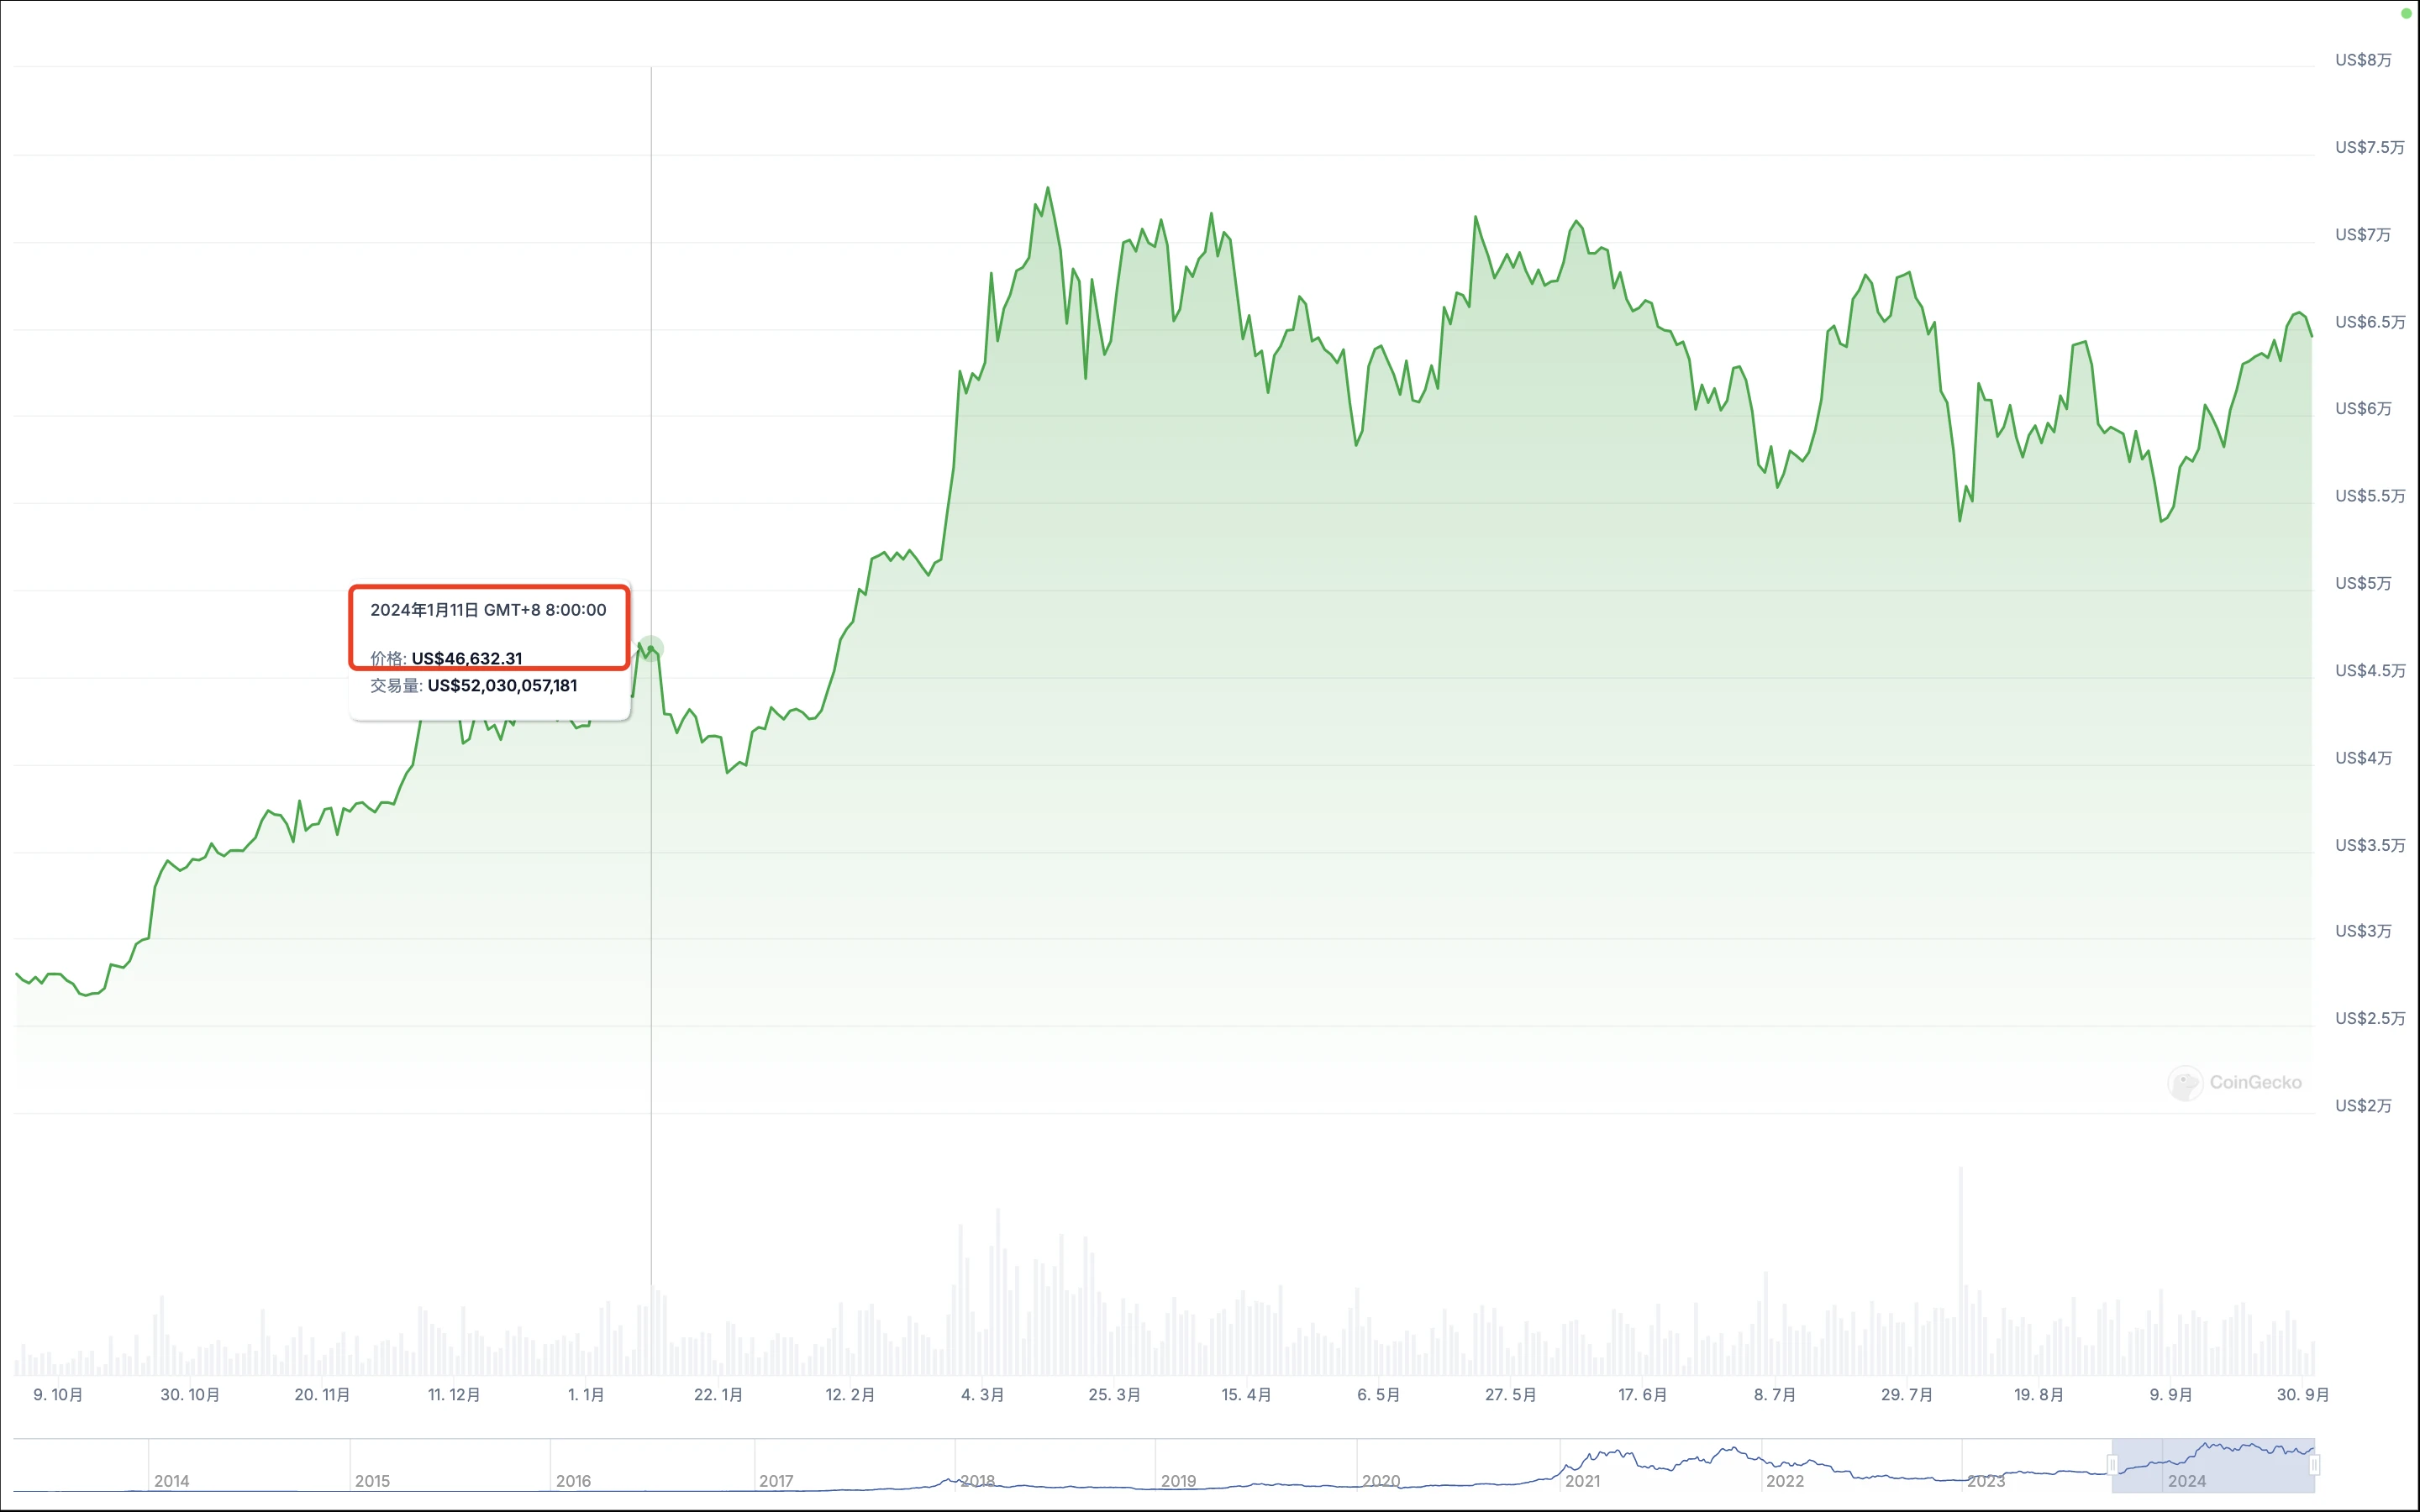
On January 11, 2024, local time, the US SEC officially approved several Bitcoin spot ETF funds, thus opening a new process of "mainstreaming cryptocurrency." Although this matter was "leaked" two days earlier due to the hacking of the official account of the SEC X platform, Bitcoin's price reacted relatively lukewarm after a slight increase, but compared to before, it still showed a "stable and improving" situation, laying a solid foundation for subsequent breakthroughs to new historical highs. For more information, see "Historic Moment: Bitcoin Spot ETF Finally Approved, Will the Opening of Cryptocurrency Be a New Starting Point for a Long Bull Market?"
At that time,
BTC price was around $46,632;
A-share Shanghai Composite Index was around 2,881 points;
US Dow Jones data was around 37,584 points.
BTC Price
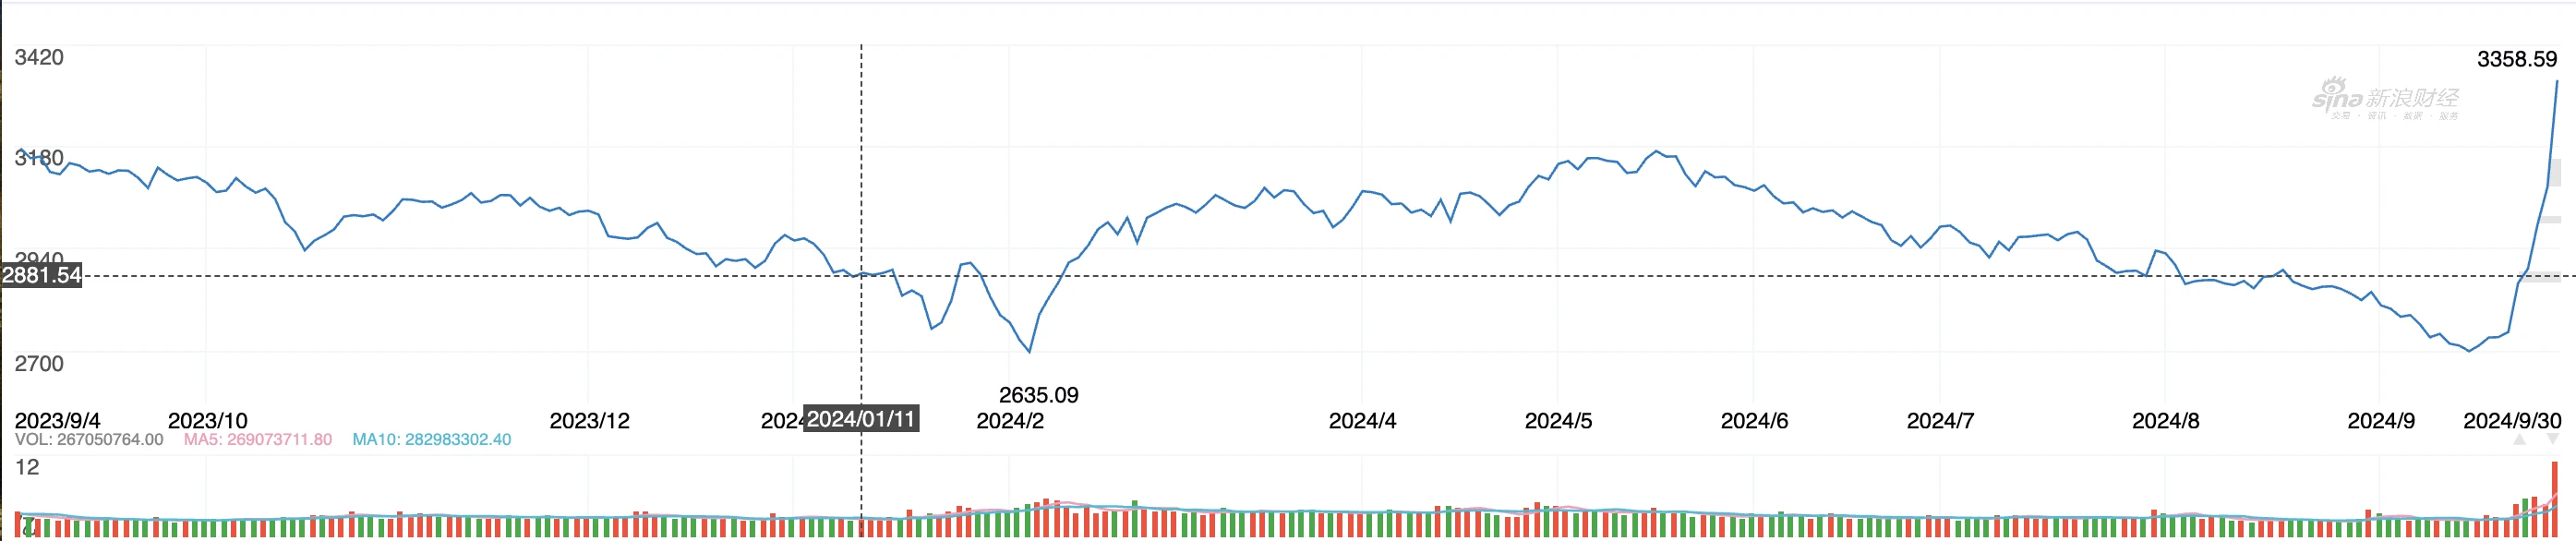
Shanghai Composite Index
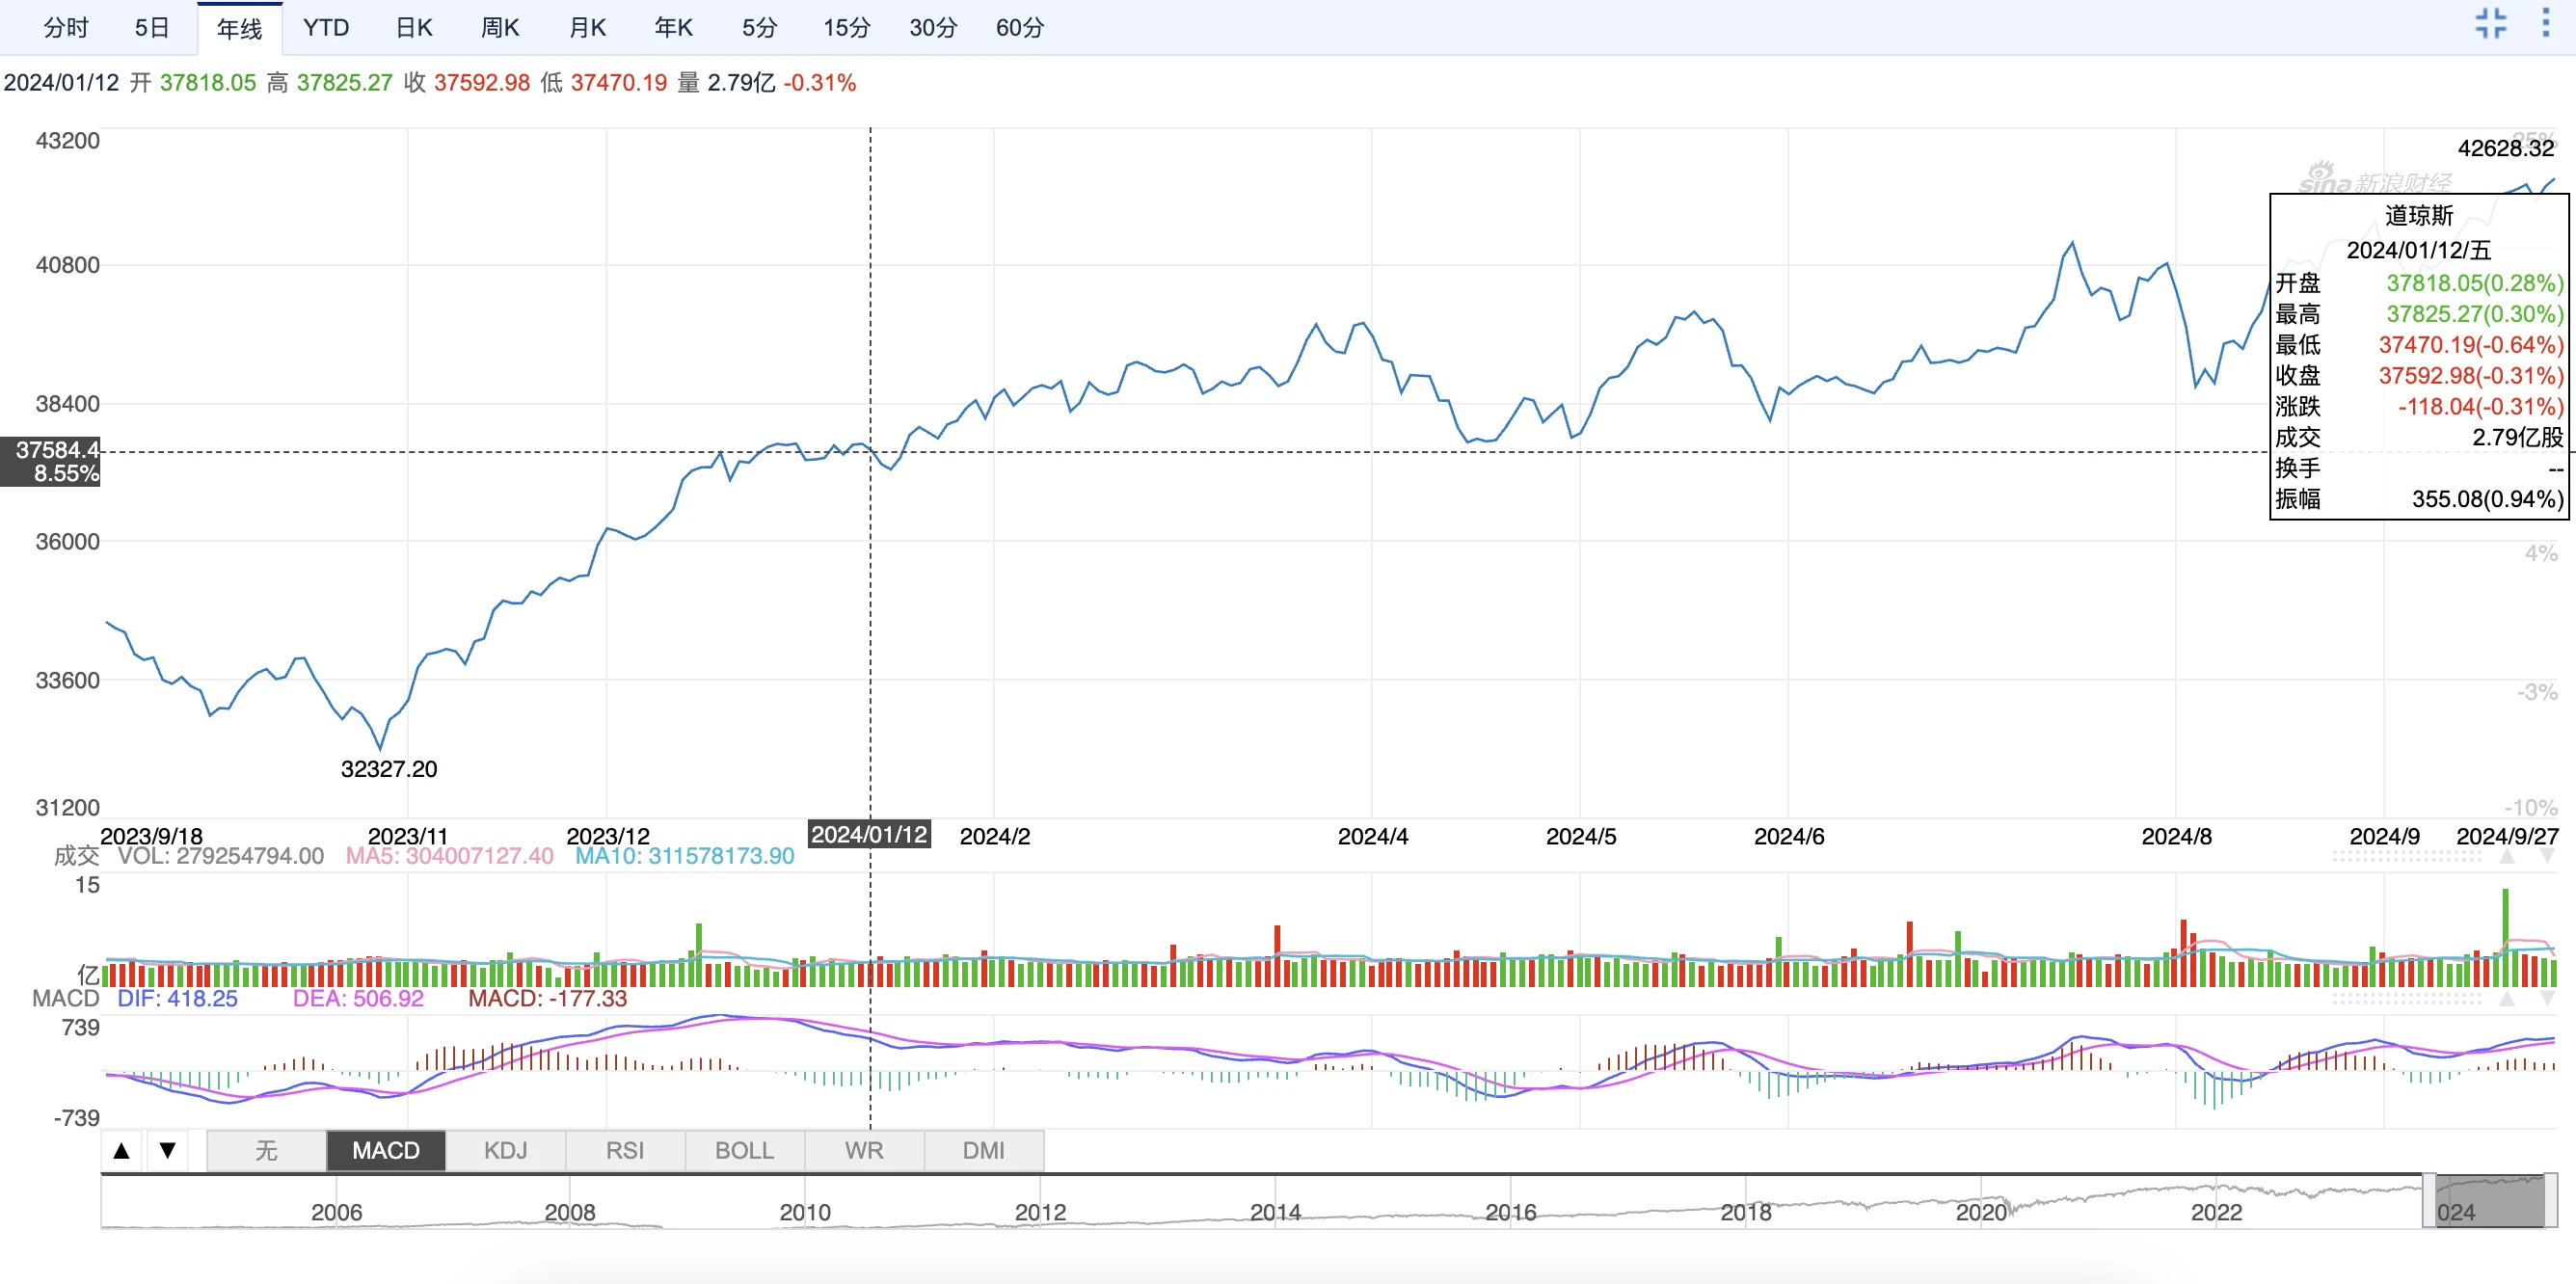
US Dow Jones
March 14 - BTC Hits New High, "No Longer Owing Anyone"
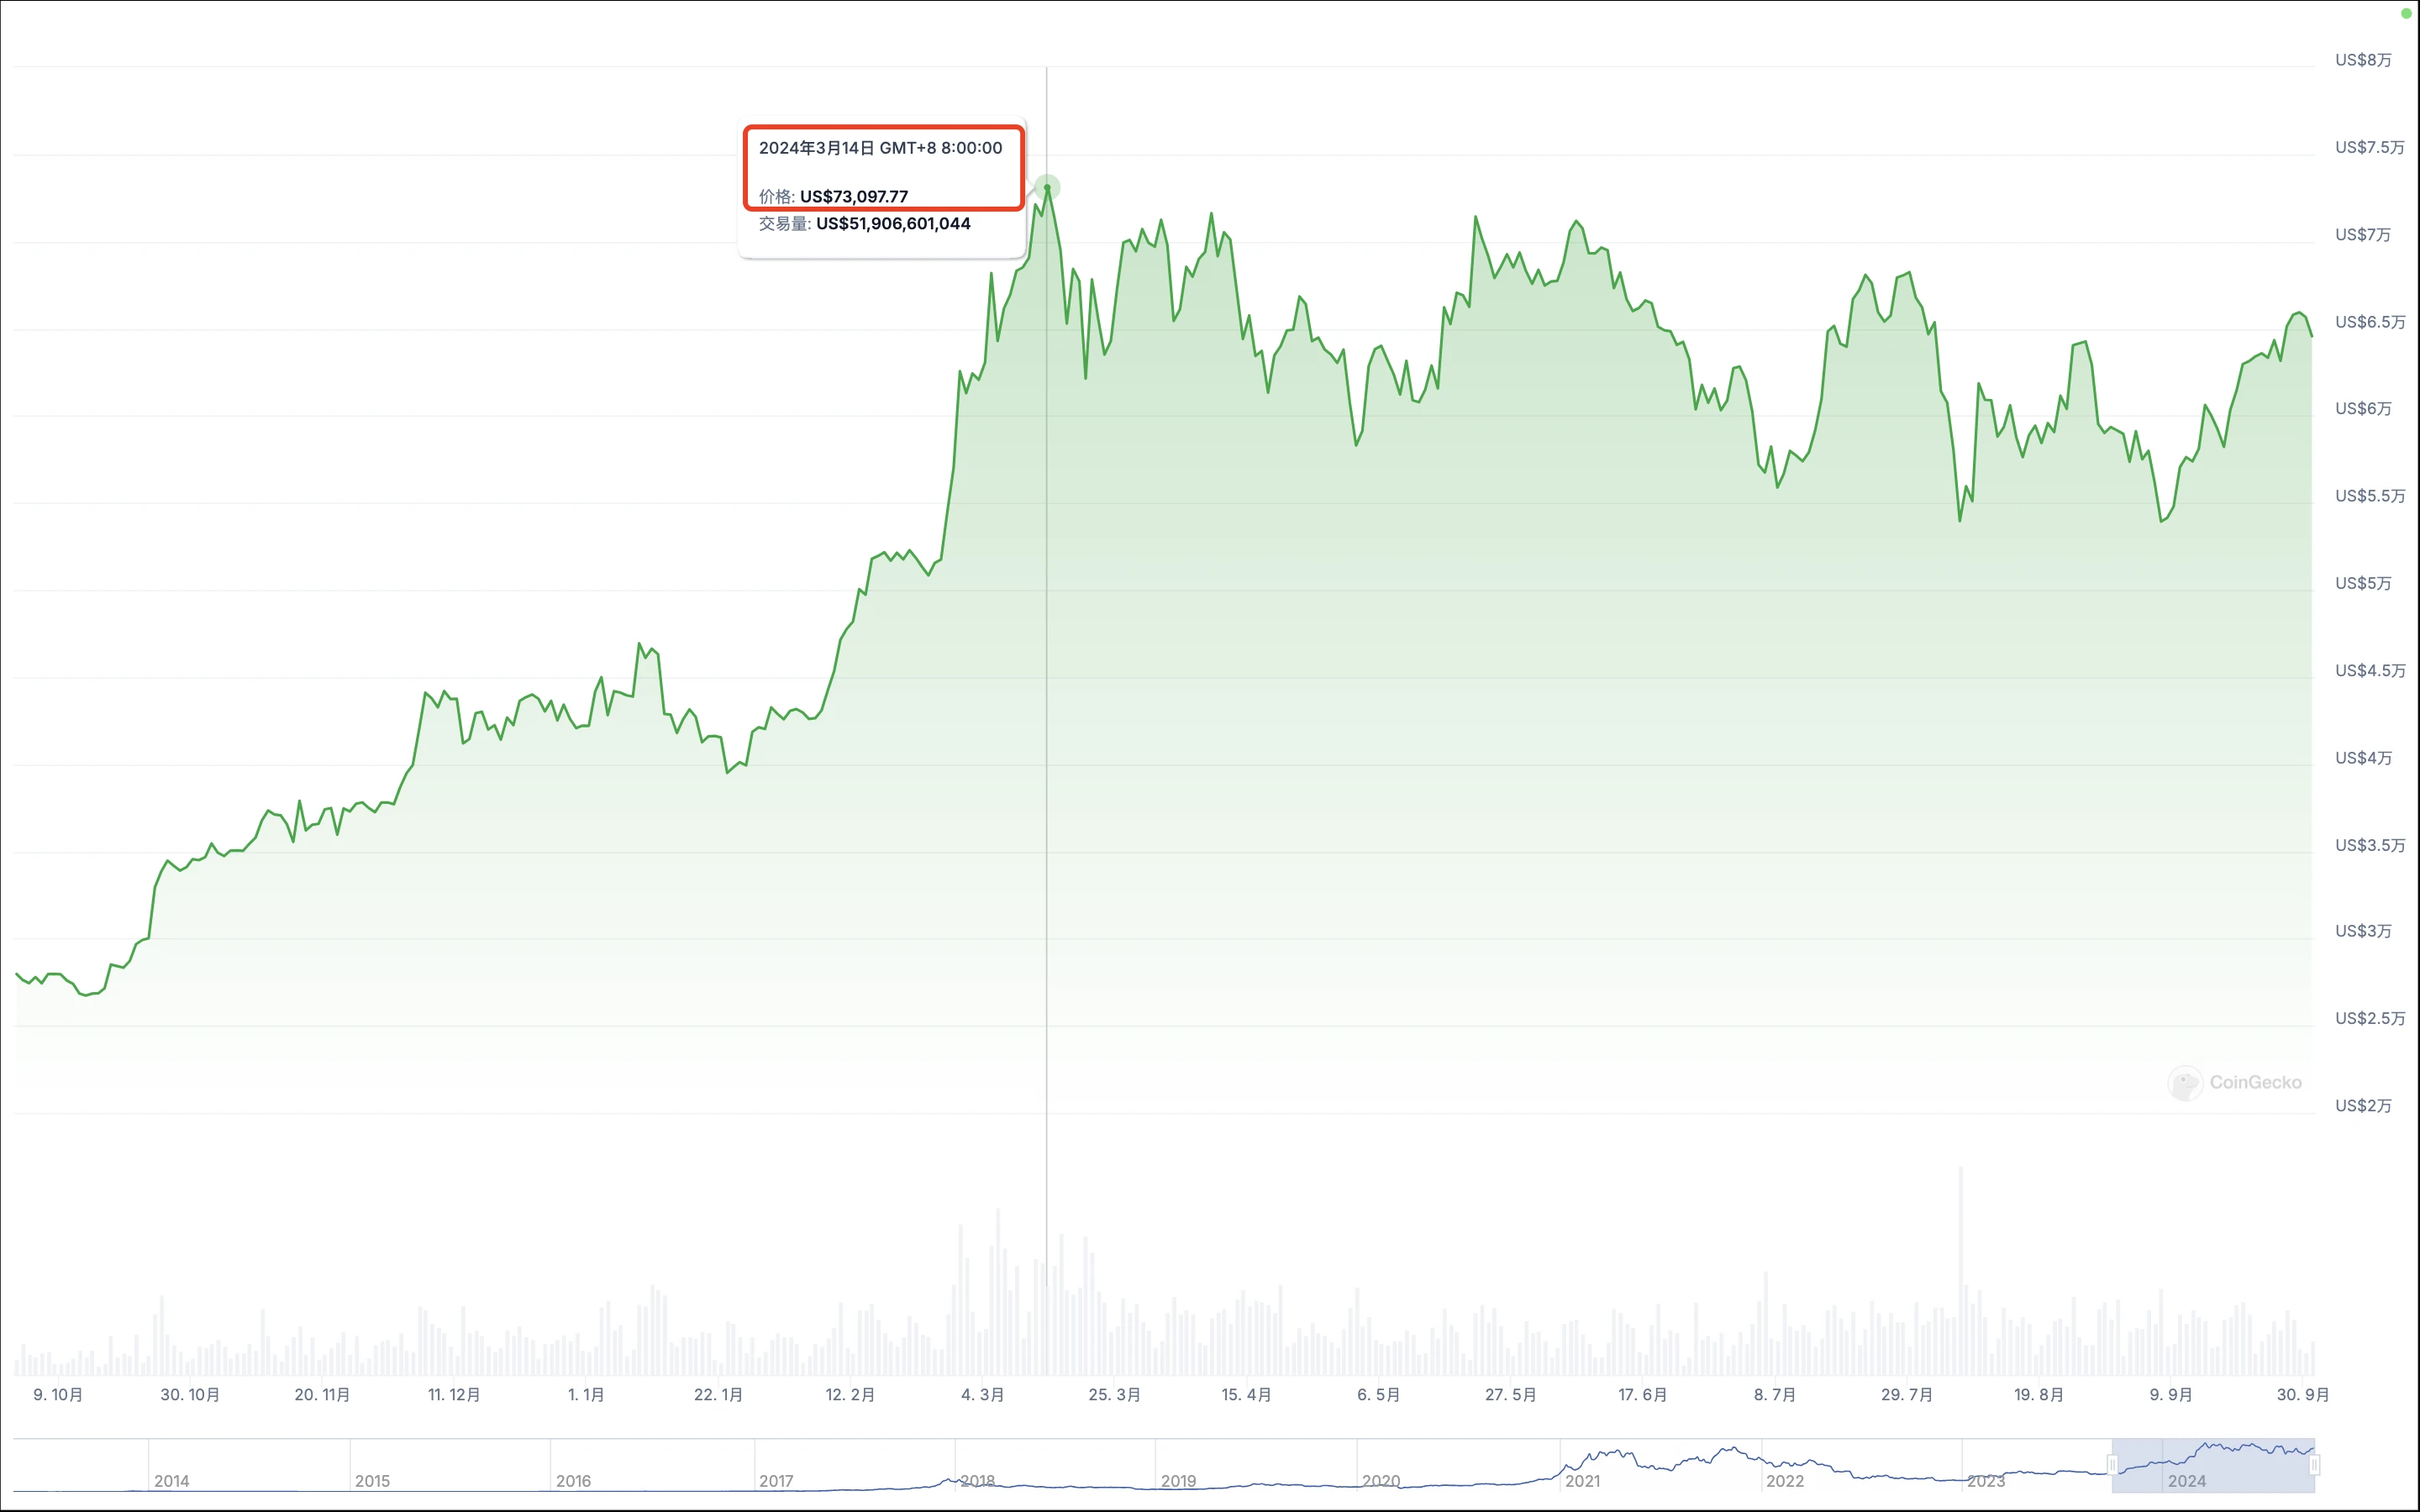
On March 14, as funds continued to flow into Bitcoin spot ETFs, US stock investors' enthusiasm for investing in Bitcoin grew, and the cryptocurrency industry was also immersed in an optimistic atmosphere of a "crypto bull market." The Solana meme coin craze also began to emerge, with many previously funded star projects preparing for TGE and listing on top exchanges. Amidst this positive sentiment, Bitcoin's price continuously broke through previous high points, ultimately surpassing the historical high of around $69,000 on the 14th and rising to over $73,000.
At that time,
BTC price was around $73,097;
A-share Shanghai Composite Index was around 3,036 points;
US Dow Jones data was around 38,888 points.
BTC Price
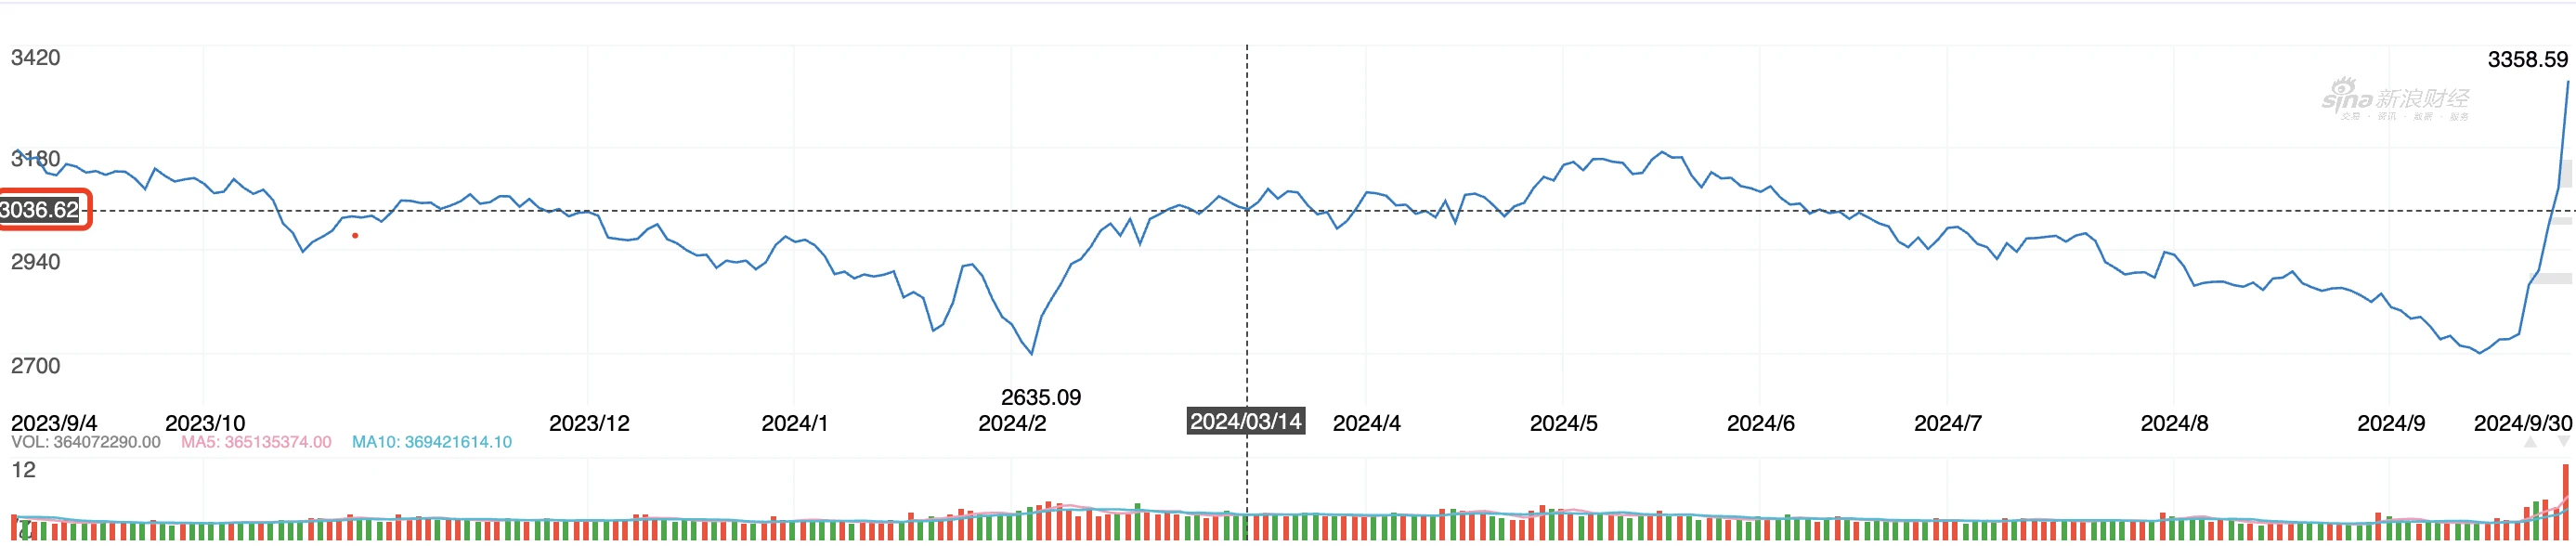
Shanghai Composite Index
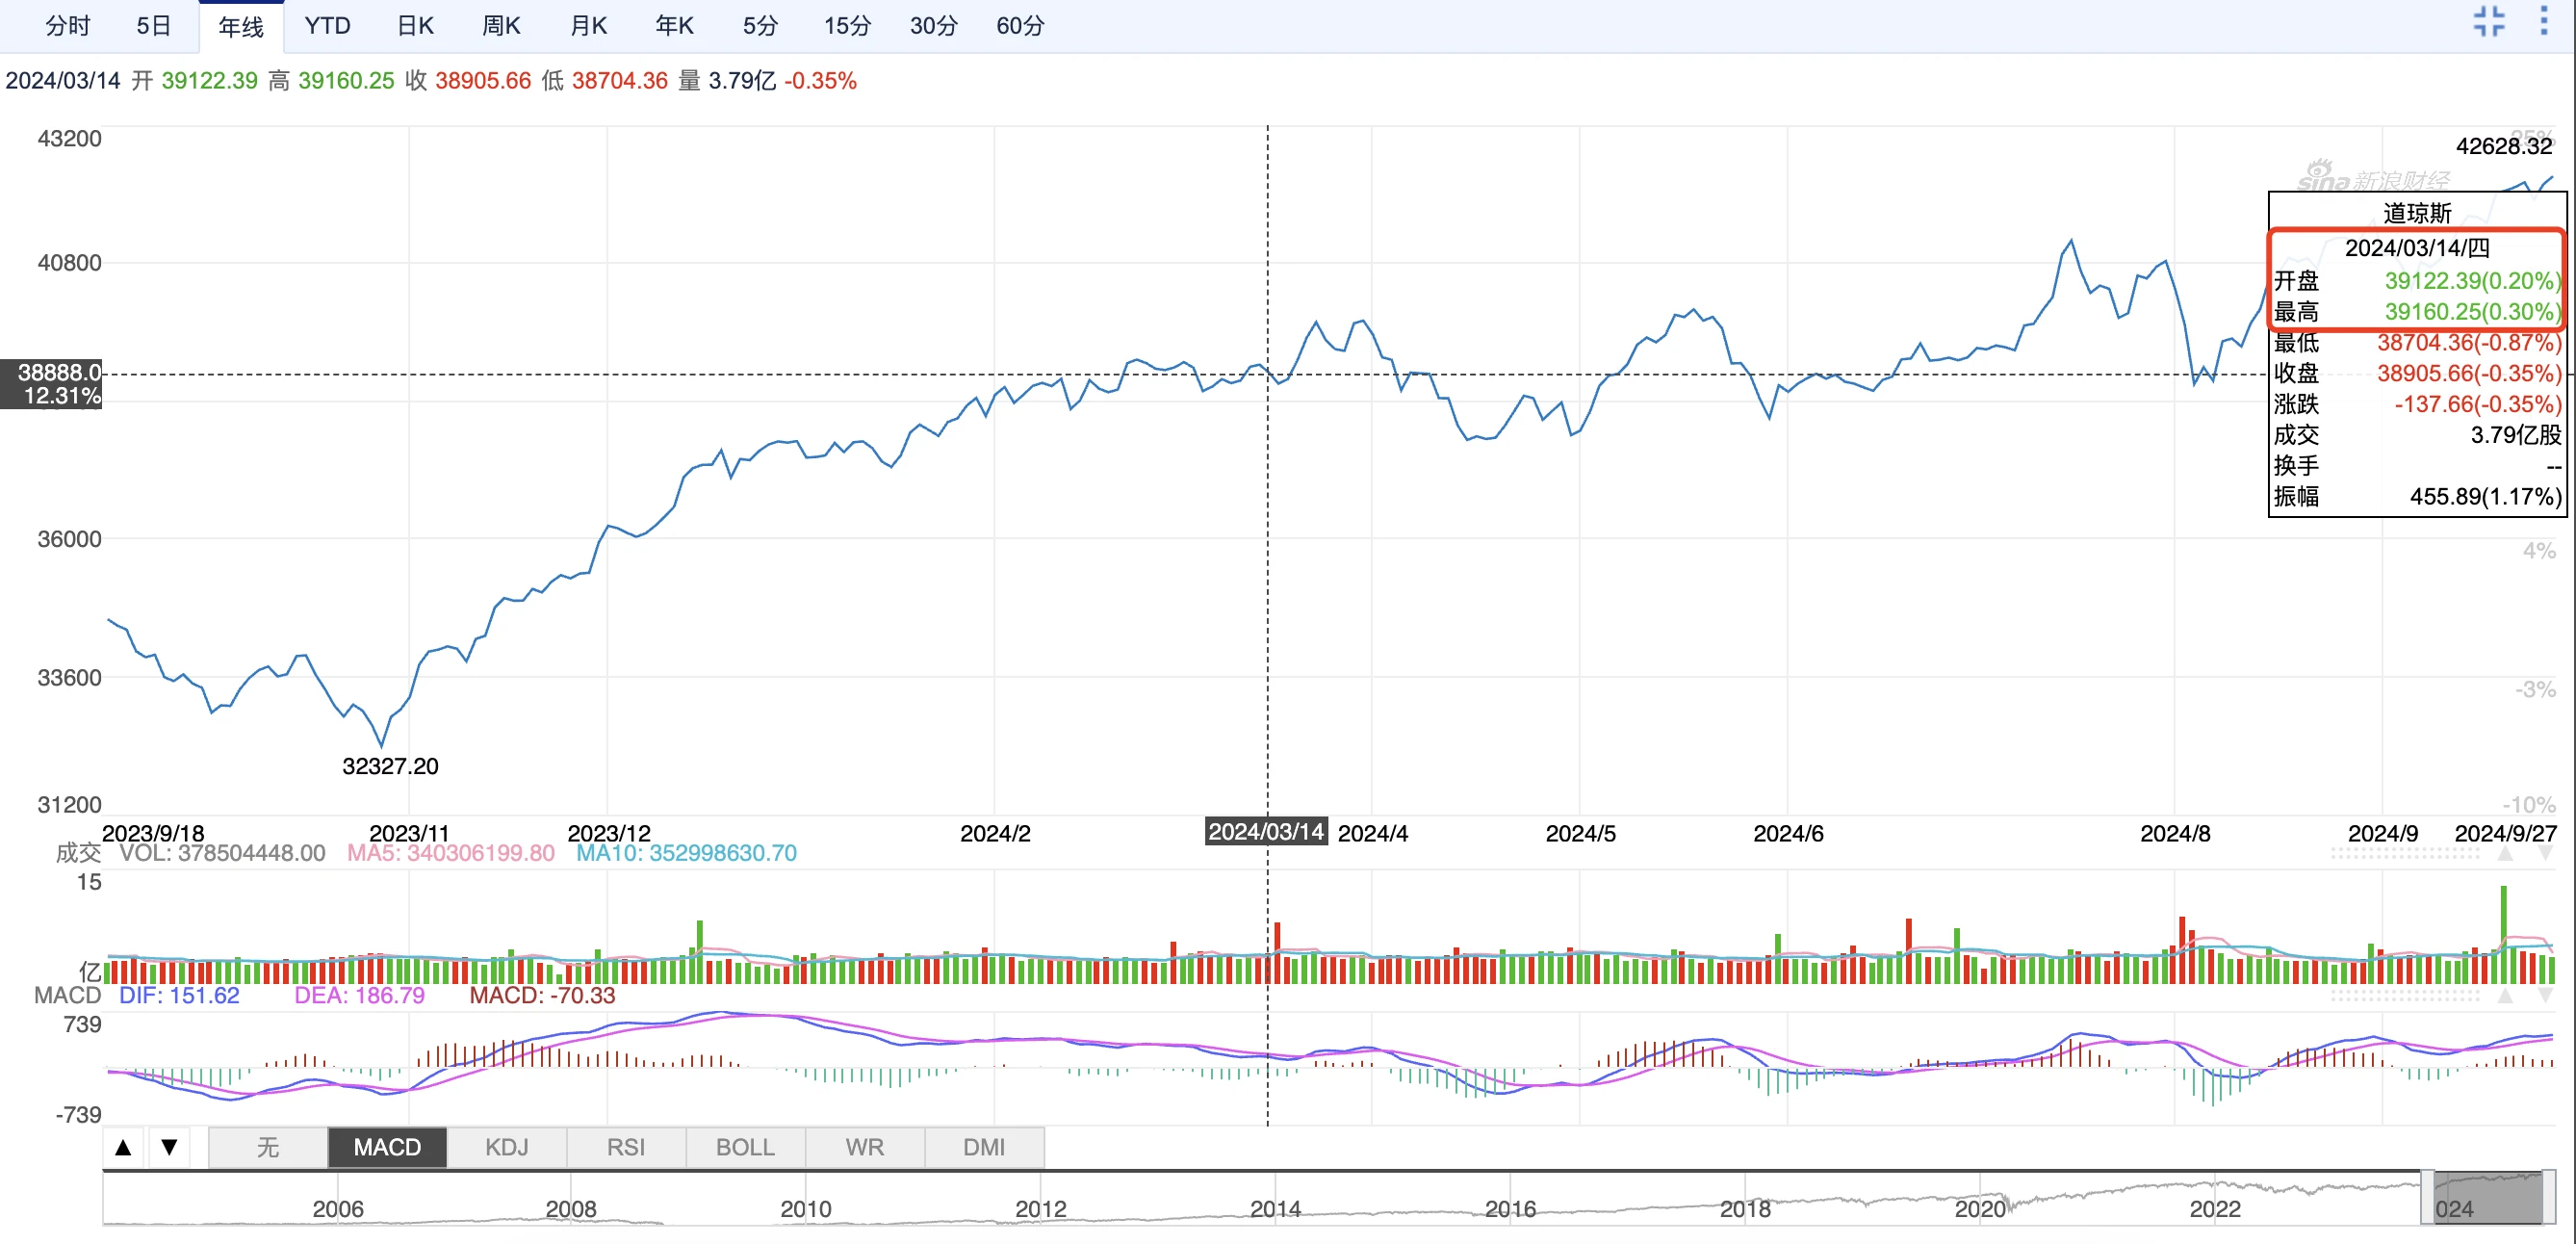
US Dow Jones
April 20 - Halving Arrives, Results Unexpected
On April 20, Bitcoin successfully completed its fourth halving. Before the halving, discussions about Bitcoin's price were varied; some believed that the halving would promote a rapid increase in Bitcoin's price in the short term, while others thought it would lead to a decrease in mining revenue and a sharp drop in miners' income. The story that followed is well known: Bitcoin's price did not rise rapidly and even fell below $60,000 at one point; miners' income did not sharply decline but instead benefited from the growth of Bitcoin ecosystem projects like Rune, with daily income once exceeding historical highs.
At that time,
BTC price was around $63,988;
A-share Shanghai Composite Index was around 3,066 points;
US Dow Jones data was around 37,918 points.

BTC Price
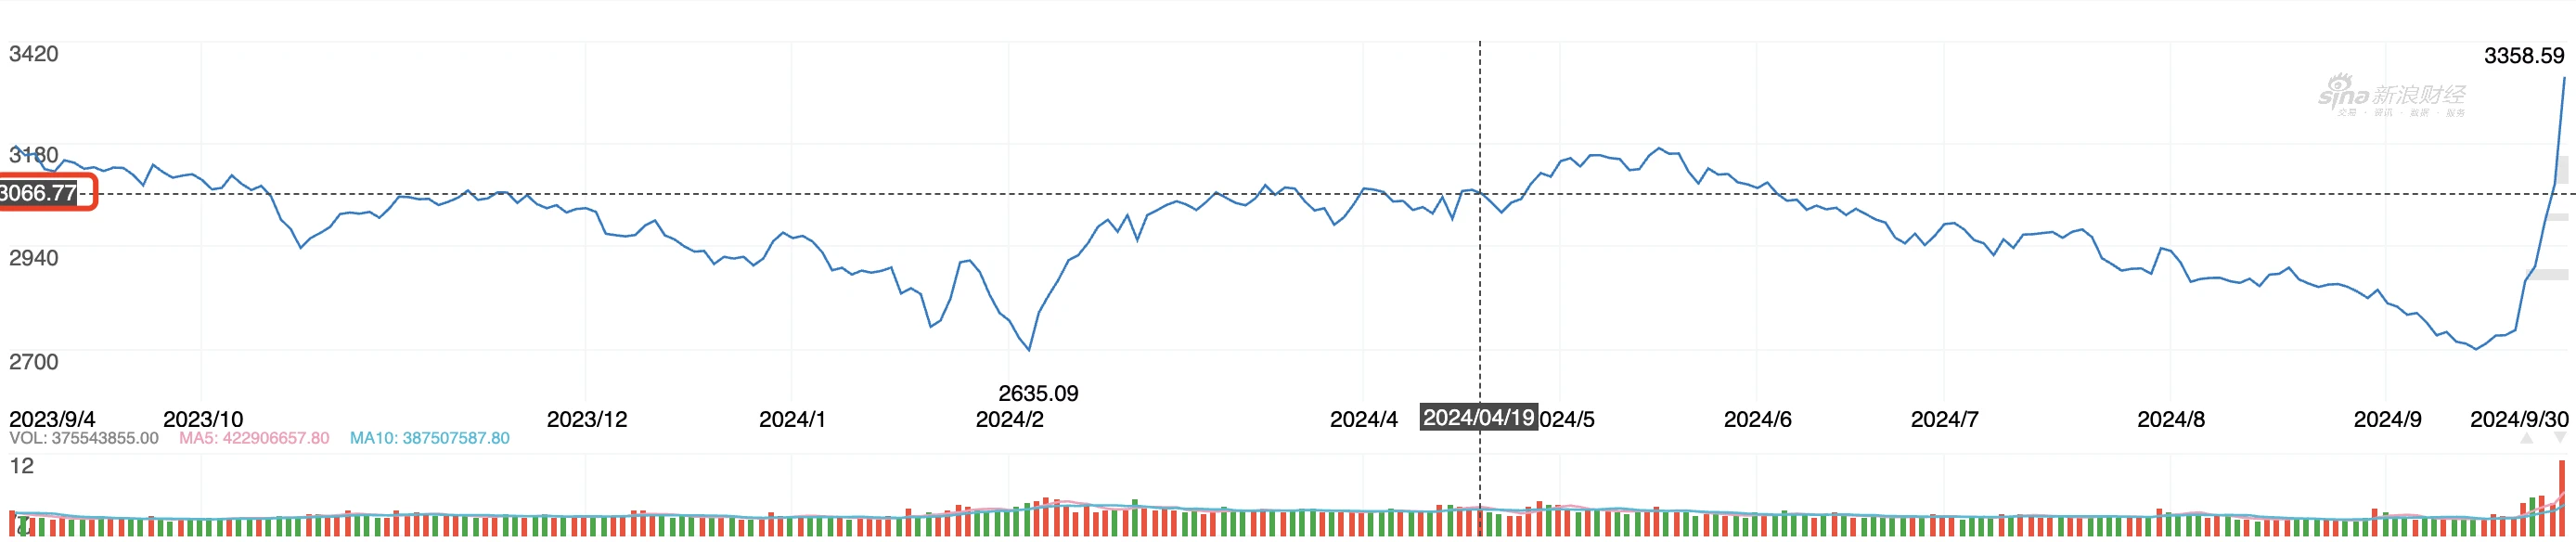
Shanghai Composite Index
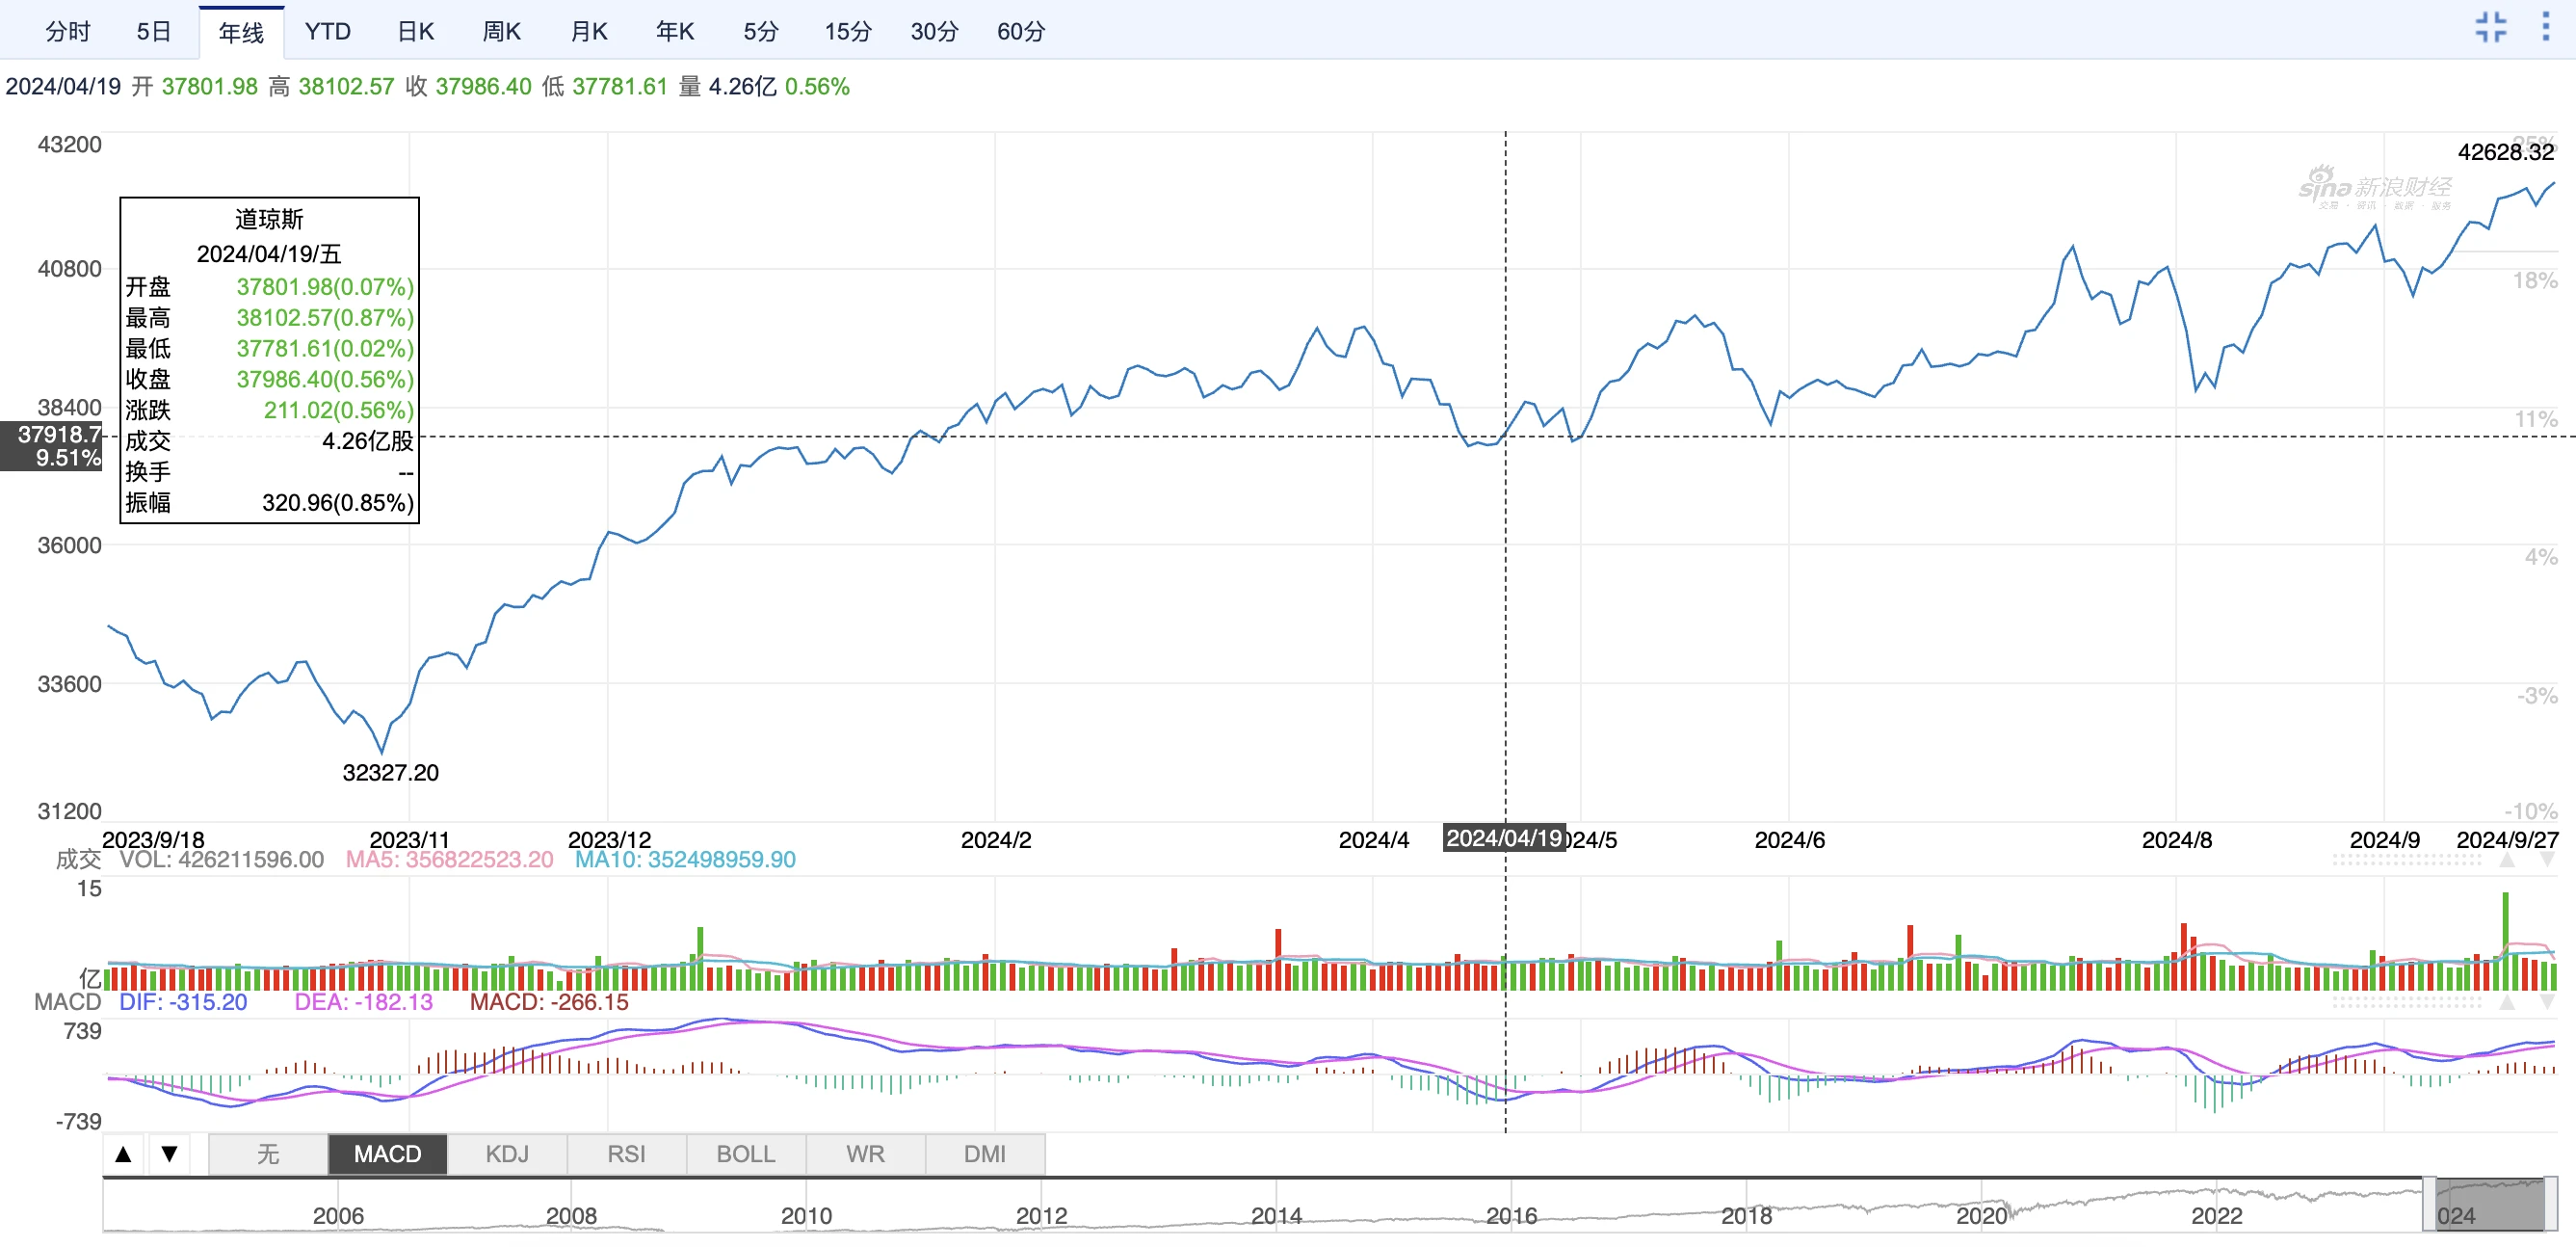
US Dow Jones
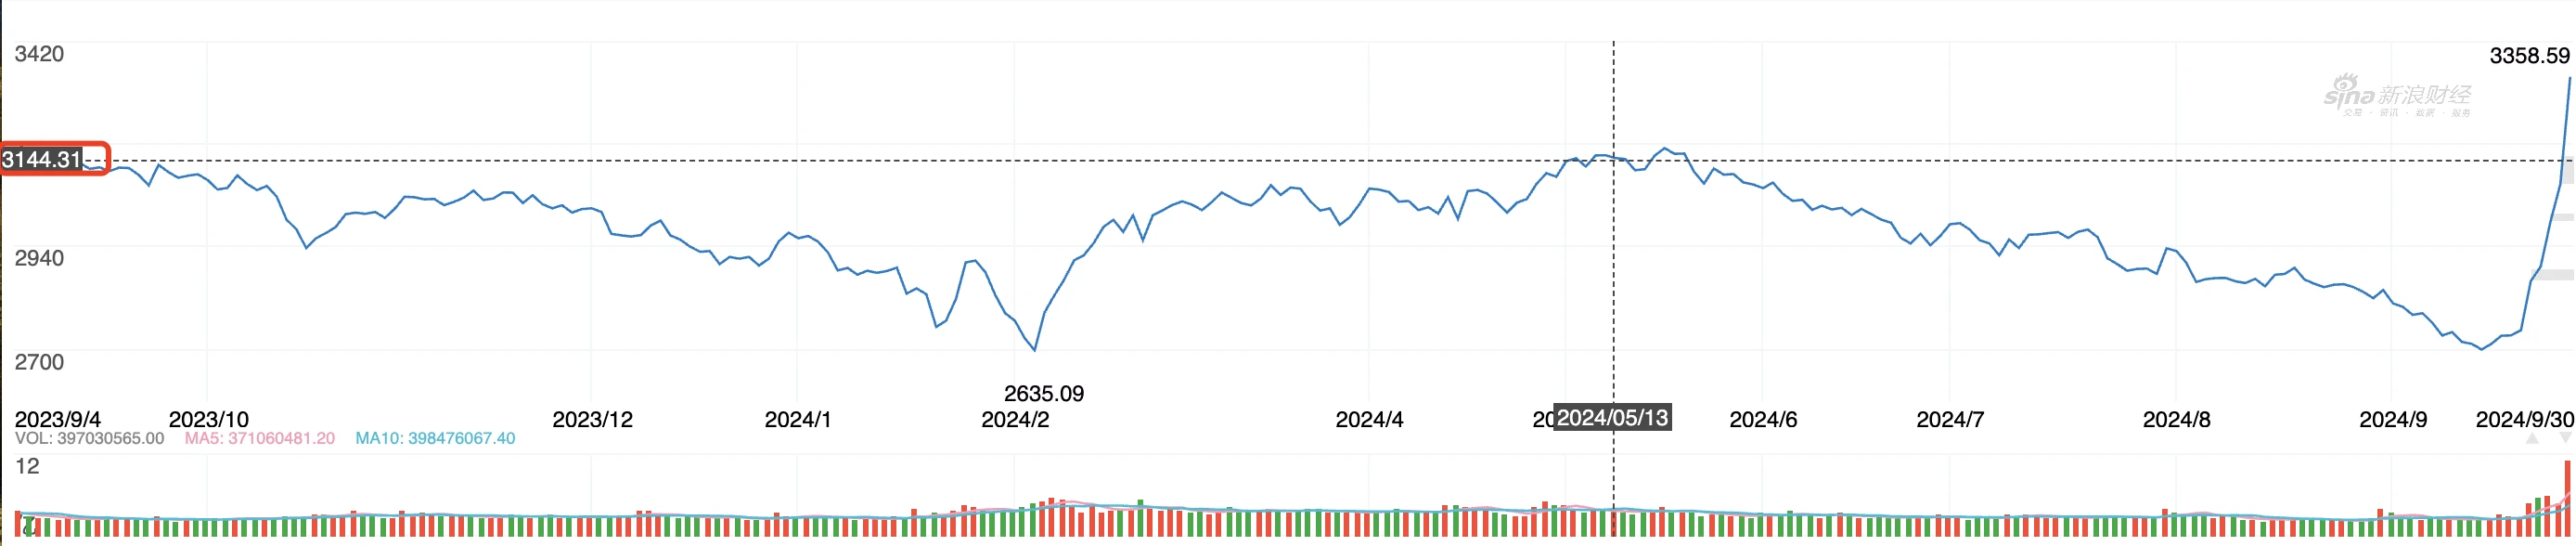
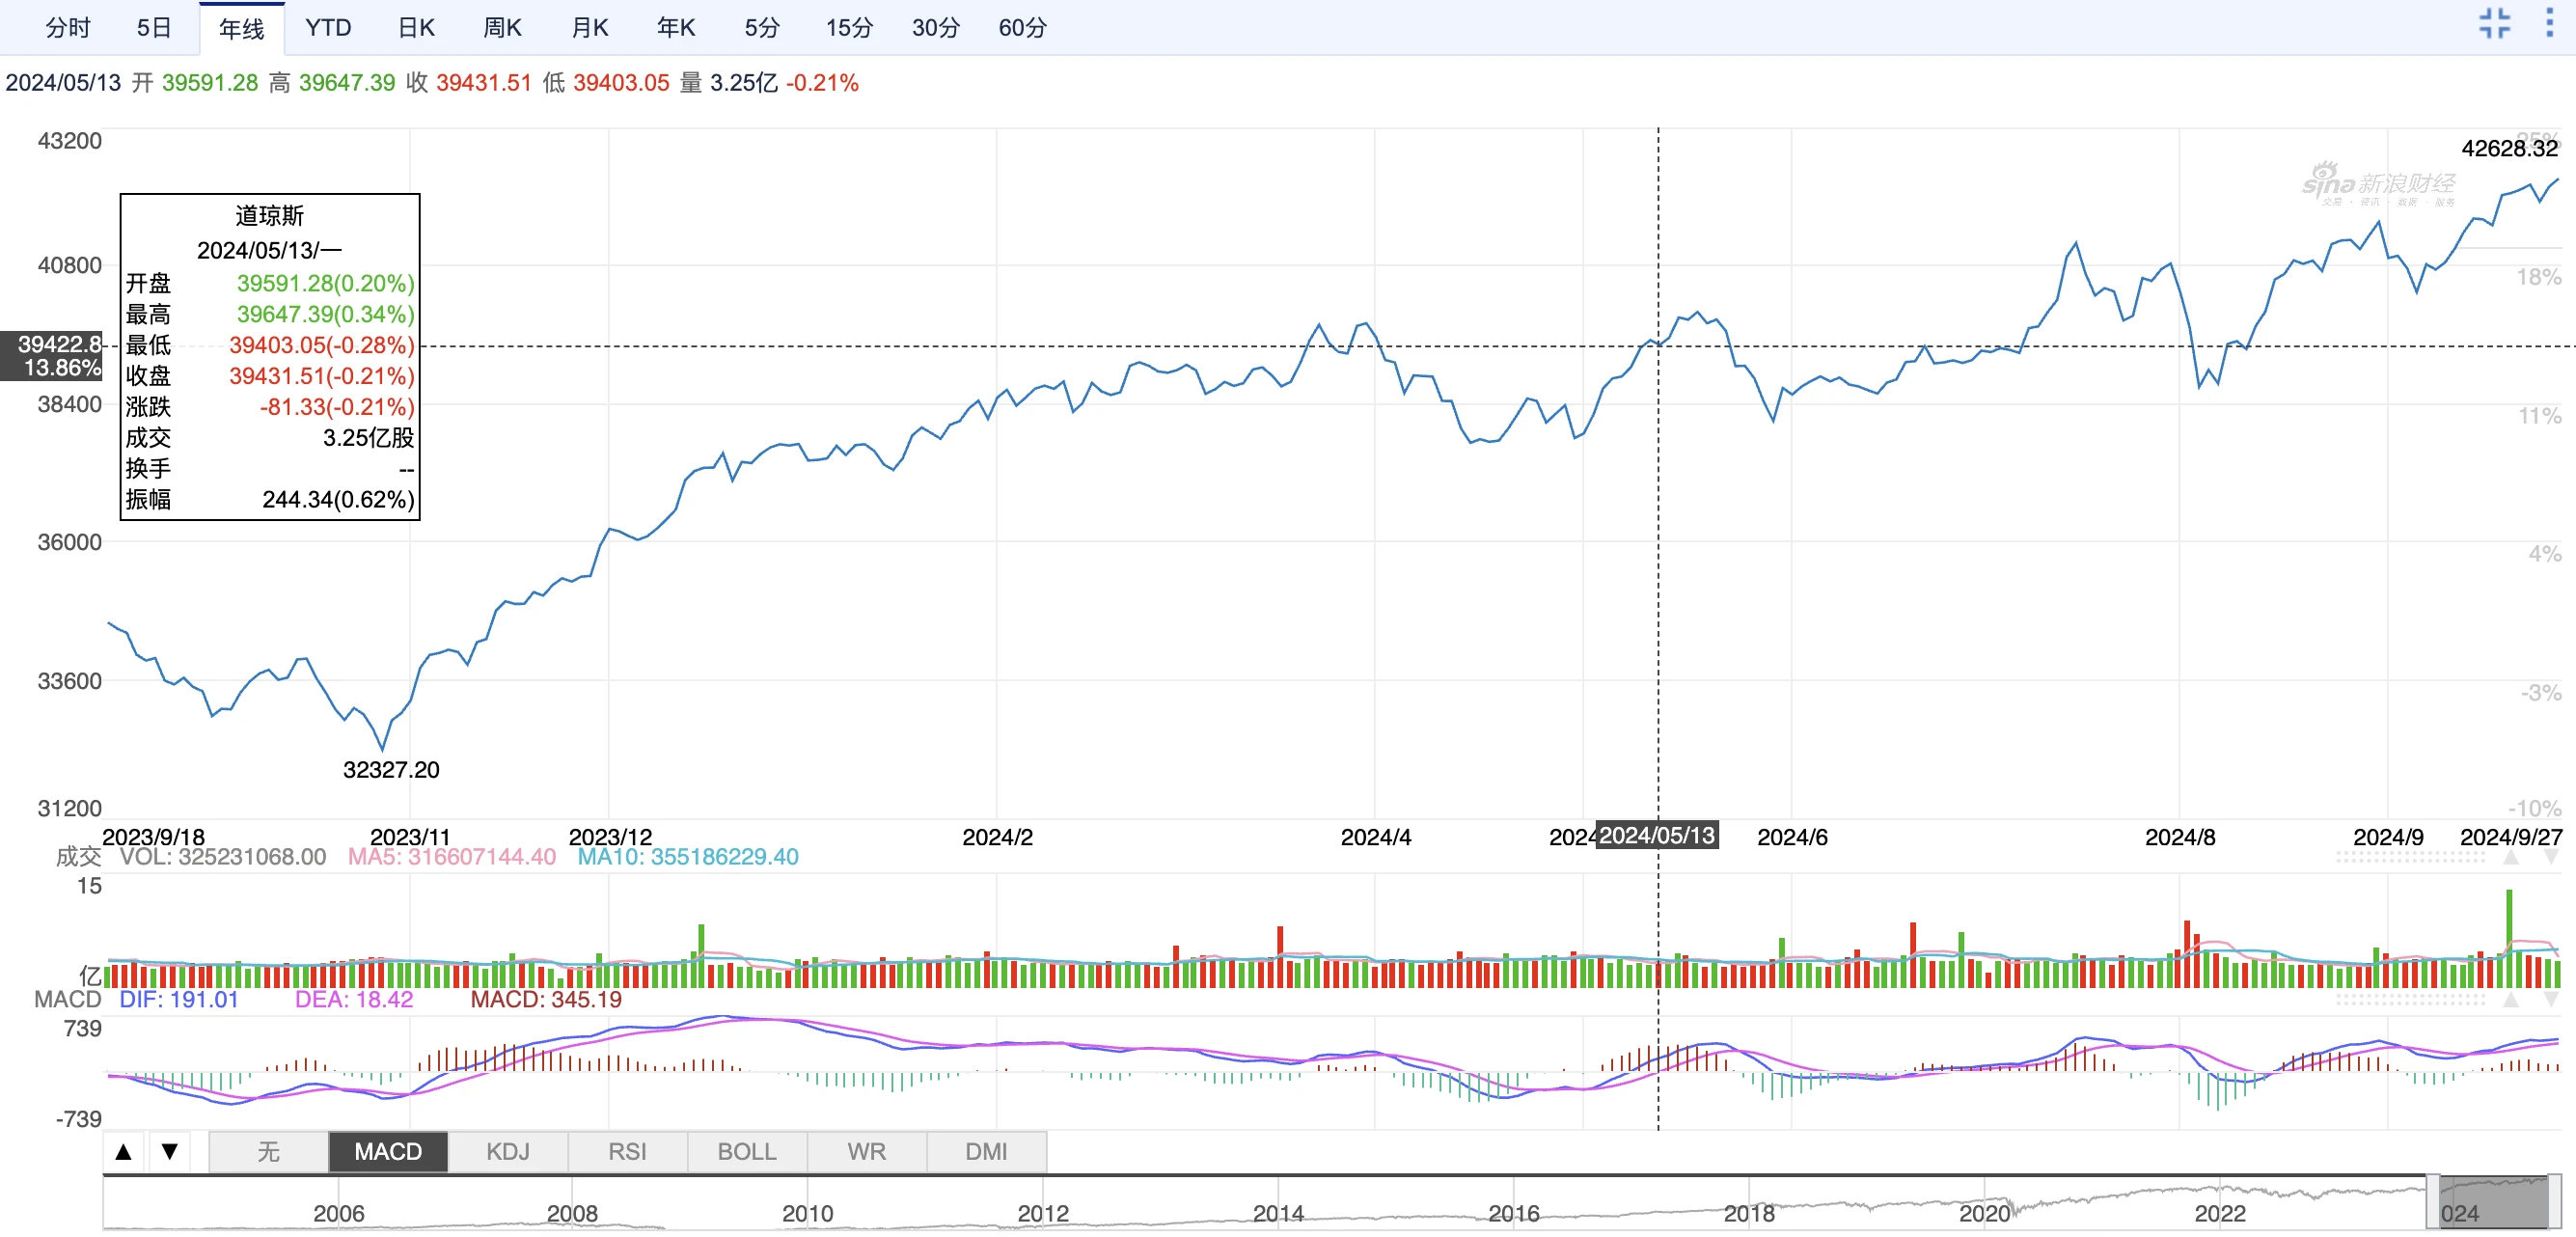
May 12 - BTC Plummets Then Rises, Regional Political Situation's Influence Grows
In early May, after experiencing a flash crash on the 1st and 2nd, Bitcoin's price gradually stabilized and climbed to around $60,000. However, at the same time, the increasingly tense political situation in the Middle East and the heated political climate brought about by the US presidential election cast a shadow over the development of both the cryptocurrency market and traditional financial markets, including the US stock market. Compared to the "disappointment and even despair in the turbulent market" in July and August, many cryptocurrency investment institutions and industry insiders remained mostly optimistic about the market at that time. For more information, see "3-Minute Overview of Bitcoin's Future Outlook: Moving Towards…?"
At that time,
BTC price was around $60,776;
A-share Shanghai Composite Index was around 3,144 points;
US Dow Jones data was around 39,422 points.

BTC Price
Shanghai Composite Index
US Dow Jones
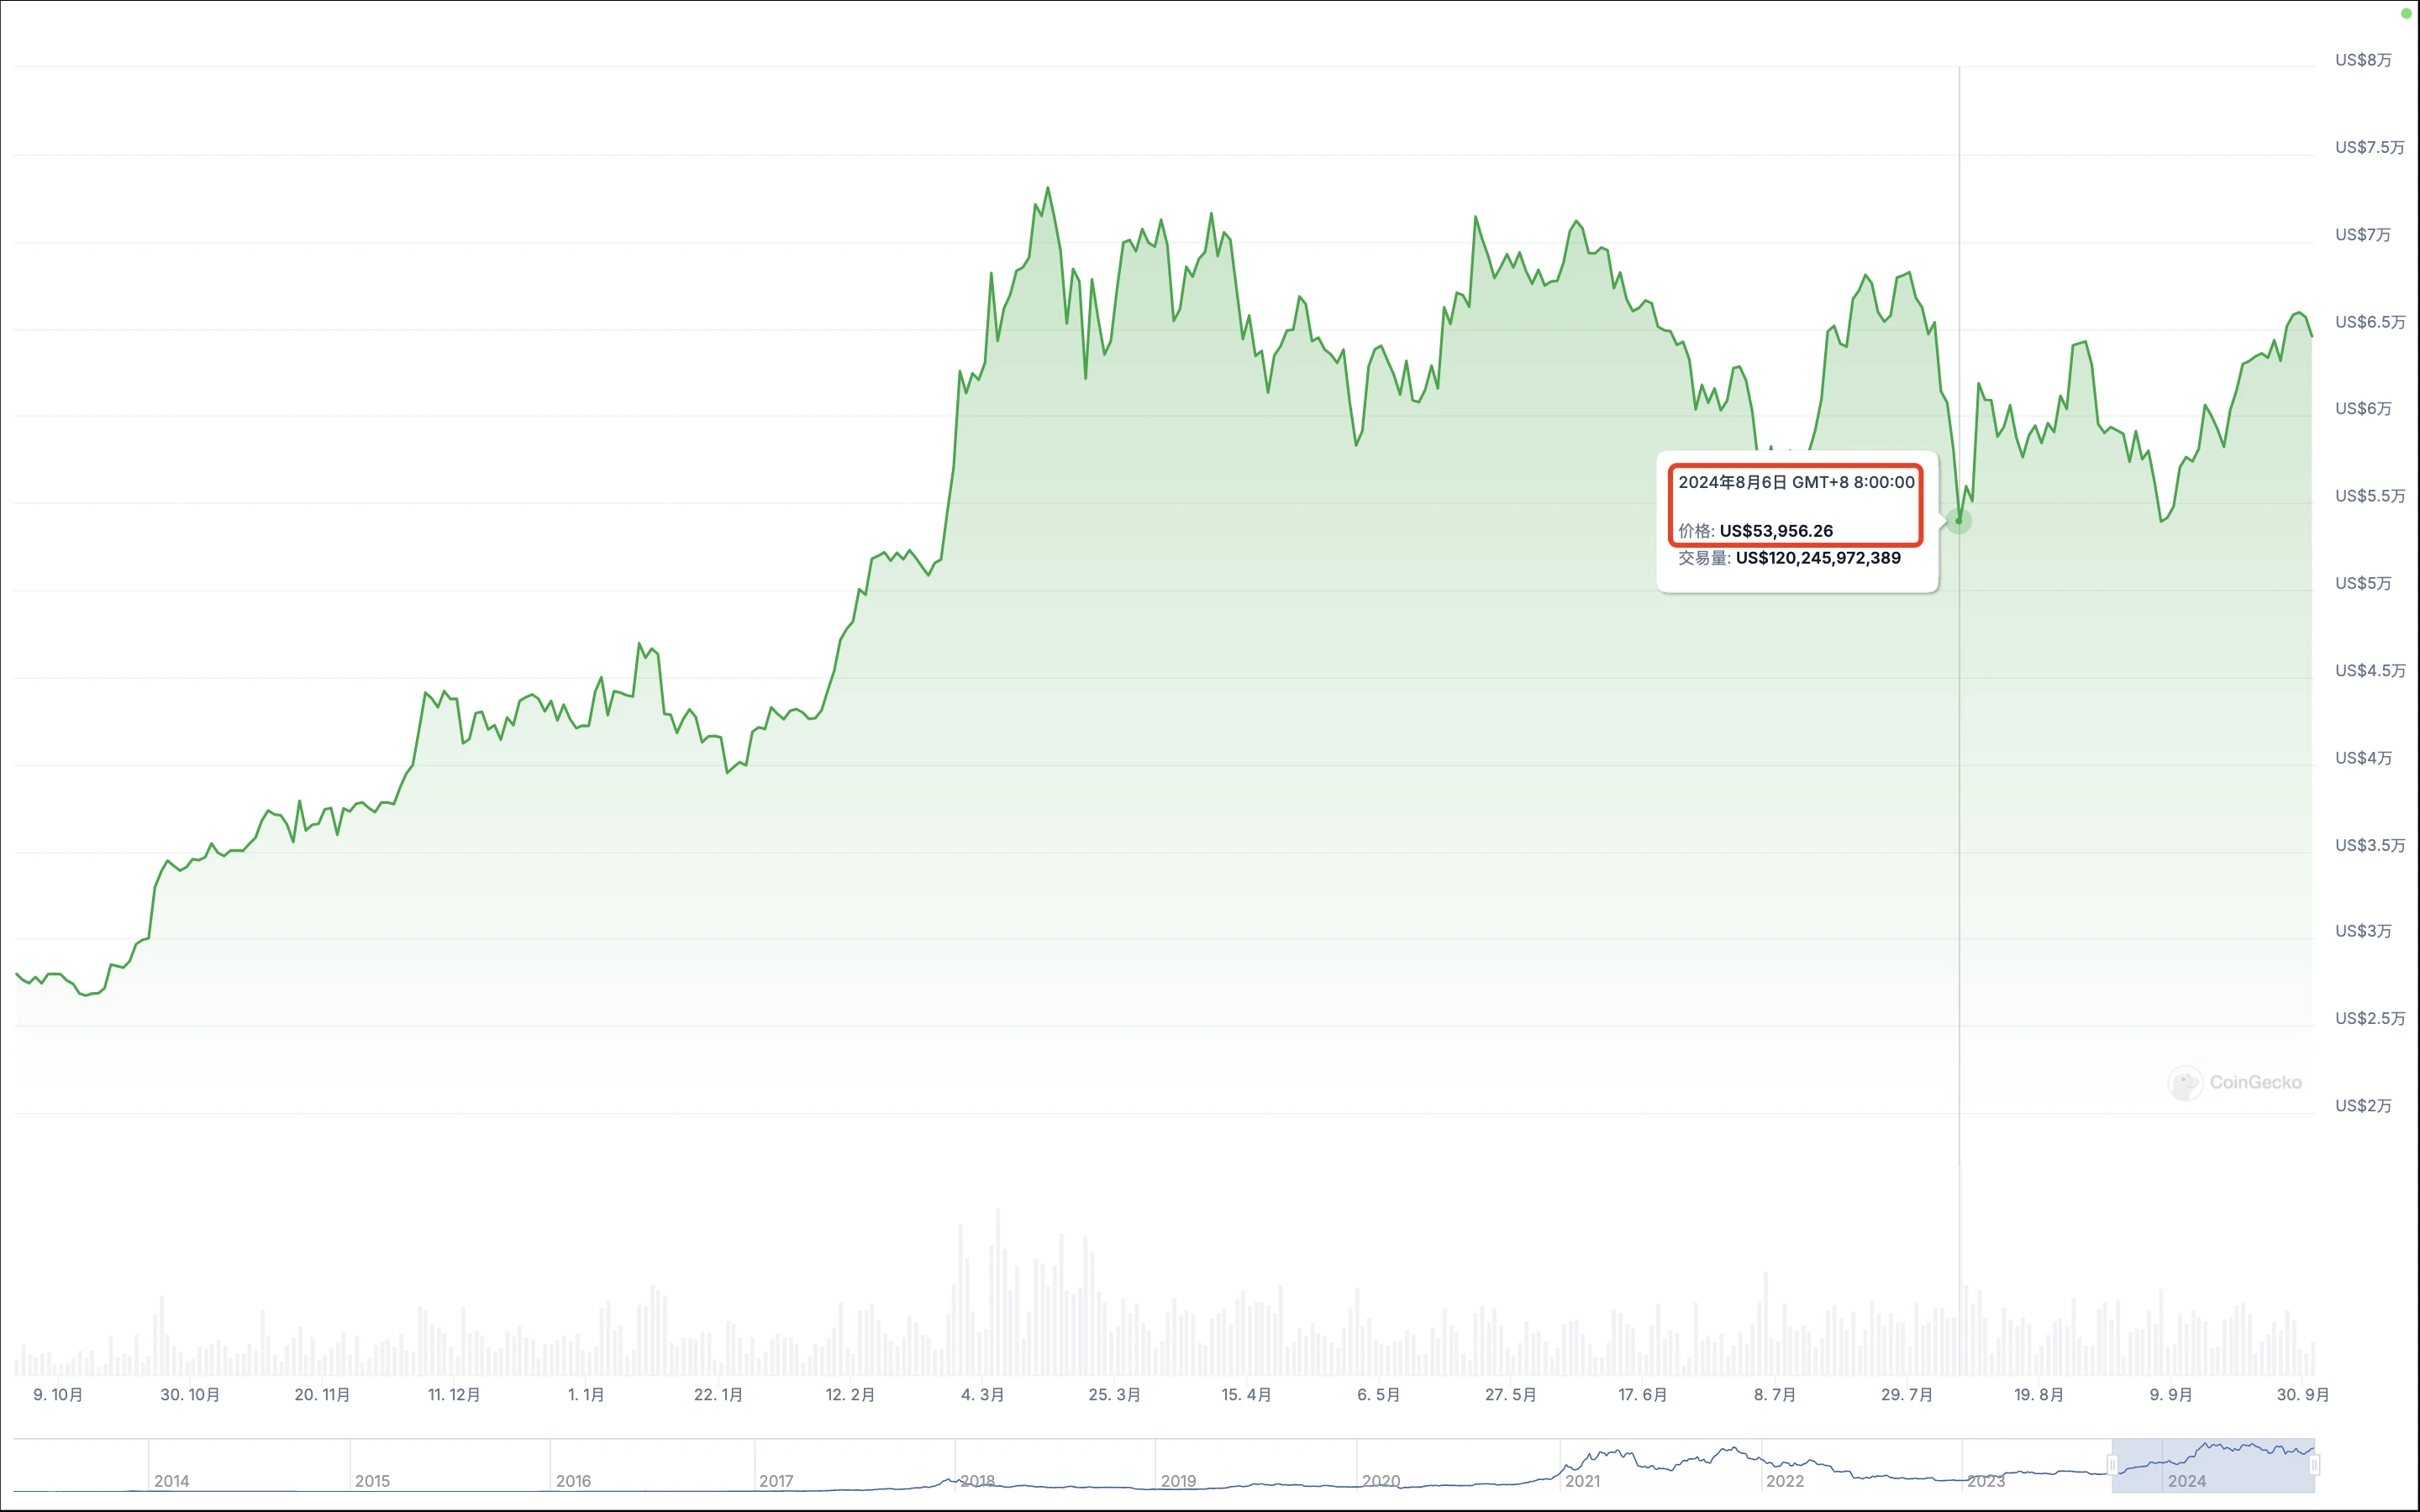
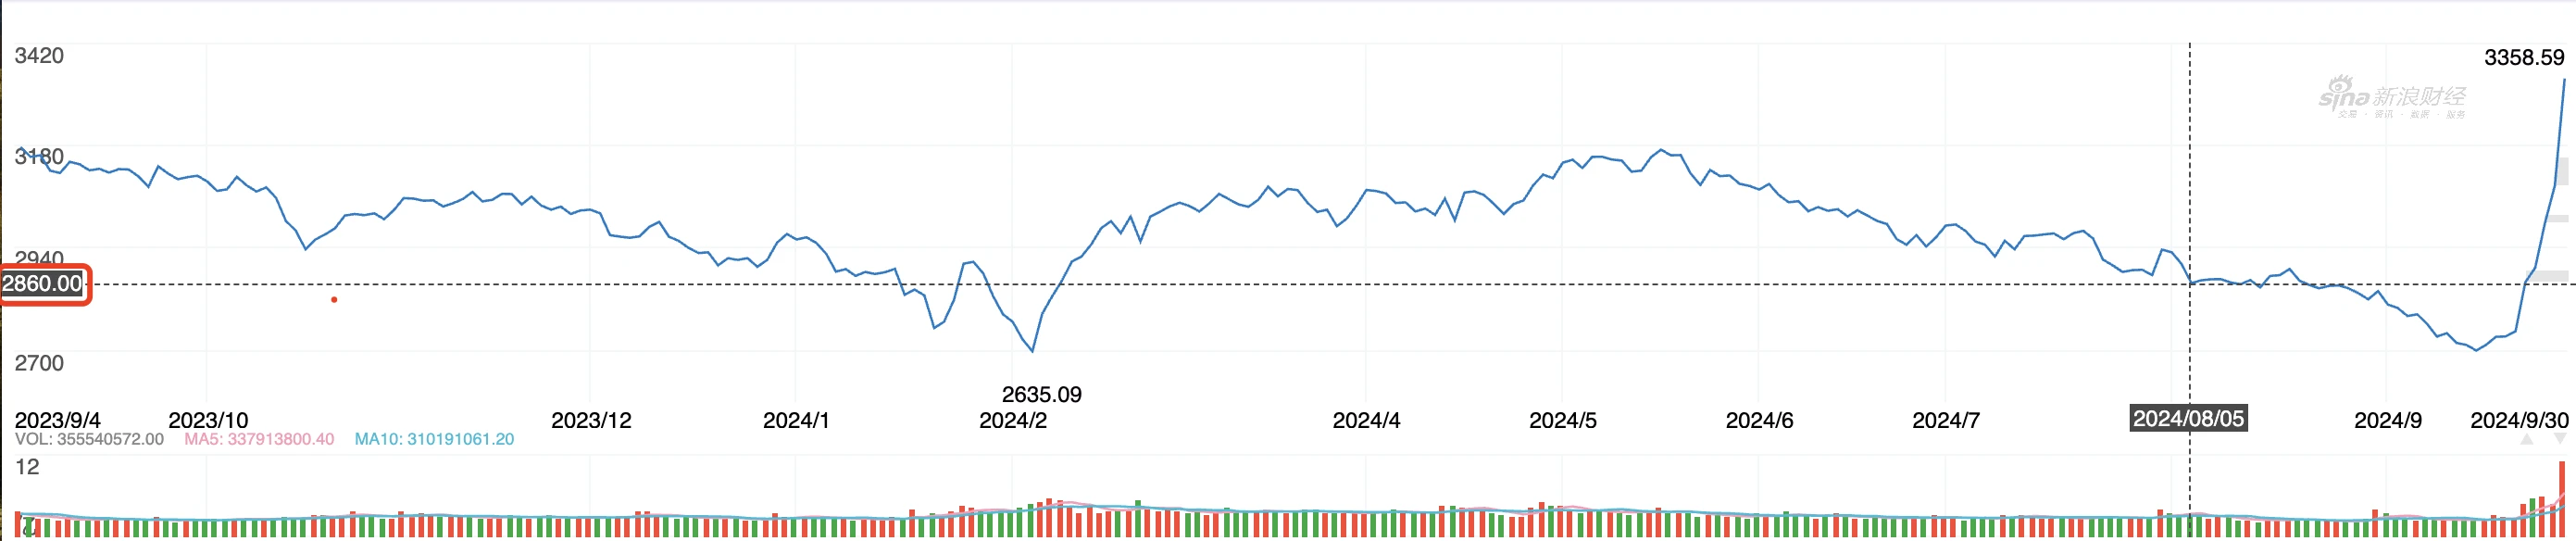
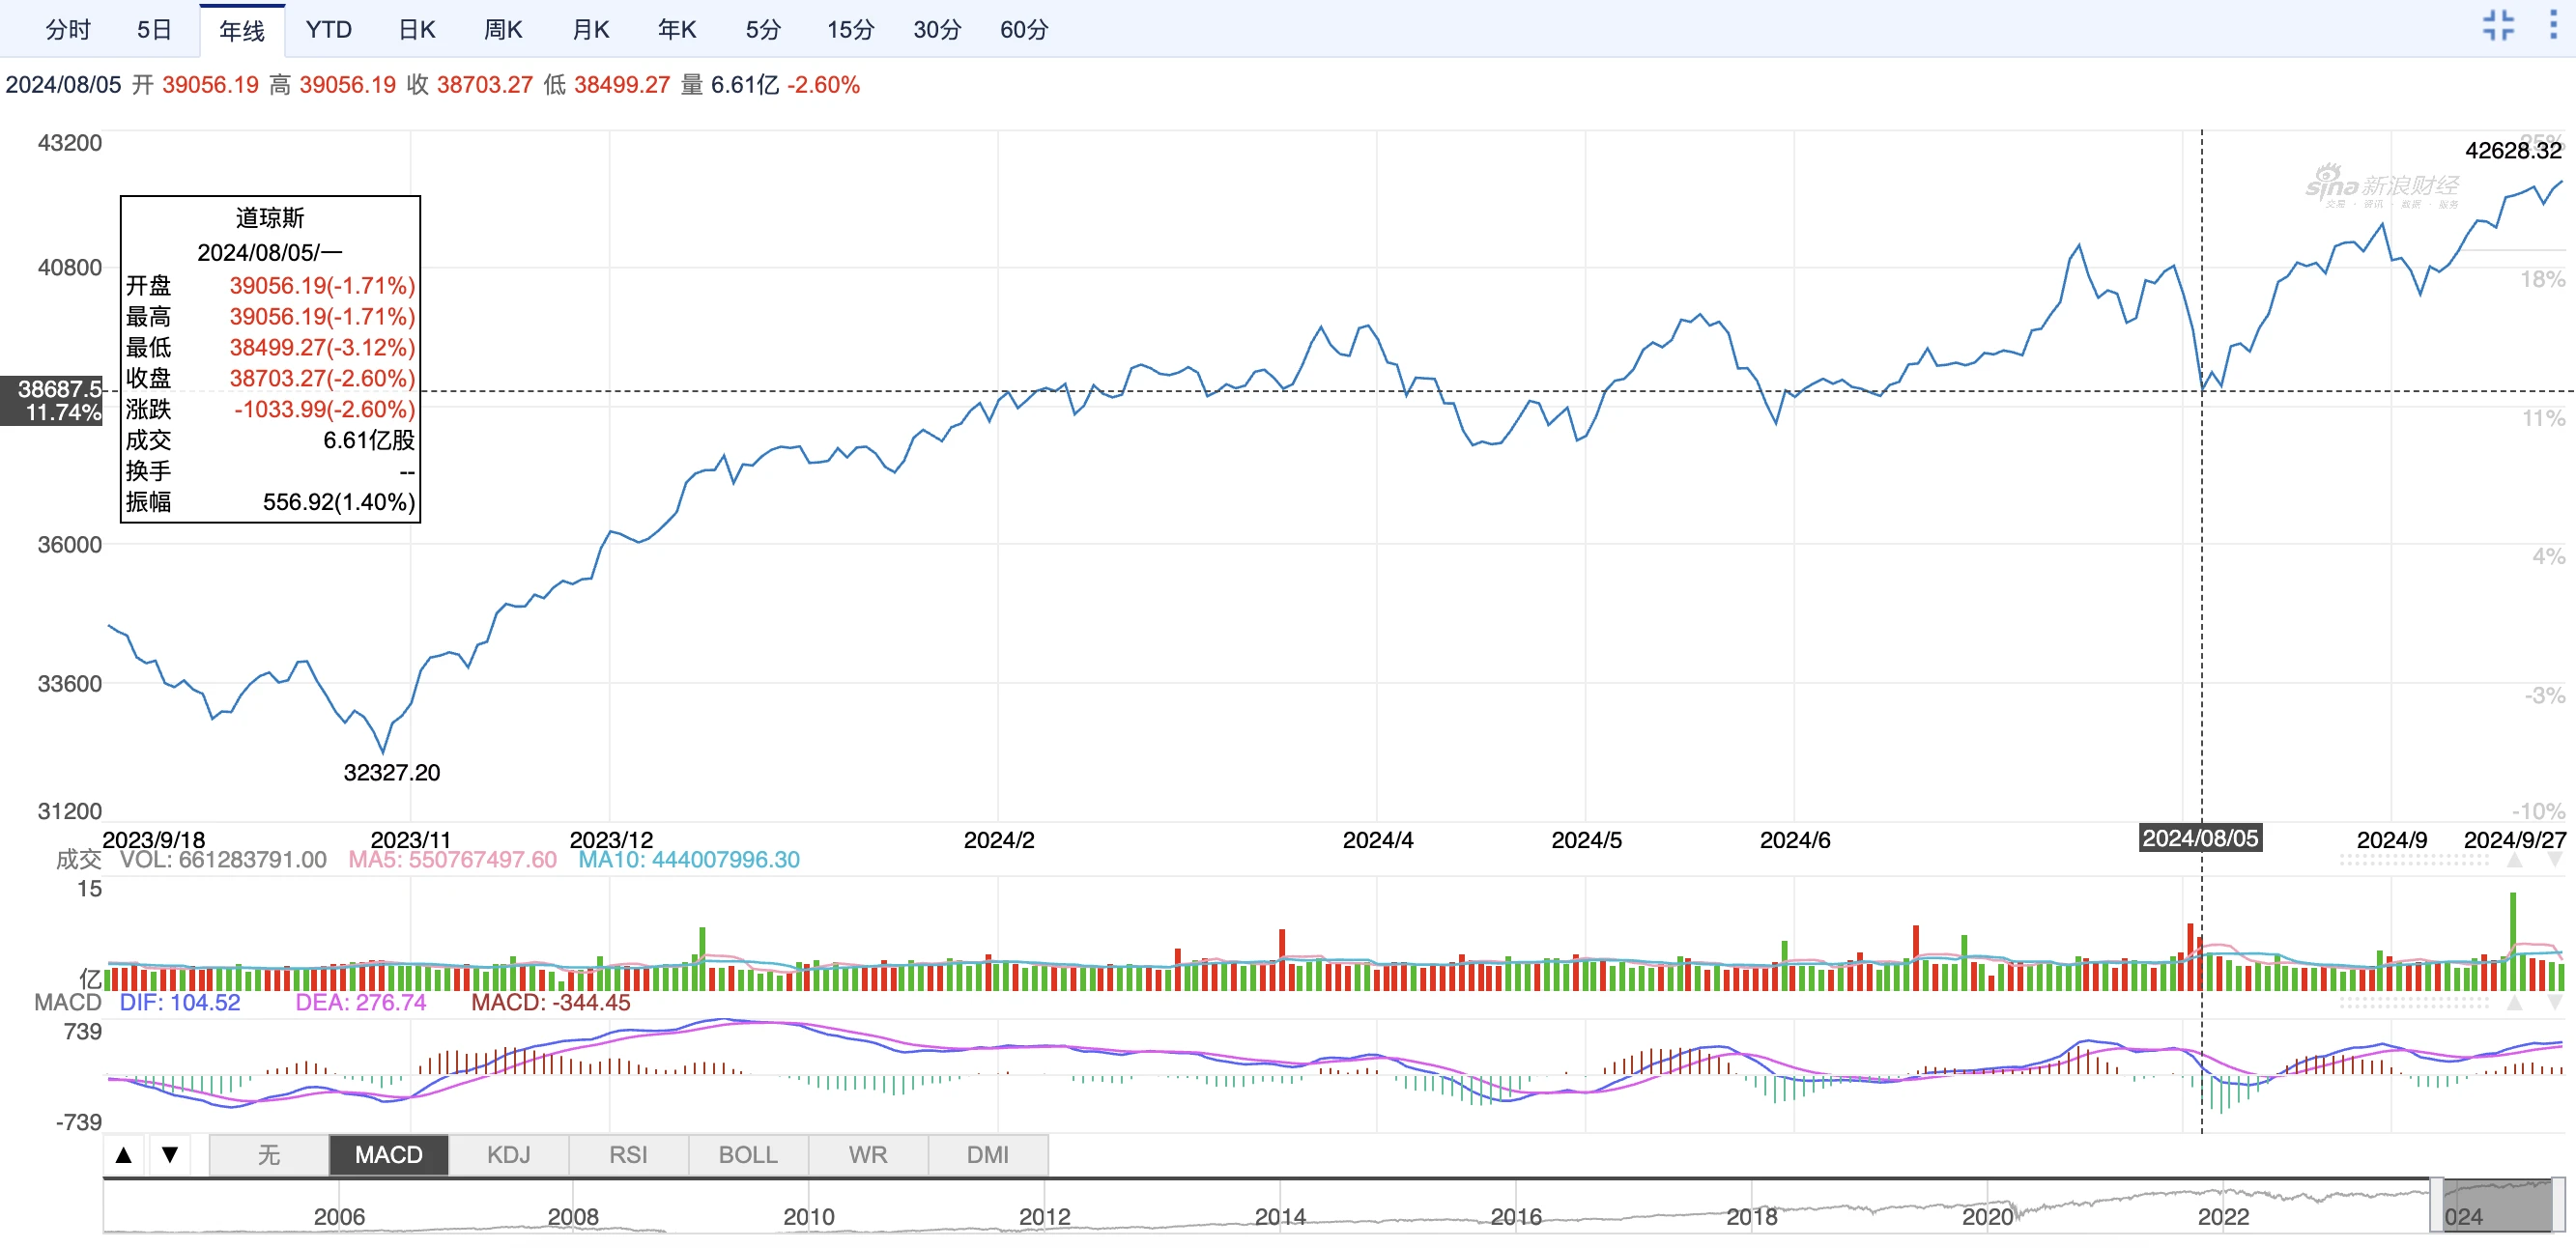
August 5 - BTC Falls $15,000 in Four Days, Market in Panic
On August 5, perhaps a day that many cryptocurrency industry practitioners still recall with a cold sweat. Around 2 PM that day, according to OKX market data, Bitcoin's price fell to $48,934.8, with a 24-hour drop of 15%, and a total decline of $15,000 in four days, marking the largest drop of the year up to that point, plunging the cryptocurrency market into extreme panic. Looking back, the panic at that time was undoubtedly influenced by the immense pressure of the global macroeconomic downturn, with the US stock market losing nearly $3 trillion in market value overnight, equivalent to 2.5 times the cryptocurrency market. This event once again verified that the cryptocurrency market is increasingly intertwined with the global economic market, and their market performances are closely related. As the old saying goes: "No eggs are unbroken under the fallen nest," the cryptocurrency market is also hard-pressed to remain unscathed. For more information, see "BTC Falls $15,000 in Four Days, Global Financial Markets Plunge into Panic."
At that time,
BTC price was around $53,956;
A-share Shanghai Composite Index was around 2,860 points;
US Dow Jones data was around 38,687 points.
BTC Price
Shanghai Composite Index
US Dow Jones
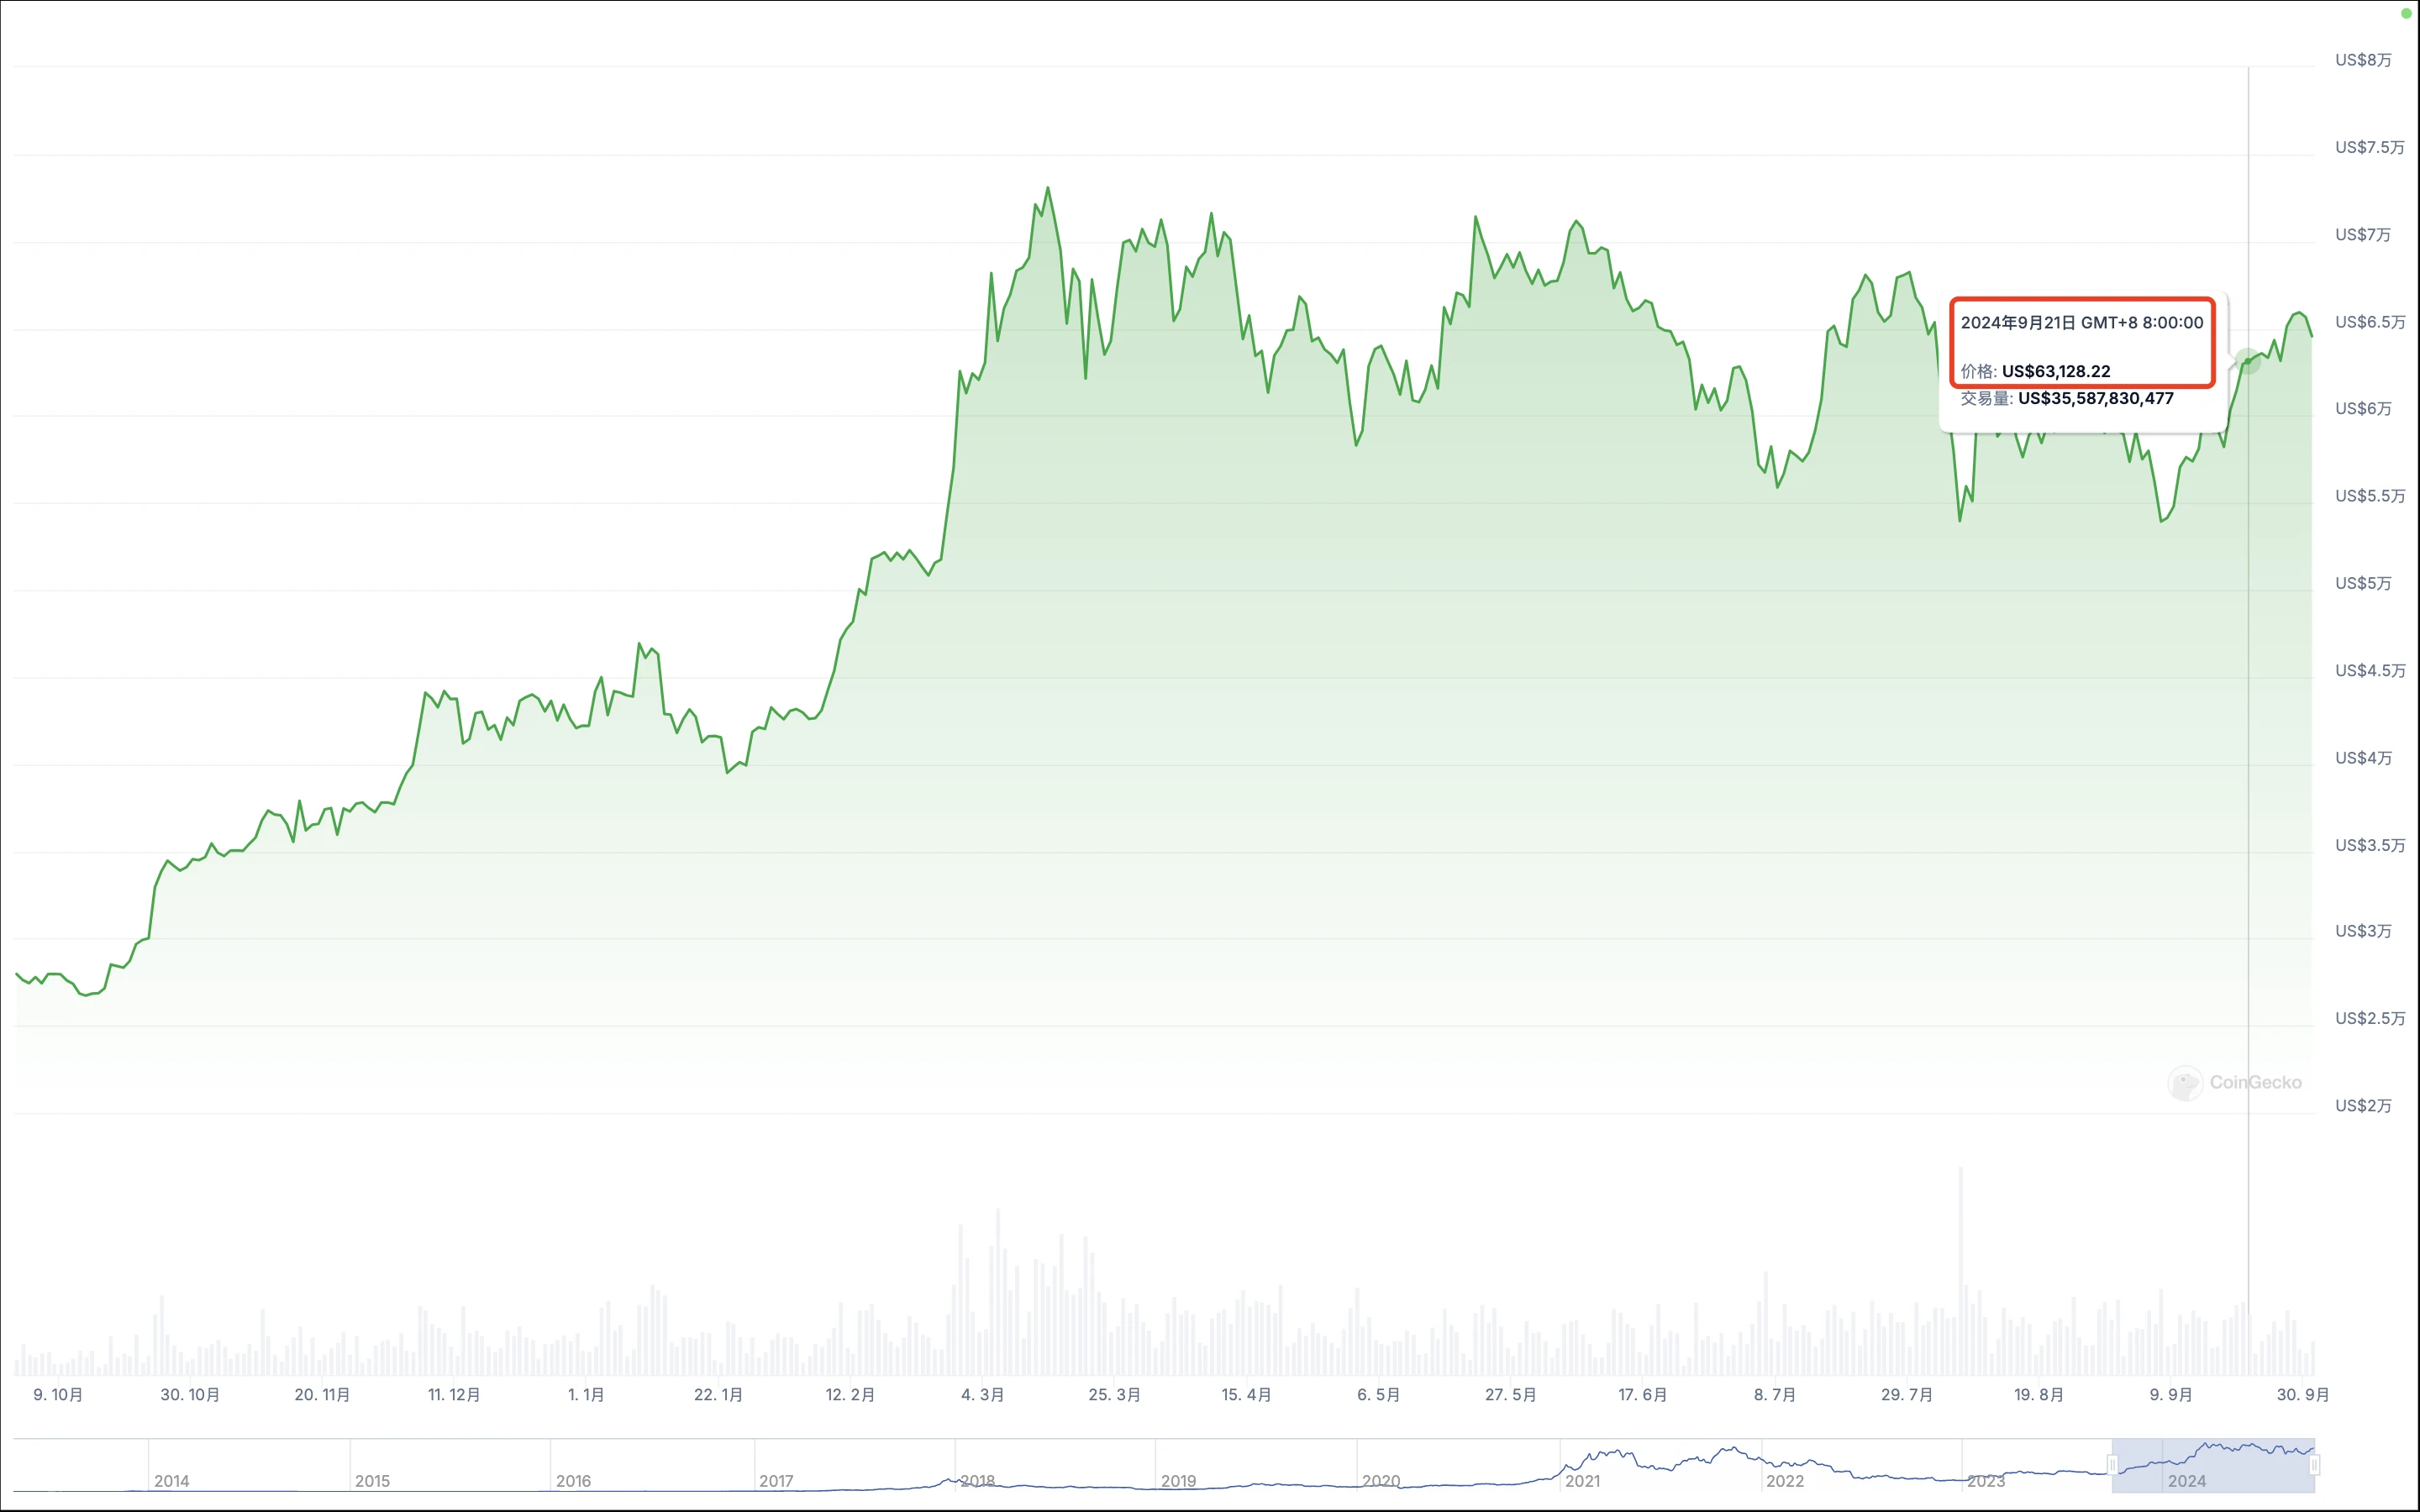
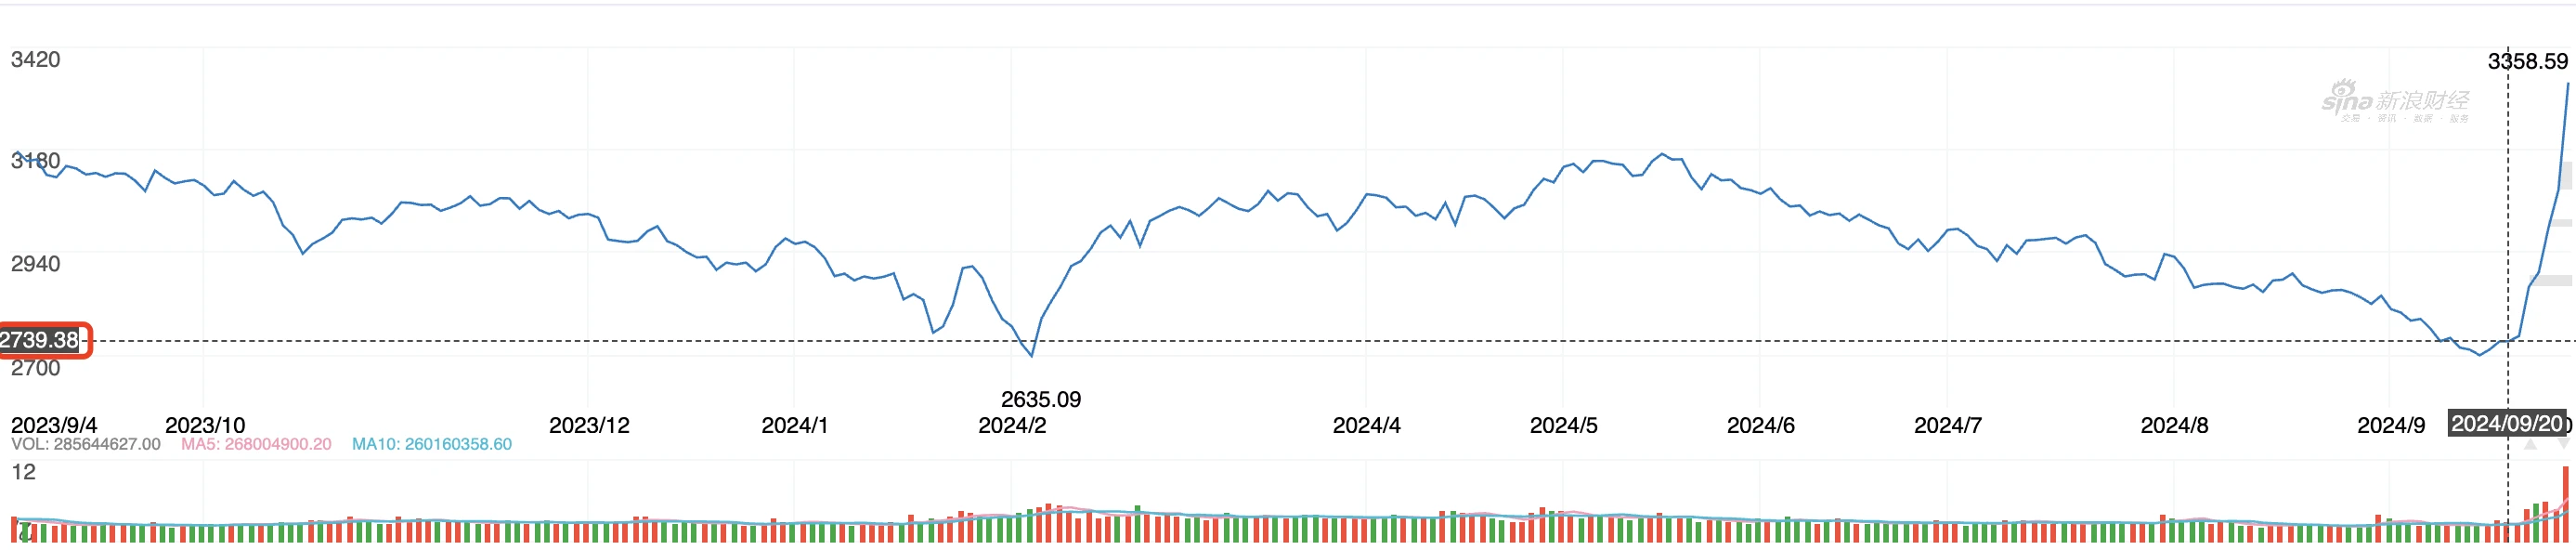
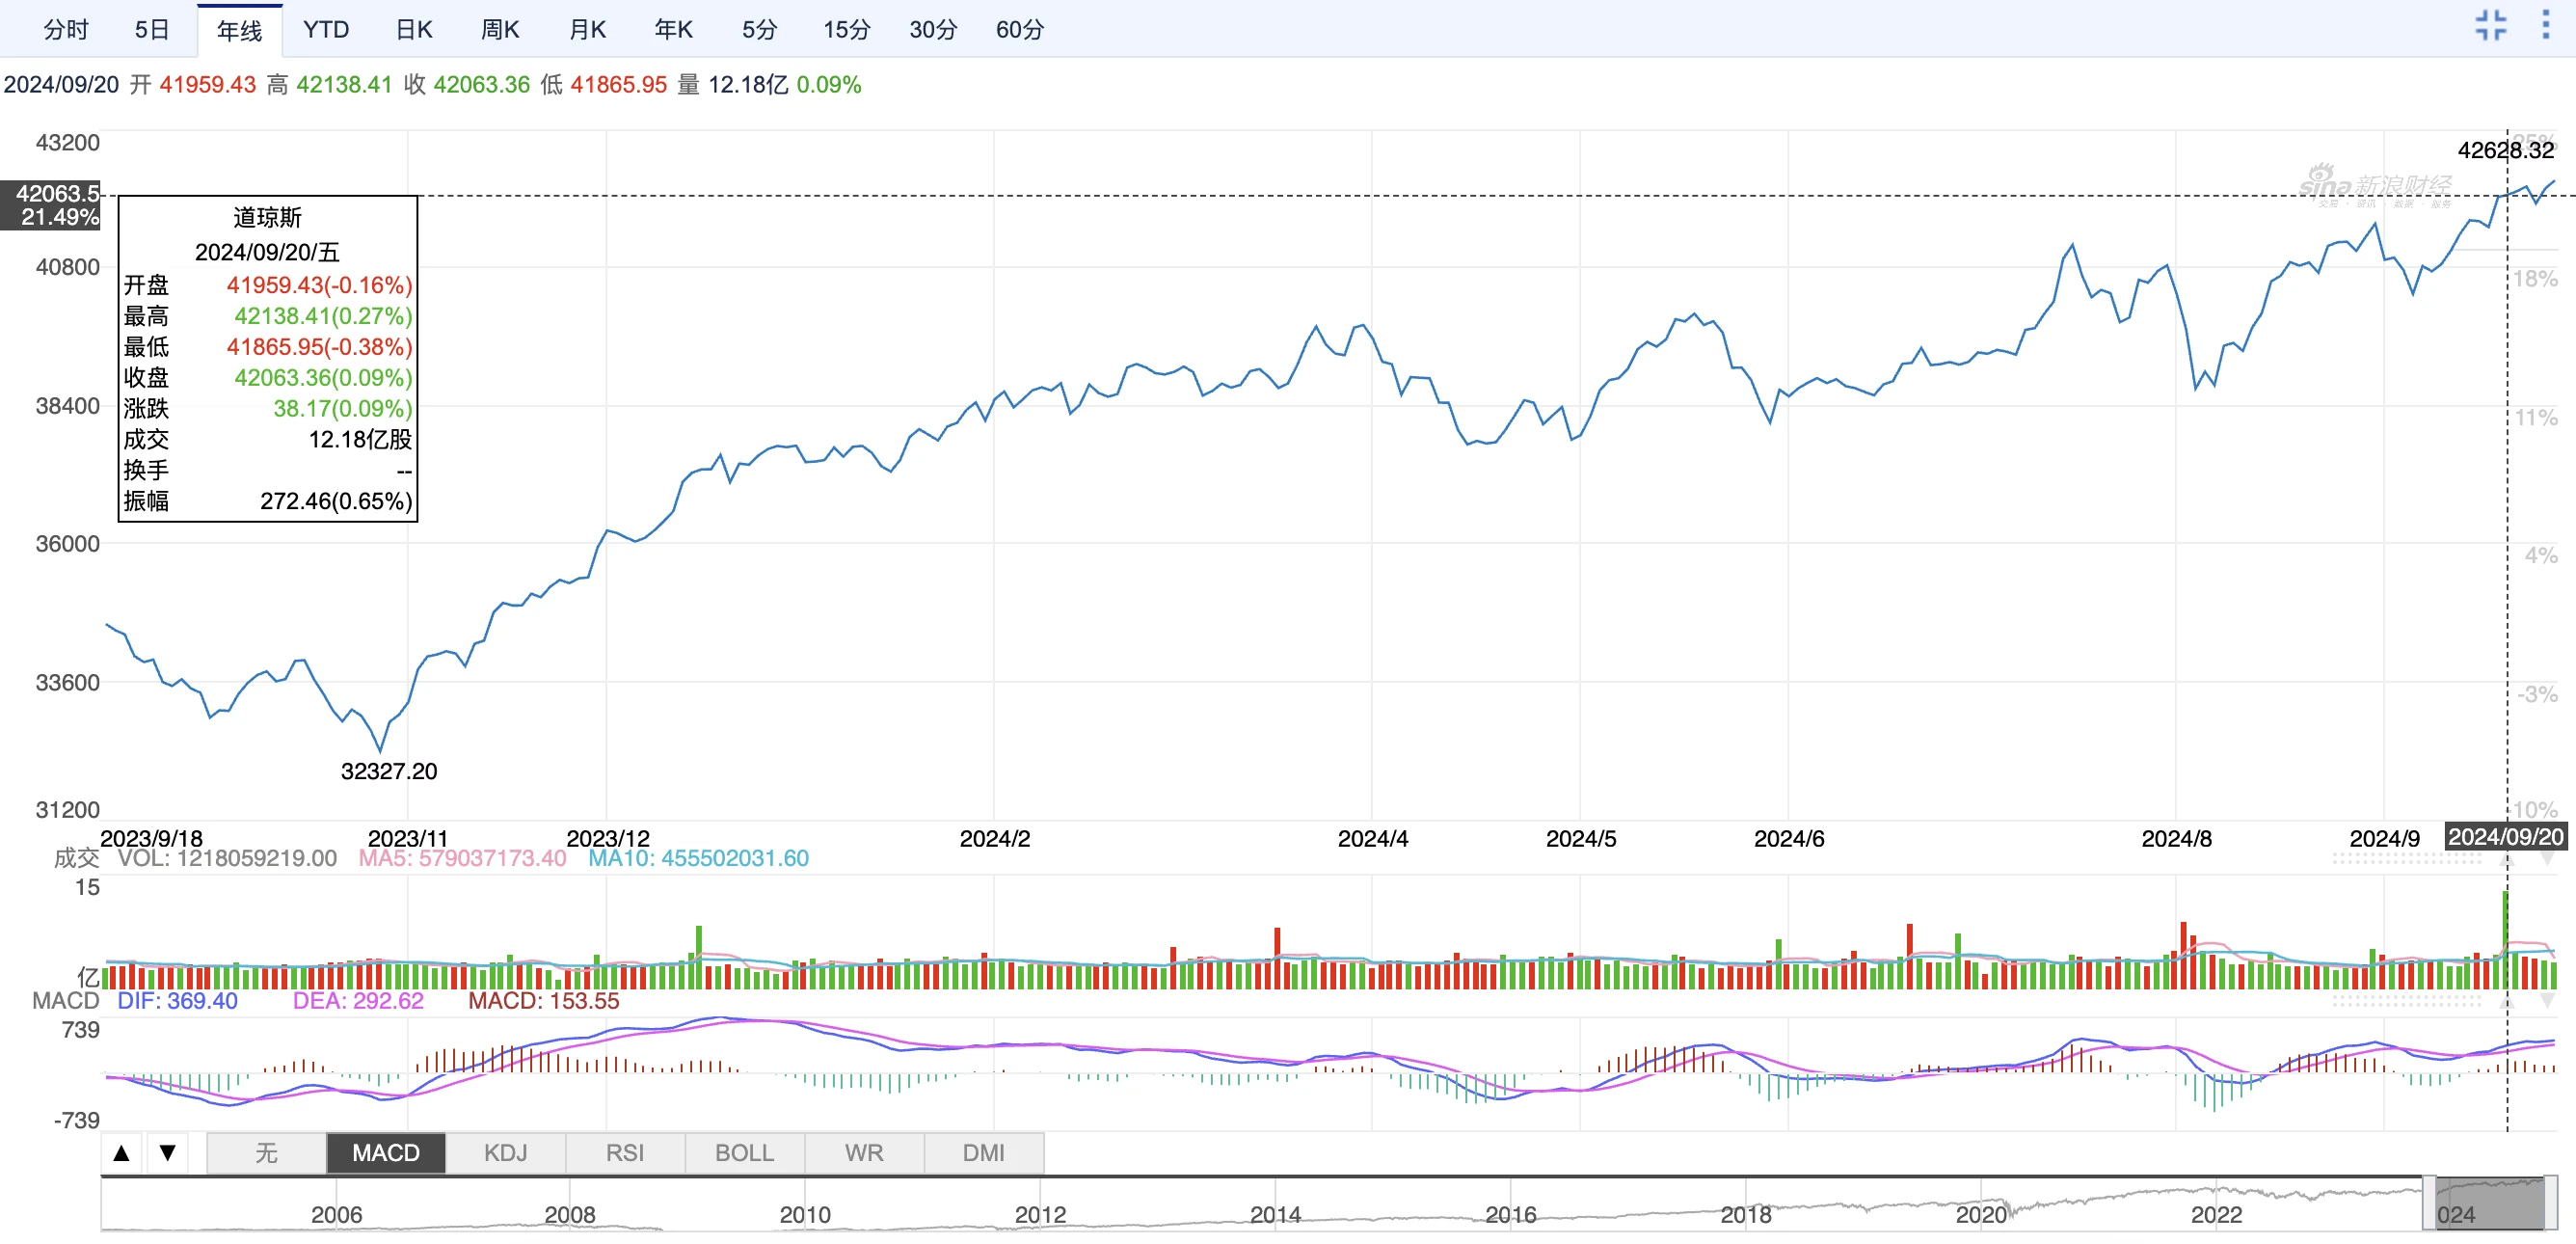
September 20 - The Federal Reserve "Unprecedentedly" Cuts Interest Rates by 50 Basis Points, Global "Liquidity Wave" Arrives
At 2 AM on September 19, the Federal Reserve announced the start of a rate-cutting cycle, lowering the federal funds rate by 50 basis points to 4.75%-5.00%, marking the first rate cut since March 2020. Subsequently, global markets surged, and a series of favorable domestic policies were introduced, including interest rate cuts, reserve requirement ratio reductions, and a package of policies to stimulate the investment market. The "national team" invested hundreds of billions, aiming to boost confidence in the capital market. The recent continuous rise of A-shares is the best evidence, and the "exponential rise K-line" of the Shanghai Composite Index now appears extremely steep, aligning closely with the "To Da Moon" curve long advocated by the cryptocurrency industry.
At that time,
BTC price was around $63,128;
A-share Shanghai Composite Index was around 2,739 points;
US Dow Jones data was around 42,063 points.
BTC Price
Shanghai Composite Index
US Dow Jones
Conclusion: The Correlation Between the Cryptocurrency Market and Traditional Financial Markets is Gradually Strengthening
Looking back at the BTC price trends, A-share index trends, and US Dow Jones trends this year, we can clearly draw the following conclusions:
- After the approval of Bitcoin spot ETFs, Bitcoin's safe-haven asset attribute has somewhat weakened compared to gold;
- After the approval of Bitcoin spot ETFs, Bitcoin's price trends are more influenced by the US Dow Jones index rather than the other way around;
- Bitcoin spot trading, due to its 24/7 trading flexibility, reacts more sensitively to macroeconomic situations and geopolitical factors, with volatility far exceeding that of the US and A-share markets;
- The A-share volatility range, represented by the Shanghai Composite Index, has long remained around 2,800-3,100 points. In comparison, the Dow Jones has shown a more pronounced upward trend, rising from 37,000 points at the beginning of the year to around 42,600 points recently, an increase of about 15%; Bitcoin's price has risen from $42,000 at the beginning of the year to around $64,000 now, an increase of about 52%, making it a "high-quality investment target for the year";
- In the long term, although the current size of the cryptocurrency market (according to Coingecko data, the total is $2.36 trillion) is far less than the trading volumes of A-shares and US stocks, which can reach tens of trillions, there may still be a possibility of "two-way siphoning." Channels such as Hong Kong virtual currency ETF funds and US ETF funds have opened the door for capital inflow into traditional financial markets, but this may also lead to a further return of the already scarce liquidity in the cryptocurrency market.
For the cryptocurrency industry, how to introduce more real-world assets and massive liquidity from traditional financial markets through ecological construction, narrative, application, market, and consumption is the next "industry-level challenge" that practitioners cannot avoid. Mass Adoption may not be urgent, but attracting more capital flow is an immediate priority.
Information Sources:
BTC price data: Coingecko website
Shanghai Composite Index data: Sina Finance
Dow Jones data: Sina Finance - US Stock Market行情
免责声明:本文章仅代表作者个人观点,不代表本平台的立场和观点。本文章仅供信息分享,不构成对任何人的任何投资建议。用户与作者之间的任何争议,与本平台无关。如网页中刊载的文章或图片涉及侵权,请提供相关的权利证明和身份证明发送邮件到support@aicoin.com,本平台相关工作人员将会进行核查。


